
Hi all,
These are some updates of Holistics in December 2021
Let’s take a quick look at some exciting features plus updates we’ve been working on in the last month.
Community Revamp
The number of analytics use-cases and feature suggestions has been growing dramatically in the last few months. Therefore, we decided to revamp our community to make it a better playground for you. By visiting community.holistics.io, now you can:
- Get up to date with our latest releases
- Discuss use-cases and how Holistics should be developed
- Get help not only Holistics staff but also other Holistics Powers Users
- Suggest improvements, request features, report bugs, or vote for the features you want to have in Holistics
- Share your tips and hacks with the community
Community Highlights
- Tip: Embedding an image in your dashboard by @david-ri
- Tip: Changing the display label of legend by @anthonytd
- Feature Suggestion: Order by another dimension by @alex_h
We look forward to seeing you there.
New update on Analyst’s Permission
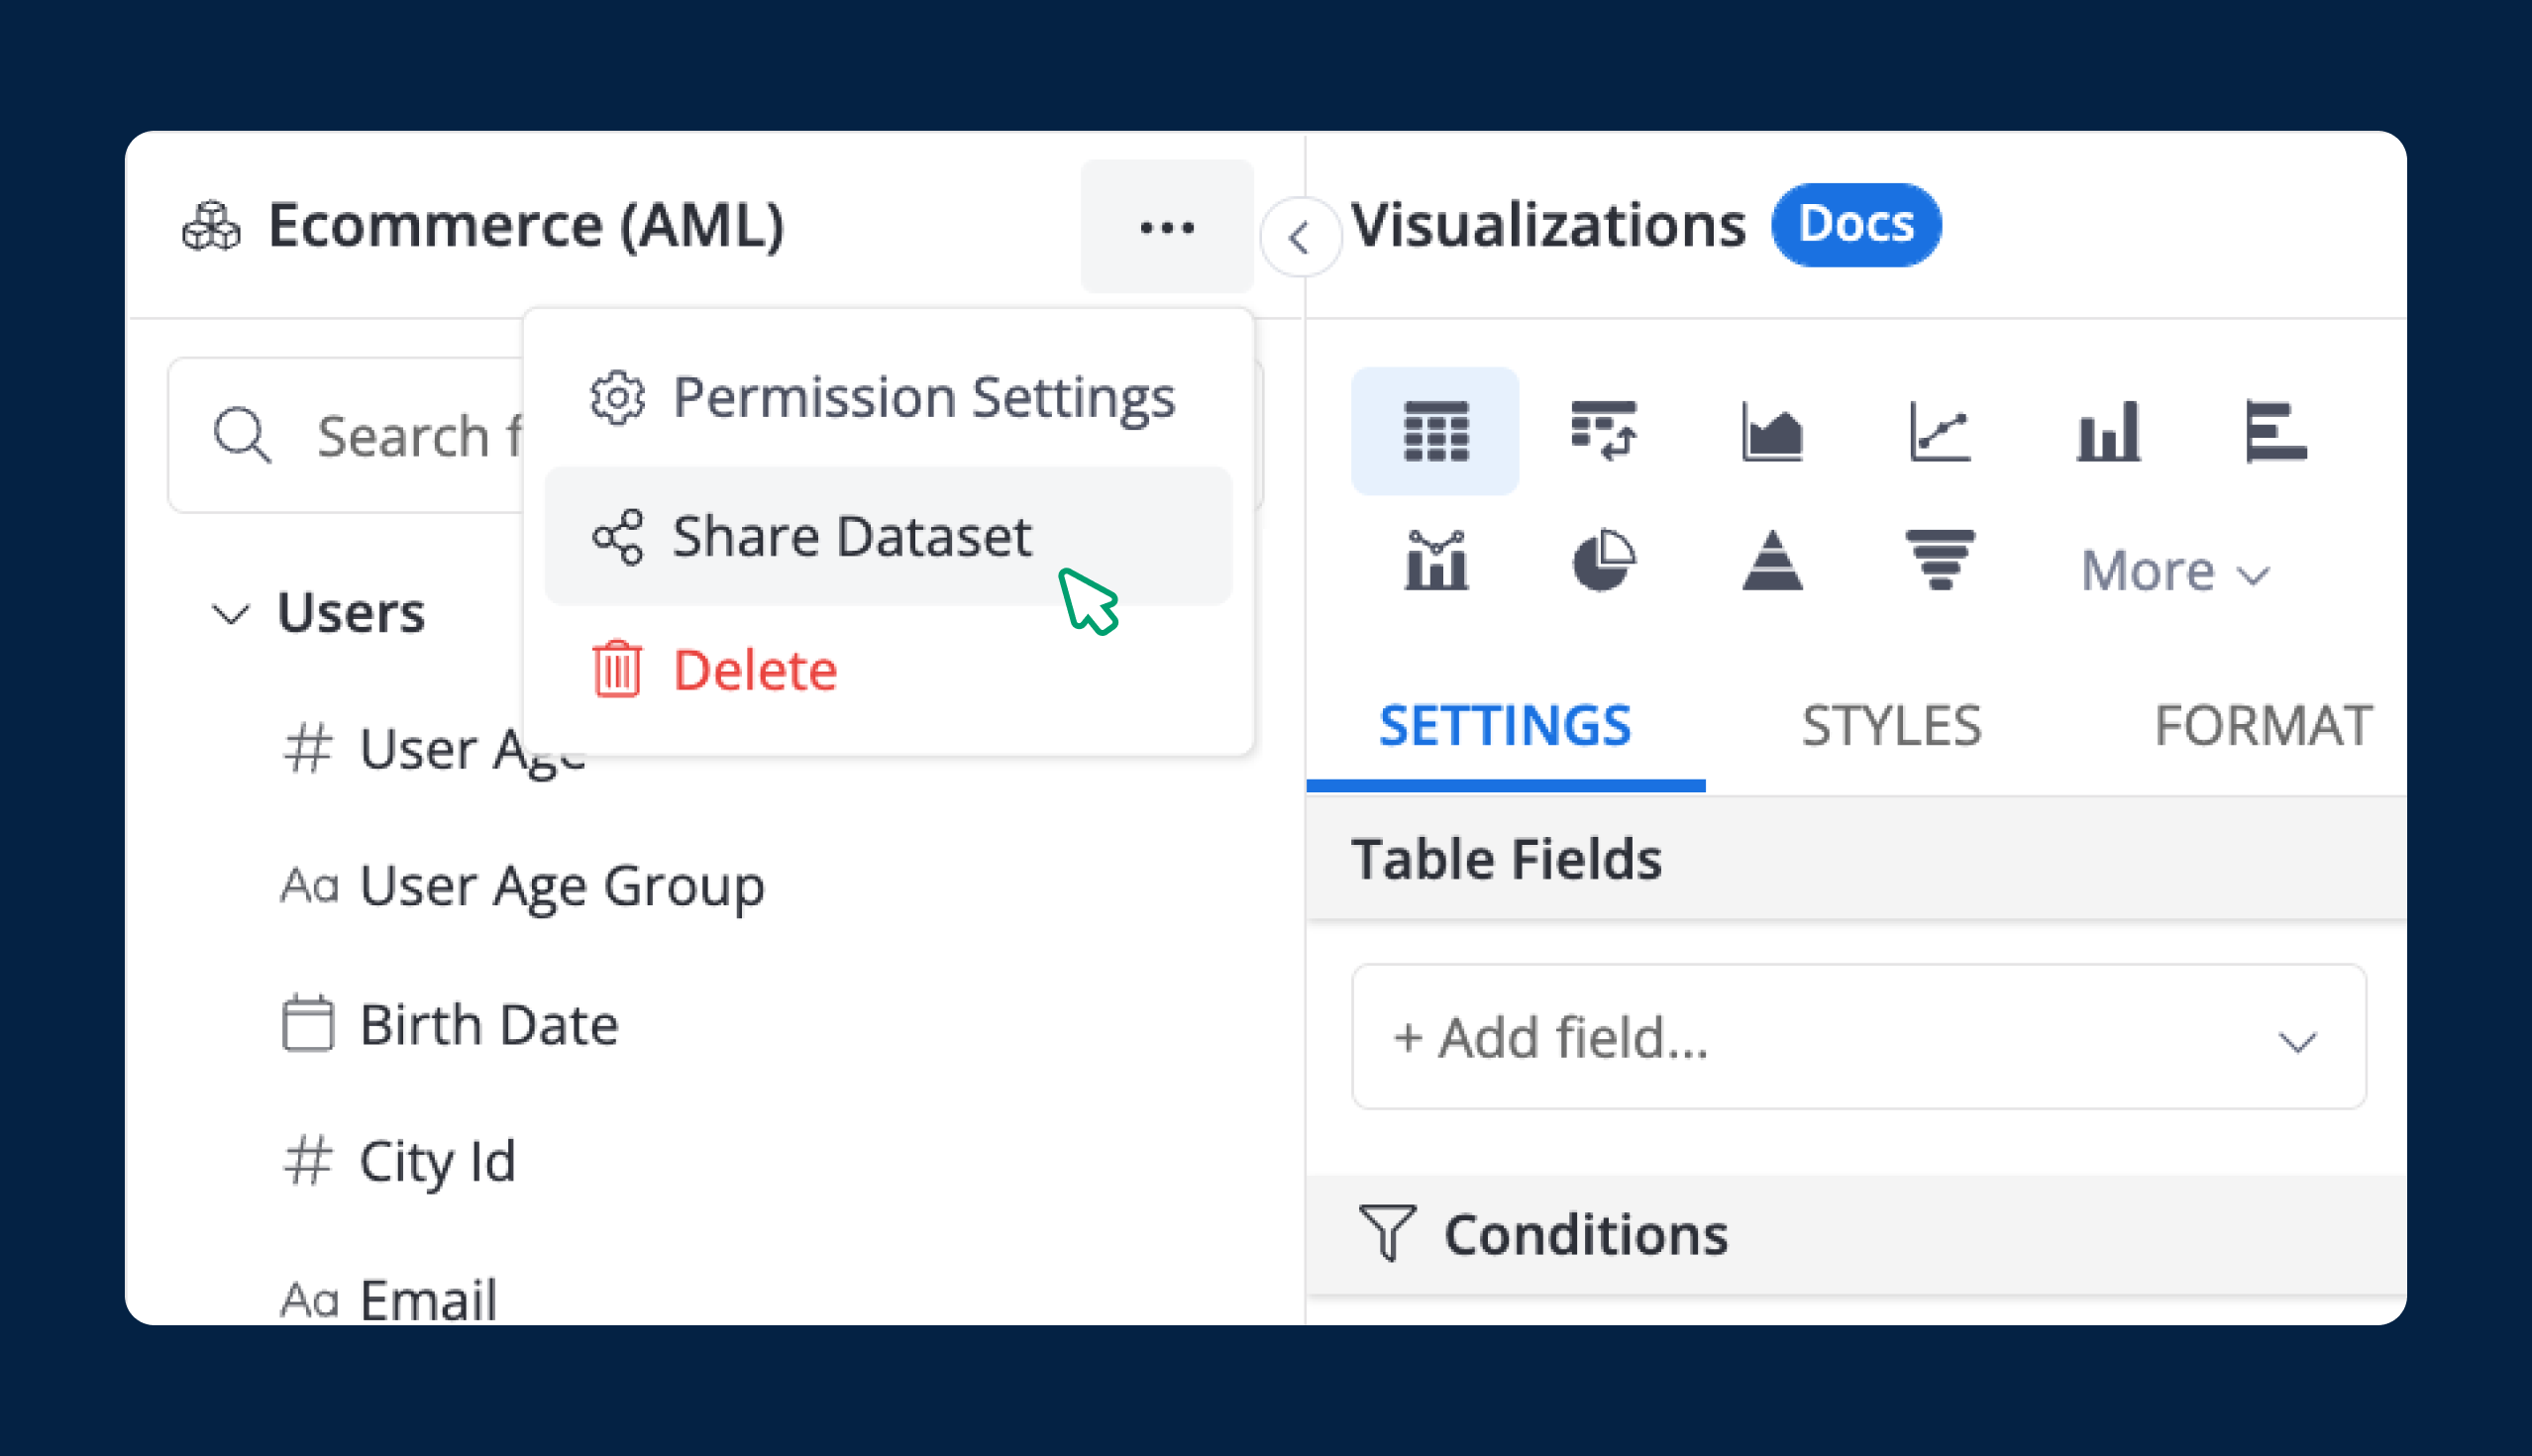
With our new update, Admin can allow the Analyst role to explore and create reports from any datasets without granting them access to the Data Modeling Layer.
To learn more about the feature and discuss its use-cases, you can read our community post here: New update on Analyst’s Permission Holistics Community
New update on Dashboard Appearance (cont.)
You may have noticed a few changes in your dashboard and report recently - borders, fonts, text color, and more. Our team is rolling out some new improvements to make them look fresher and cleaner. You can expect some other changes in the next few months and let us know any of your feedback on the new look.
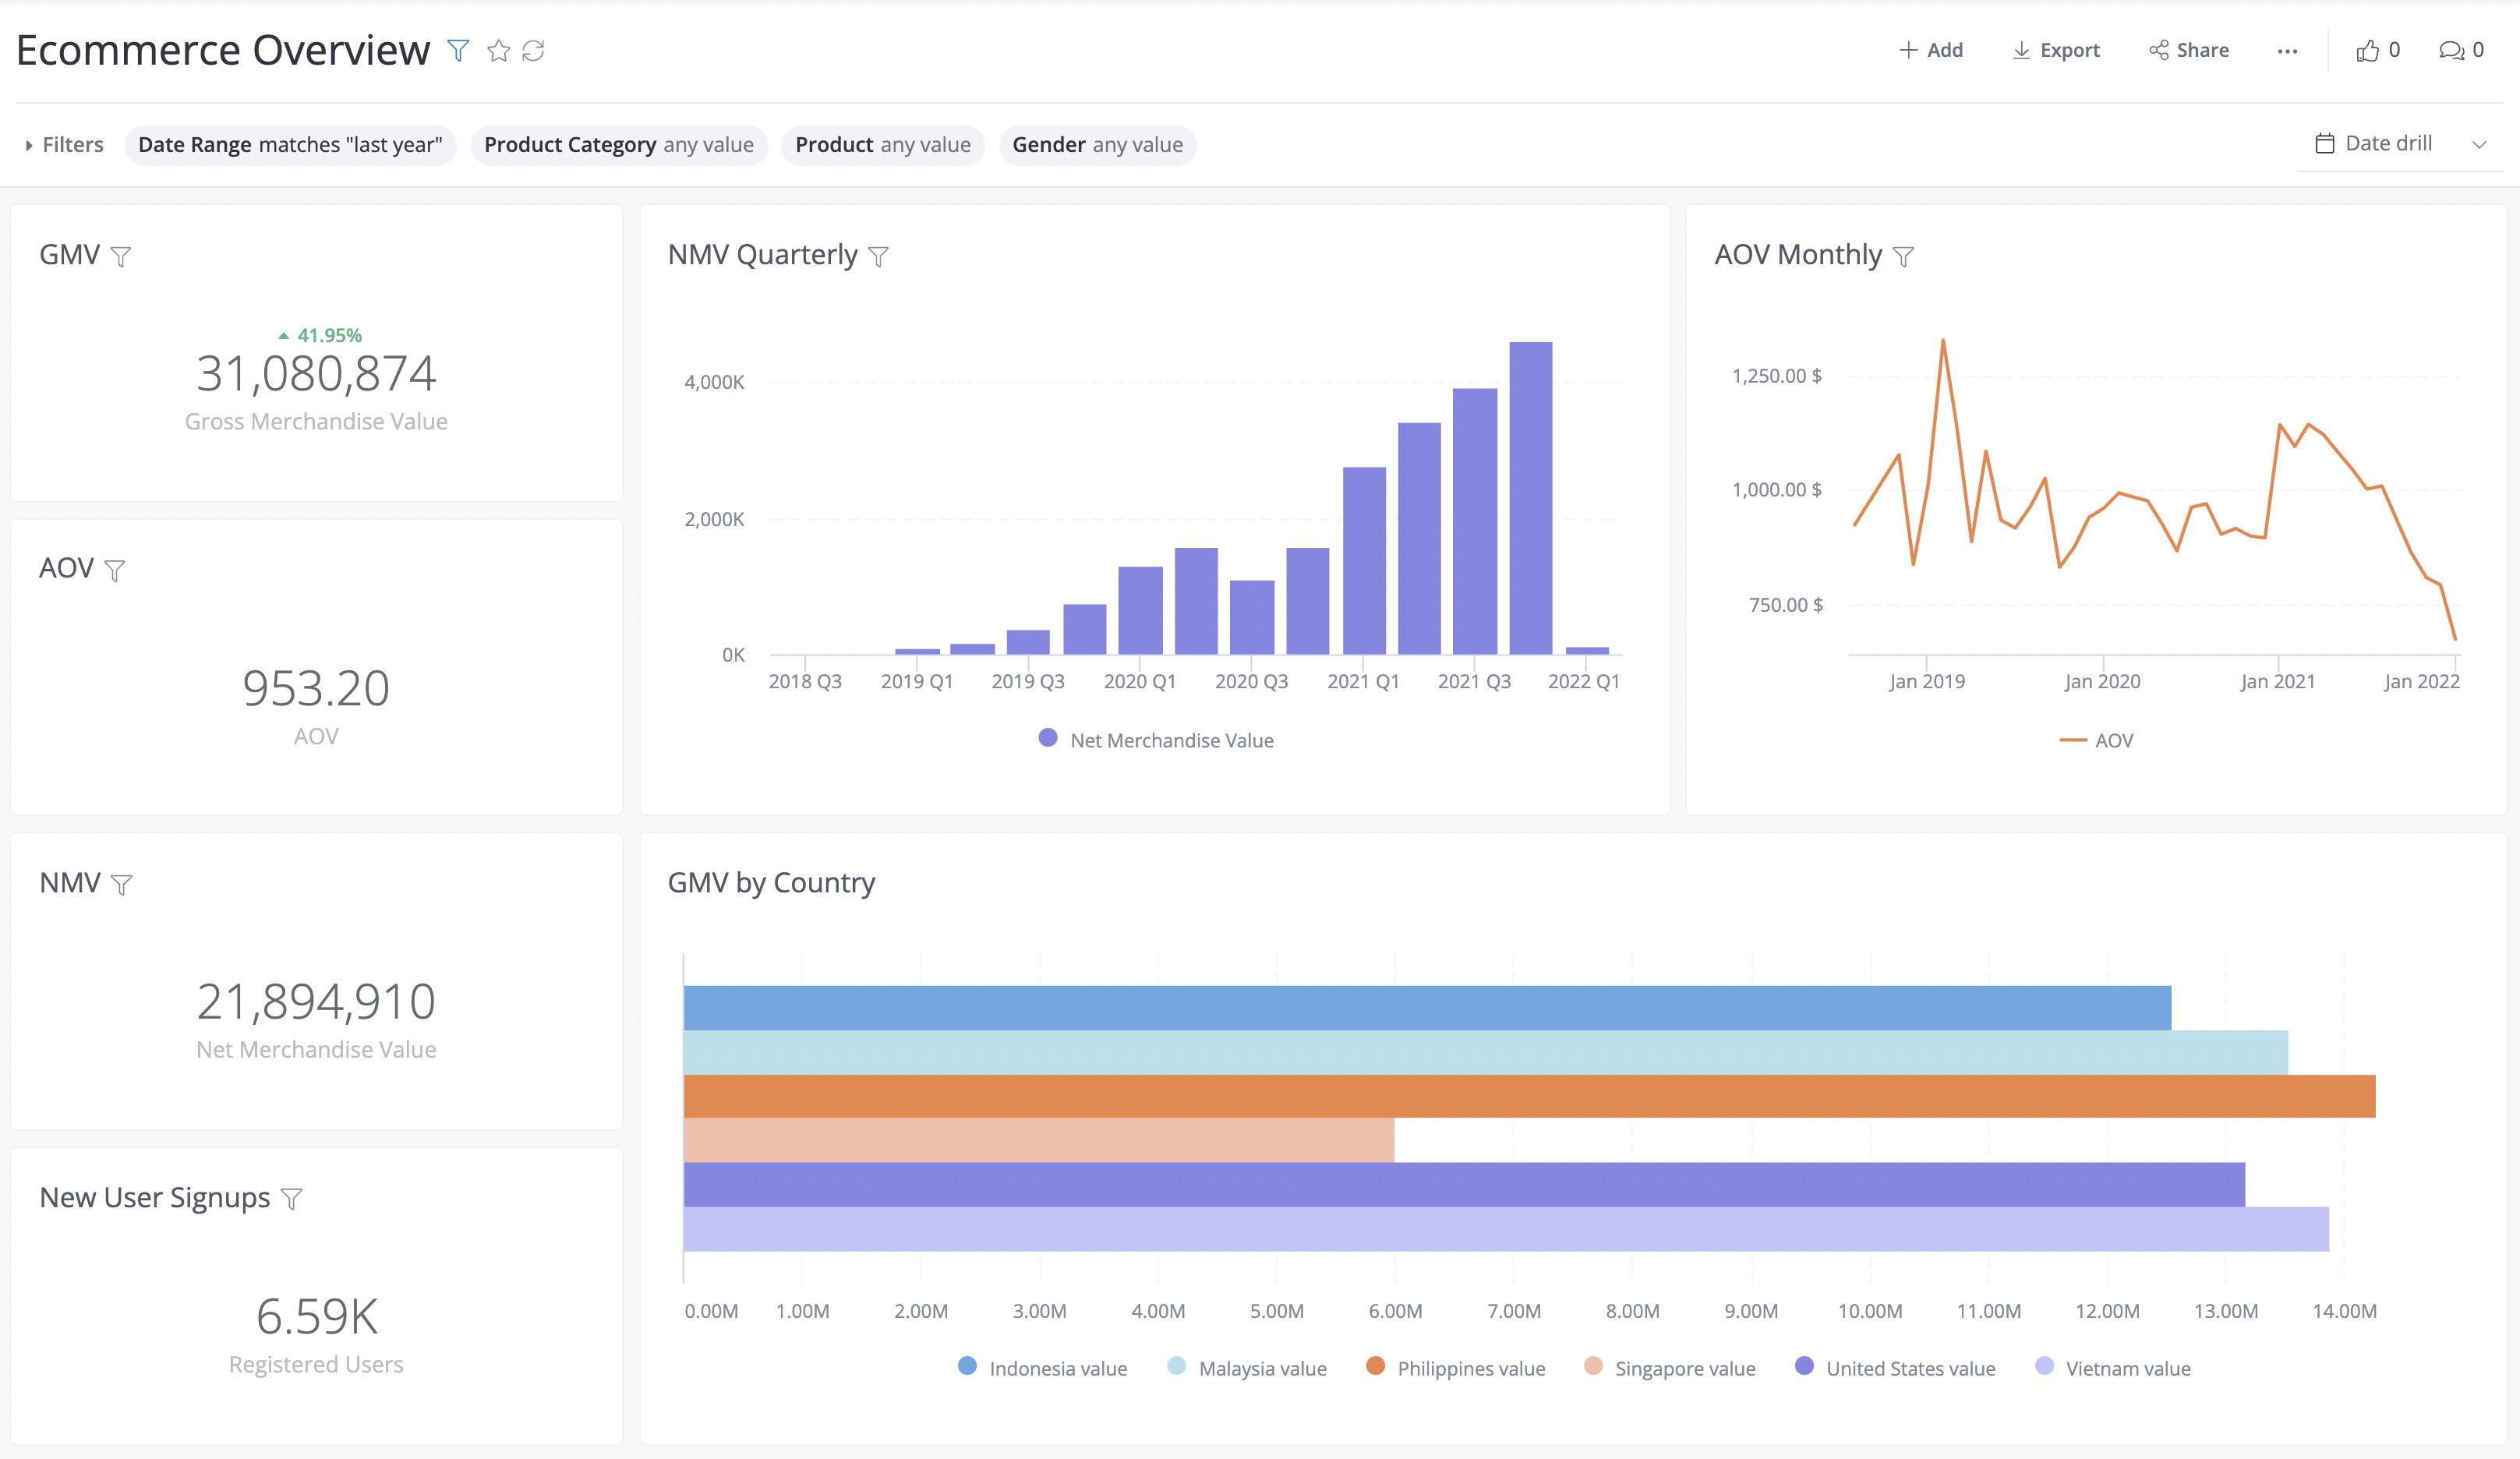
You can also enhance the look and feel of your dashboard on your own by following our tips here: Tips for making your dashboards more attractive - Tips and Hacks - Holistics Community
Running Total
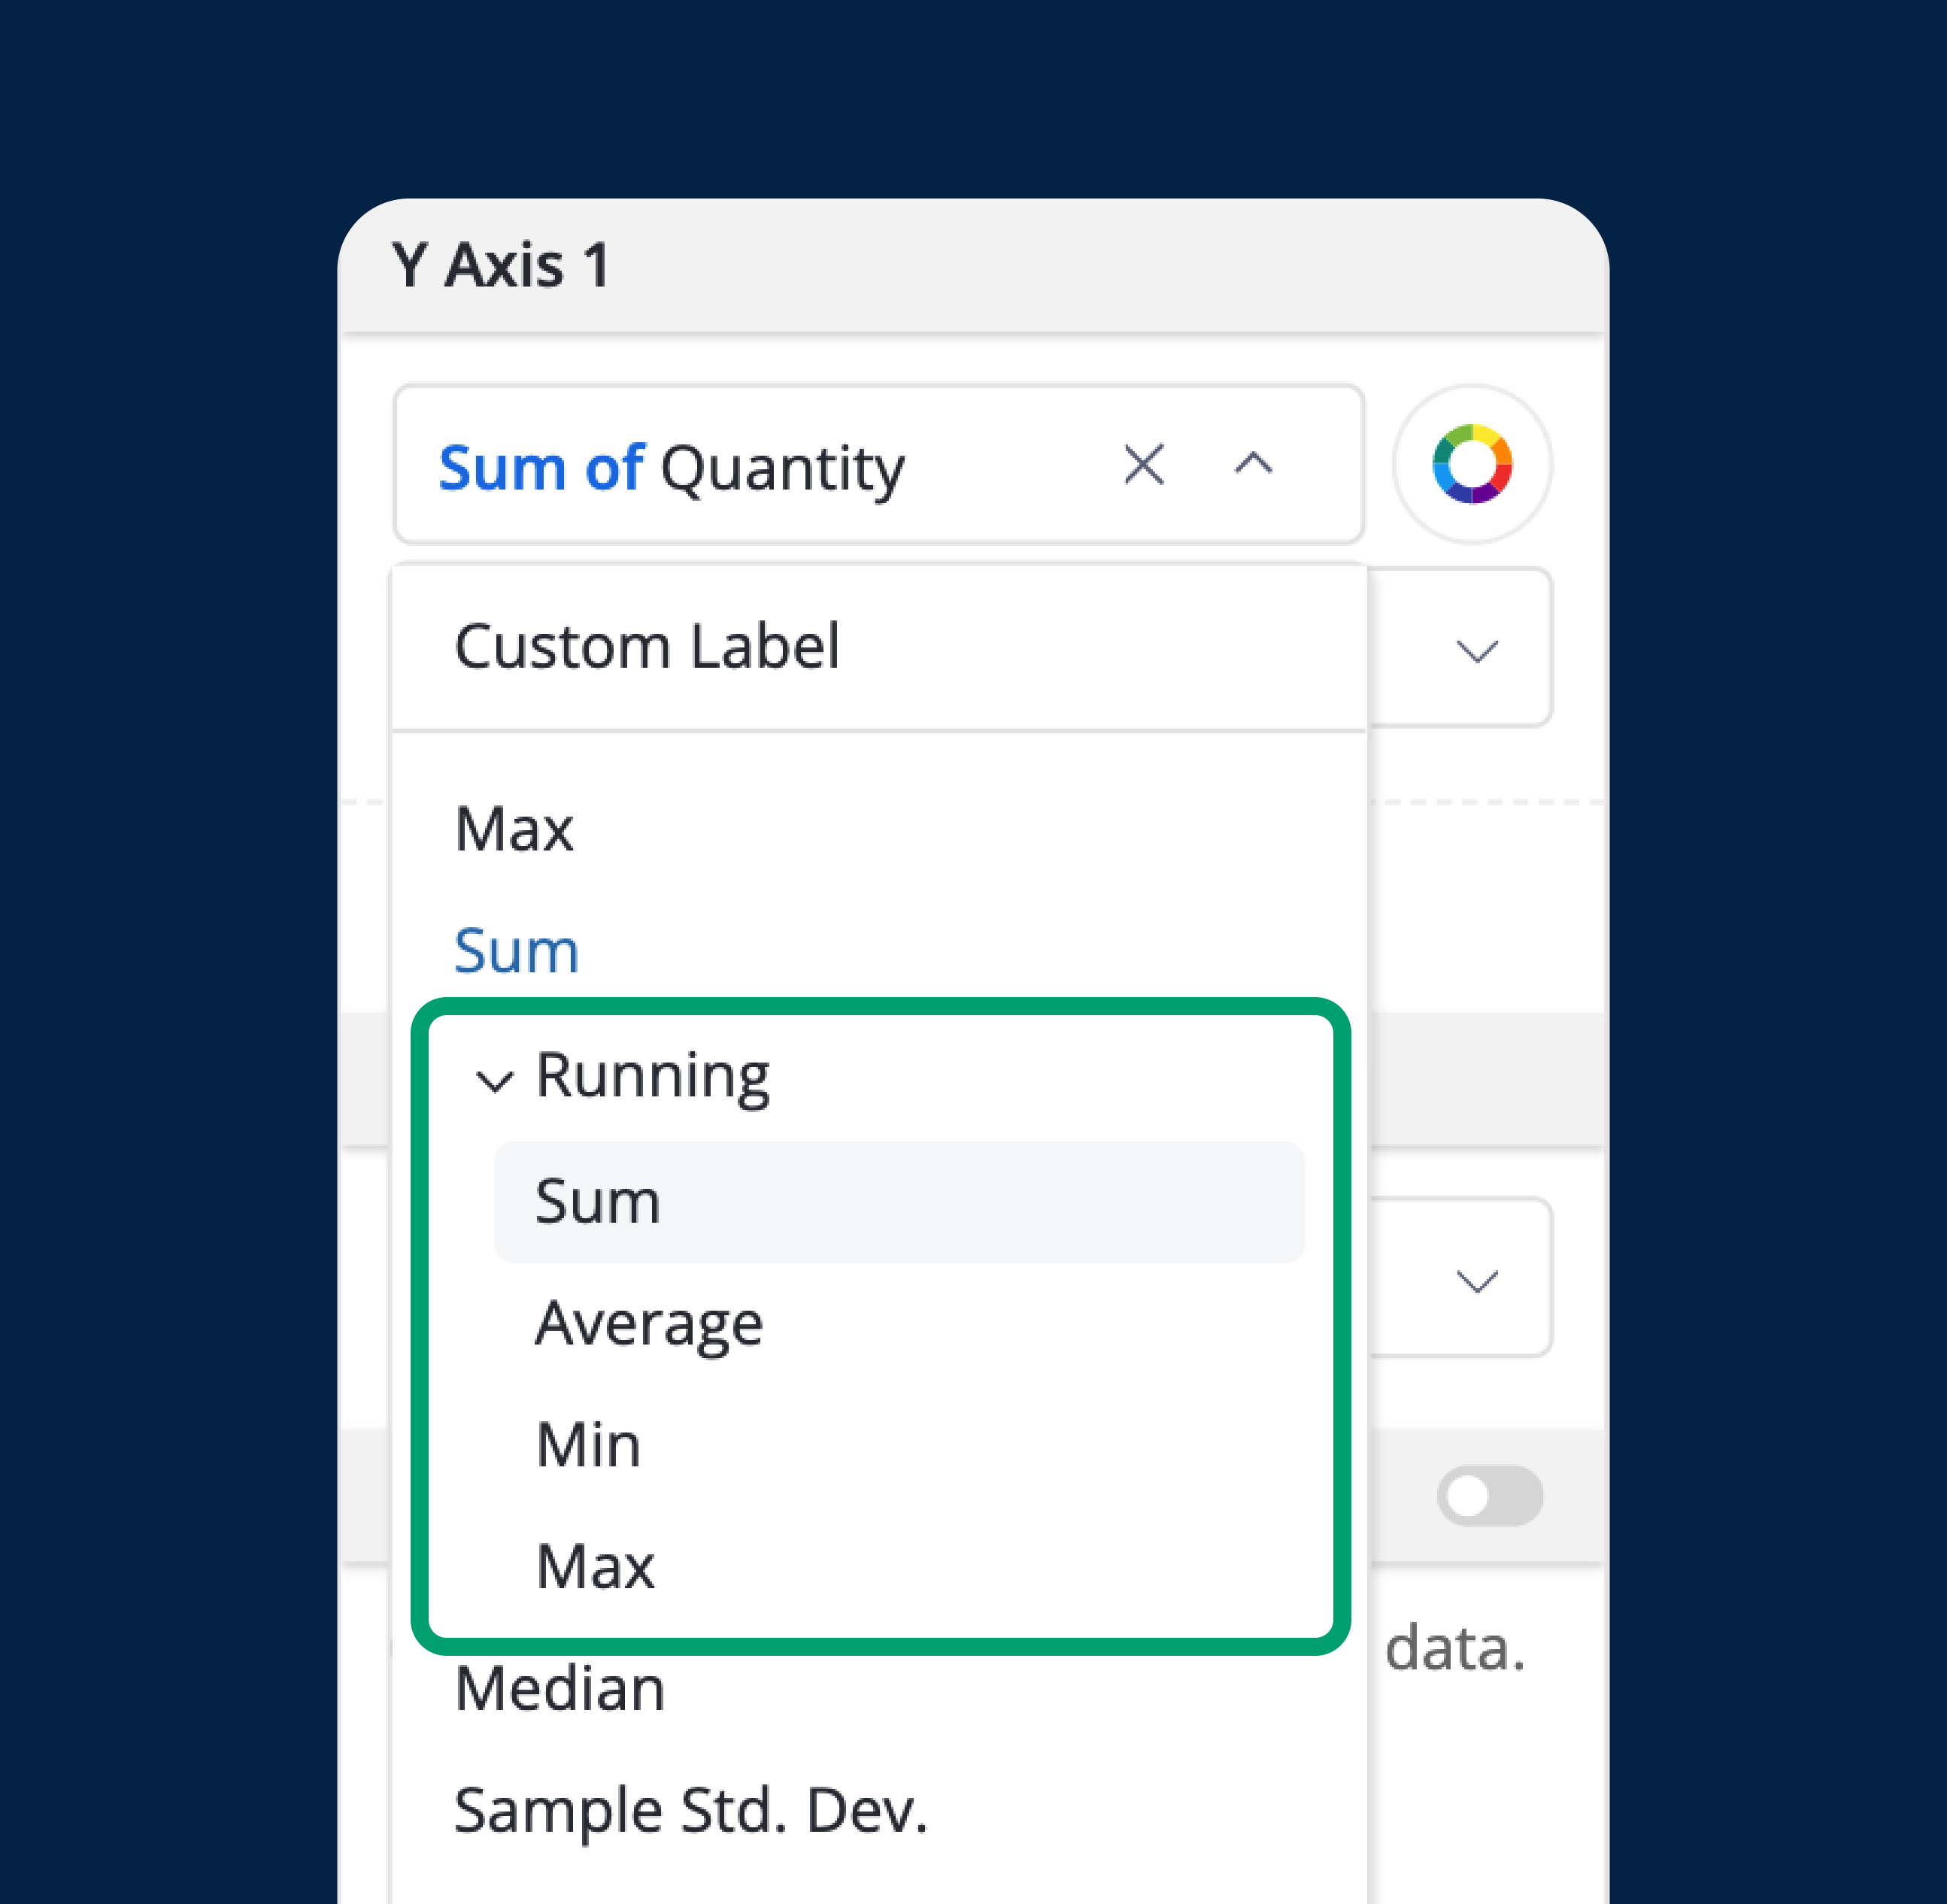
Previously, you could create Running Totals using our Transform Model, though that requires some SQL knowledge.
Now, with just a few clicks, you can immediately create a Running Total field in the Visualization Settings.
To learn more about the feature and discuss its use-cases, please check out our community post: Launched: Running Total (Cumulative Sum, Avg, Min, Max) Holistics Community:
POP on Pivot Tables
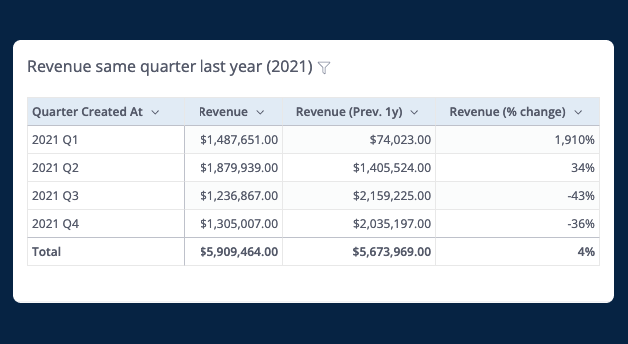
We have finally supported Period over Period for pivot tables (Oh, we also added the % change!) Go to Visualization Settings, select Pivot Table, and scroll down to enable Period over Period Comparison.
For more information about Period over Period feature and discuss its use cases, head over to our community post: Period over Period Comparison Holistics Community.
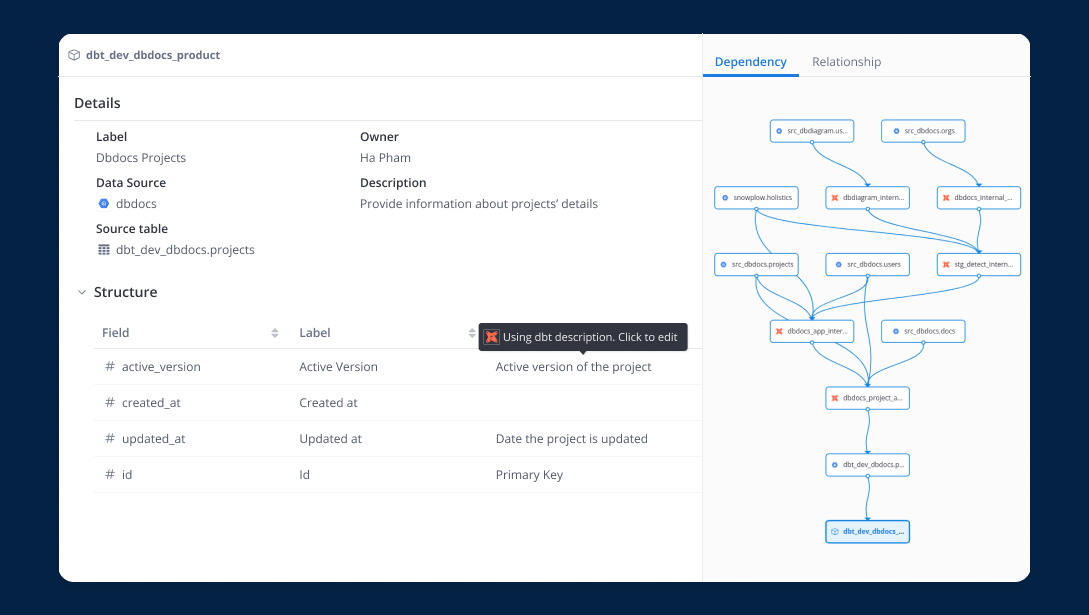
dbt Integration
With dbt integration, we are providing a more seamless and connected data workflow between your current dbt project and the BI layer. You will be able to expose your dbt’s metadata (models’ description or columns’ description) to your business users easily.
To learn more about the feature and discuss its use-cases, please refer to our community post here: dbt integration
Git Integration
With Git Integration, you can commit your analytics code to Git and track every change, perform branching, code reviews to ensure accurate analytics workflow.
To learn more about the feature and discuss its use-cases, please refer to our community post about git integration

 Upcoming
- Permission on Private Workspace
- Timezone Settings (MySQL and MSSQL)
Data Joke
Q: Have you heard of the latest statistics joke?
A: Probably