Hi all ![]()
Here is a quick recap’ from June 2022 that you can go through while sipping your coffee.
Community Highlights
Before we dive in, let’s shed the light on these community posts:
- Feature suggestion: Liquid template support for field formatting from @Alex_H
- Feature suggestion: Dynamic Dashboard Titles, or the option to change title before Exporting from @tasha_launchcode
- Automatic Holistics’ integration with dbt using Github Actions from @Quynh Le
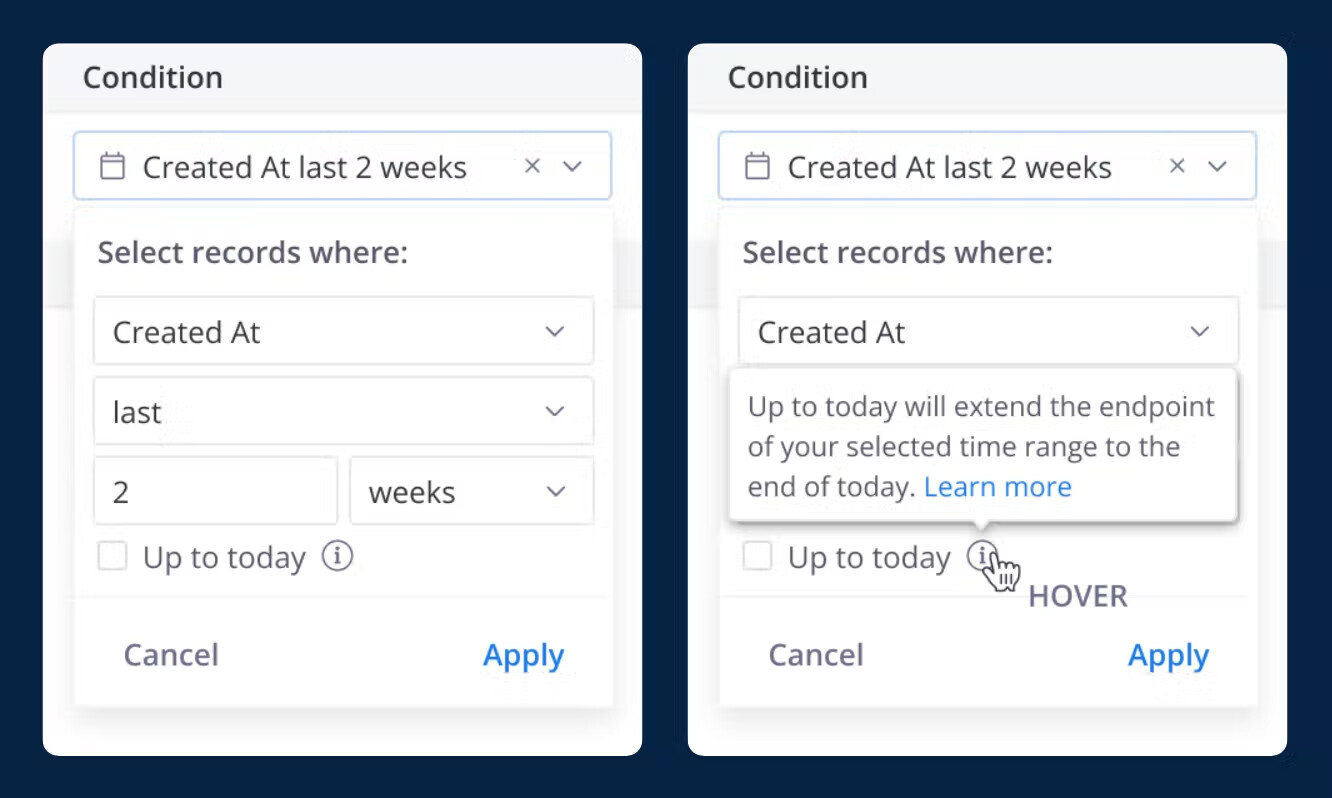
Ability to include the current period in “last” & “next” operators
An improvement to our date filter’s ‘last’ & ‘next’ operators, where you are able to include the current period.
For ‘last’ operator, the option will come in as “Up to now” or “Up to today”, depending on the time granularity chosen. The same goes for ‘next’ operator.
Custom Charts (official release coming soon)
After the beta phase, our official release for Custom Charts is on its way here soon!
In this release, aside from the ability to create highly customized charts, you’ll also have other Holistics features at your fingertips. These include Data exploration, Export & Schedule, Holistics format, and so on.
In the meantime, you can still contact our team at [email protected] to beta test this feature.

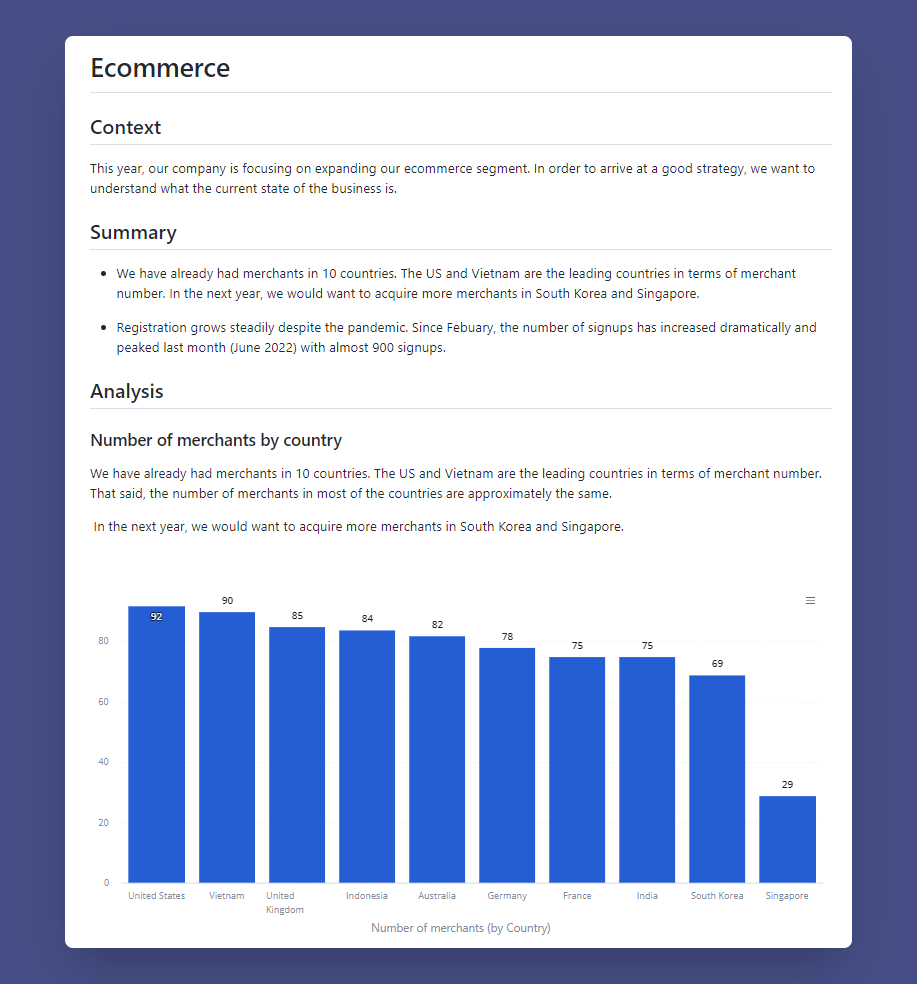
Ability to create Narrative Analysis Reports by typing AML and Markdown.
Last month, we organized a Weekathon and discovered a ton of innovative ideas such as VS Studio Extension for AML, Narrative Report, NLP Data Discovery, etc.
One of the ideas spot on is Narrative Report, a document-style report format that allows you to add text, charts, and filters by typing markdown.
As Self-service is one of our focuses at the moment, we decided to explore this idea further to enable data teams to tell better stories with data.
Please leave your comments under this community topic to discuss how we should build this.
 UX updates we’re excited about
-
We fixed the uninterrupted error messages spilling out of the Description box.
-
Truncated items in the dashboard & widget list now show their full name on tooltips when hovered.
-
We removed the redundant confirmation step when you duplicate a widget inside a dashboard, one less friction.
-
You can now press Enter after renaming the widget to apply new changes (and it will also automatically close the modal
 ).
). -
The “Submit” button when creating a new dashboard is now the “Create” button.
-
We fixed the bug where Dataset still appears after deleting, ensuring the action has immediate effect.
-
We updated the error message in Business Calculation from “AML is required” to “Holistics Expression is required” to be more comprehensive.
-
Widget’s tooltip now overlays the axis number.
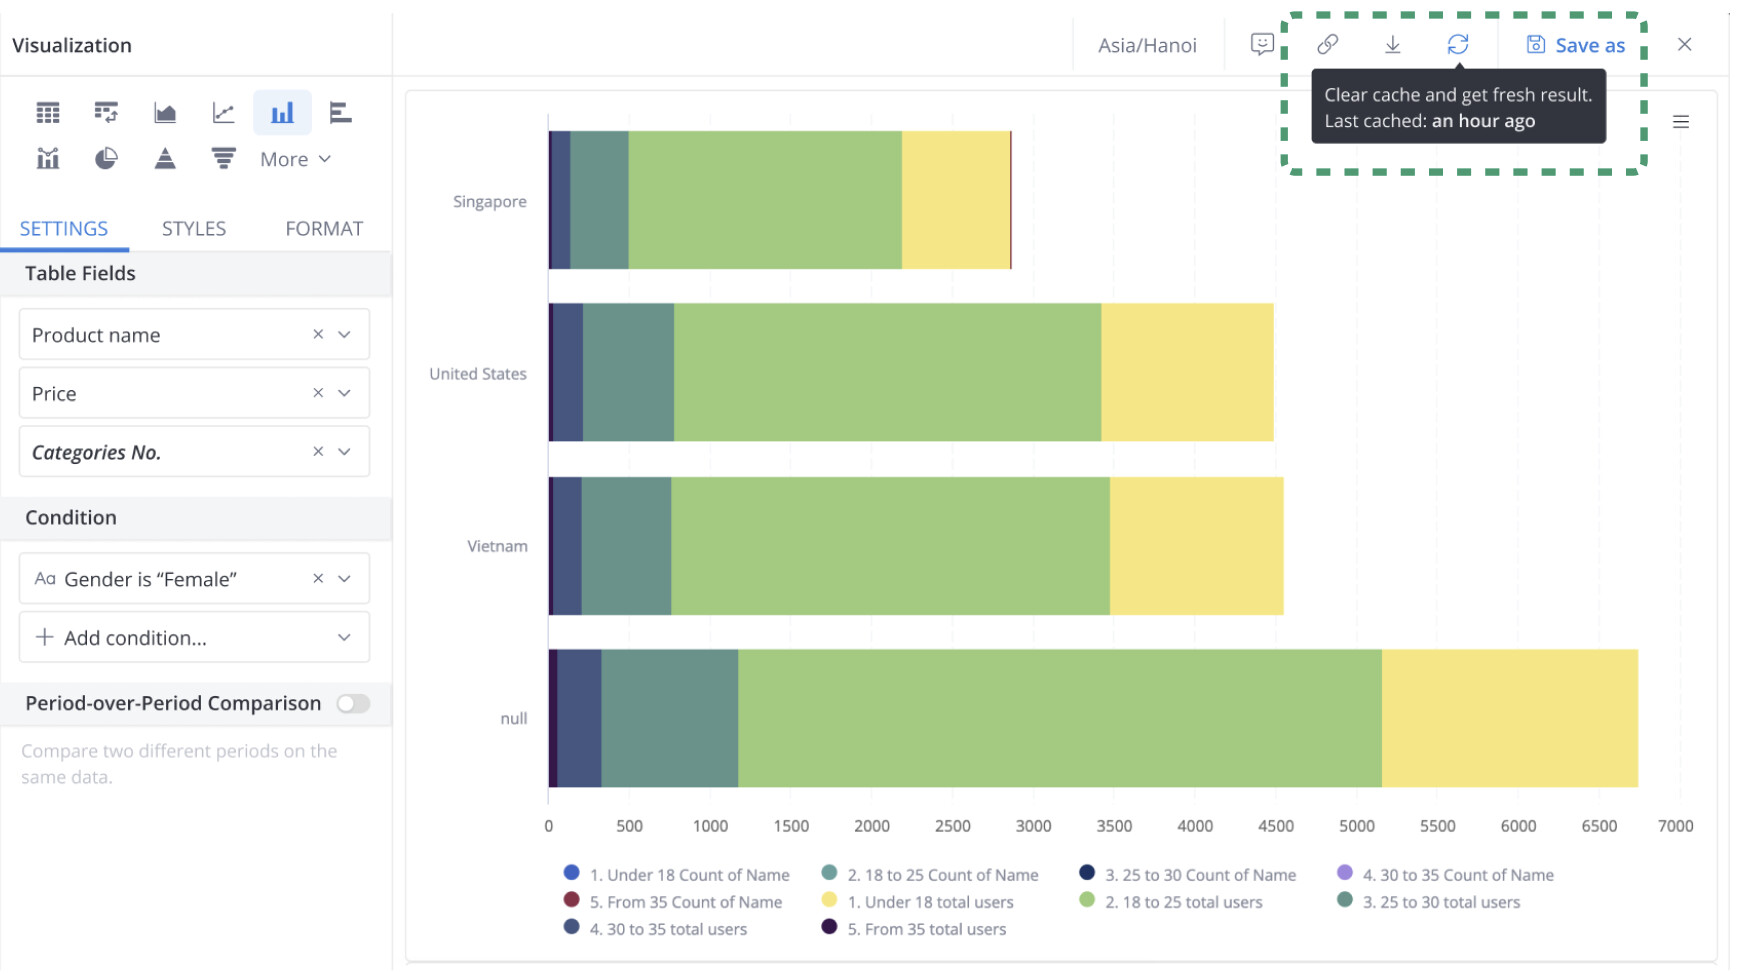
- Selected fields are now marked with a darker background. And you can quickly grasp the number of selected fields in one model by looking at the figure next to the model title.
- We added Refresh Button, allowing users to get fresh data.

-
When the Dependency chart has some nodes with long titles, you can hover over them to see the full names in tooltips.
-
We updated the description of all modeling dimensions’ modals to be more precise.
-
AML tabs are now showing tooltips on hover, no need to guess what those tabs are.
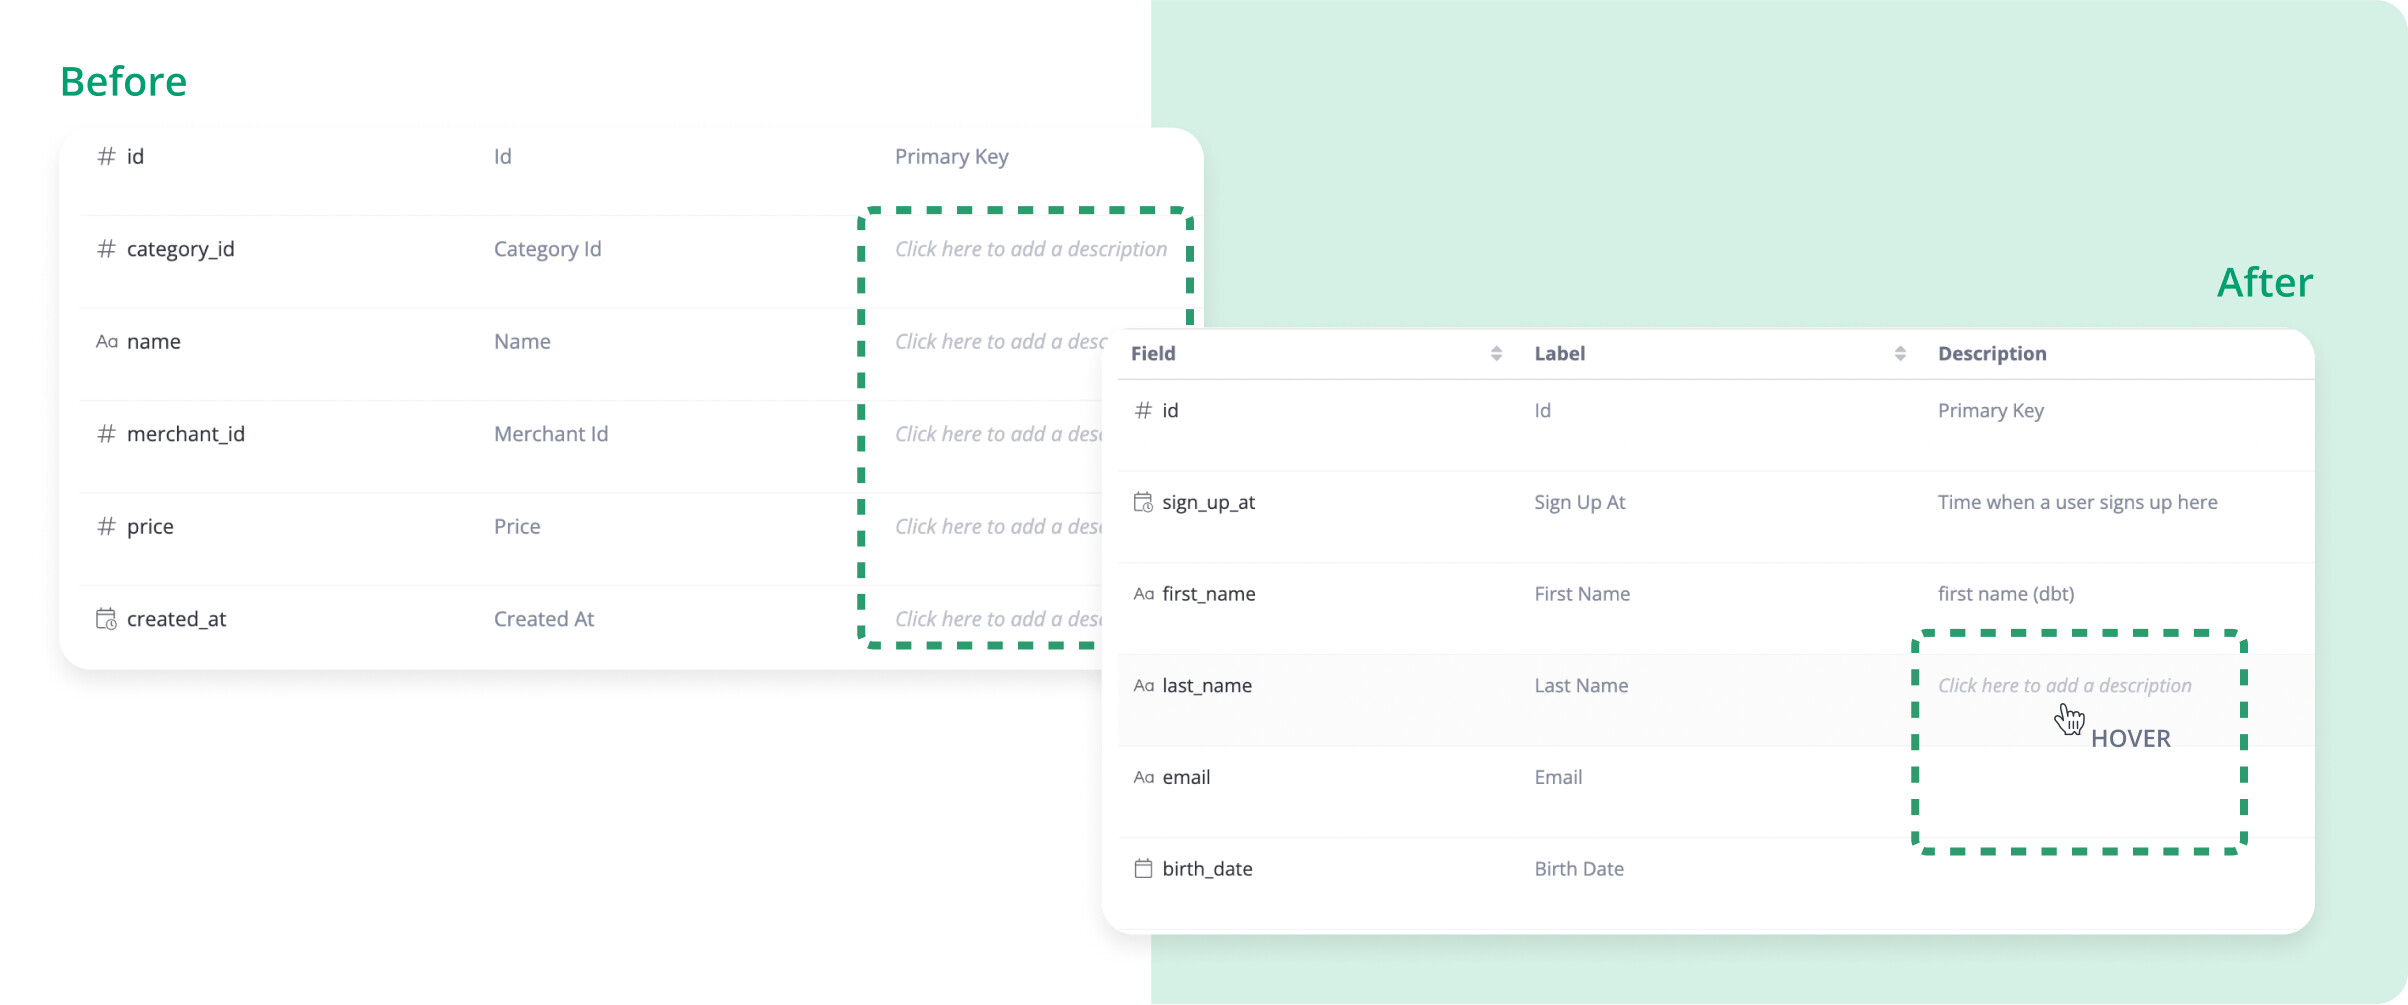
-
Cleaned up the “Click to edit” text when hovering on description columns so the UI is cleaner now

Data Joke

That’s all for June.
Cheers,