Thursday, October 12, 2023
Hello hello, friends of Holistics,
In September, we’re making some great updates to our Dashboard As Code, making it easier to build reports using code and have fine-grained control over viz, layout, content, and reporting architecture.
We started testing this internally last month, so before we get to the demo, here’s a peek at how here’s a peek at how some of our data team has been using it:
- Triet Le (Analytics Engineer): “I can code the entire dashboard into a narrative that people want to read and engage with.”
- Huong Le (Data Analyst): “It becomes a lot easier to reuse a dashboard. I just need to clone it, change filters, change dimensions, and re-format it on the fly.”
If you’re as excited as we are, stay tuned. We’re running as fast as we can to get this on your hands! ![]() Without further ado, here’s the new demo.
Without further ado, here’s the new demo.
 Build dashboards using code
With this feature, data analysts will soon be able to adopt software best practices in dashboard development.
Through codification, you can have full control over the content and design of your dashboards, easily revert changes, make bulk updates, version control with Git, and have reusable visualizations everywhere.
How do you see this feature being useful to your team? If you have any feedback or suggestions for us, please share them here. We’re all ears.
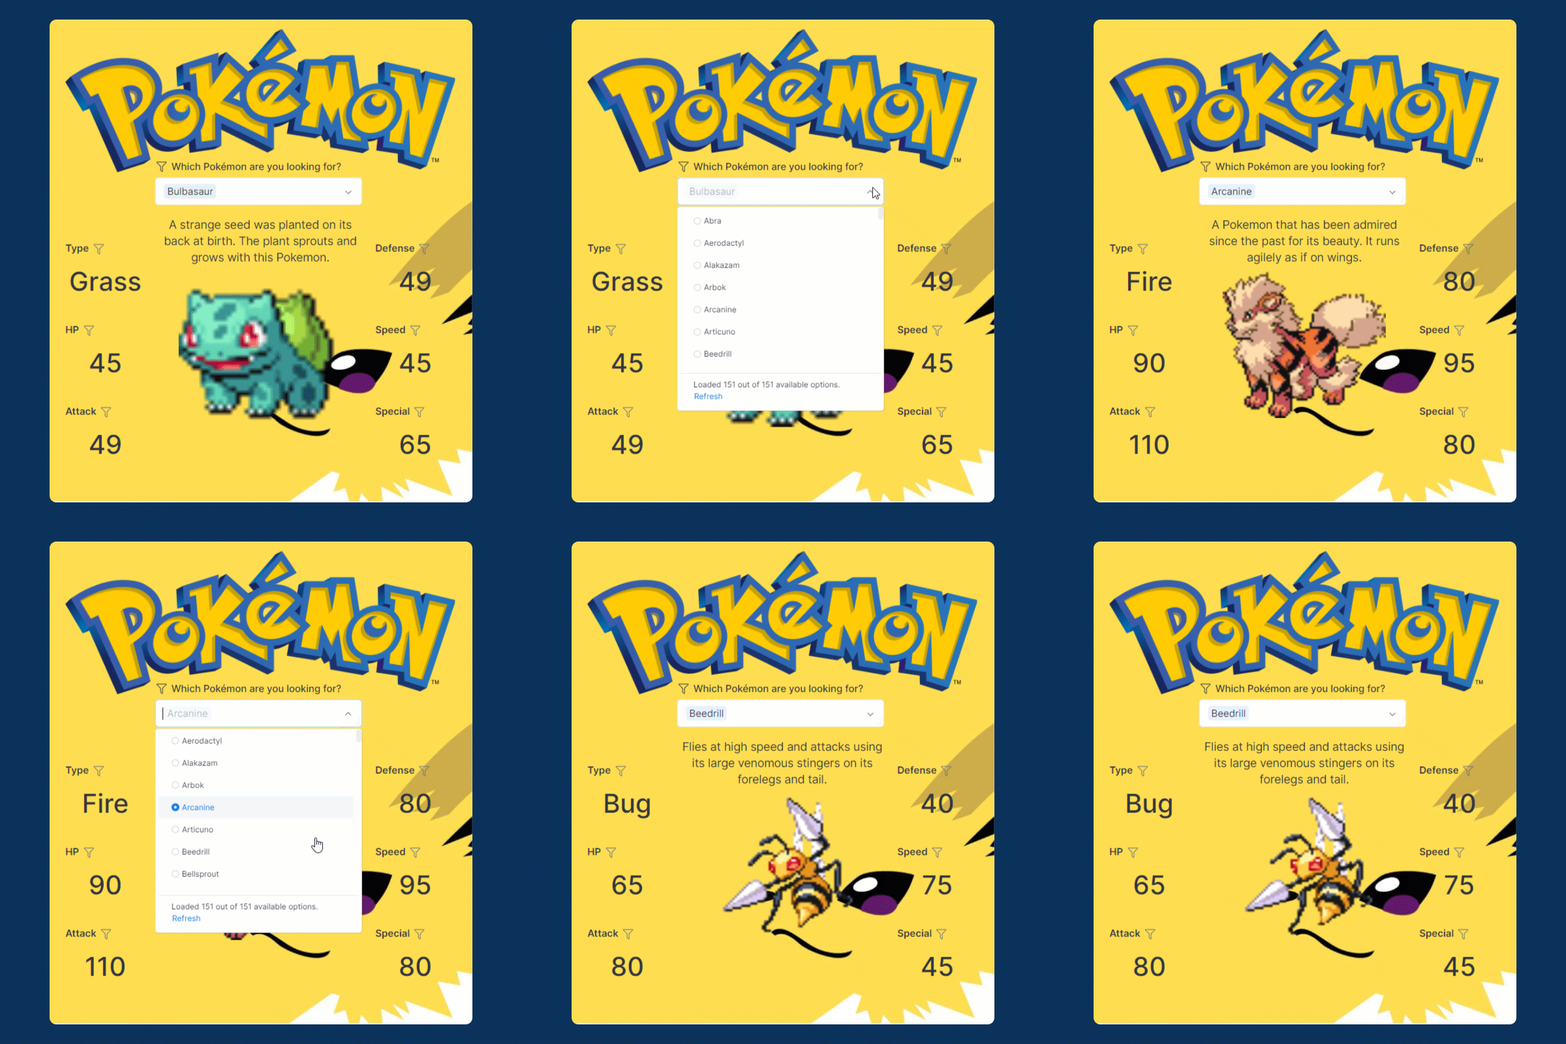
P/s: We had a lot of fun testing this feature. Our team was even able to whip up a Pokedex dashboard in just a few minutes.
 Pushing data alerts to your own apps with Alerts Webhook
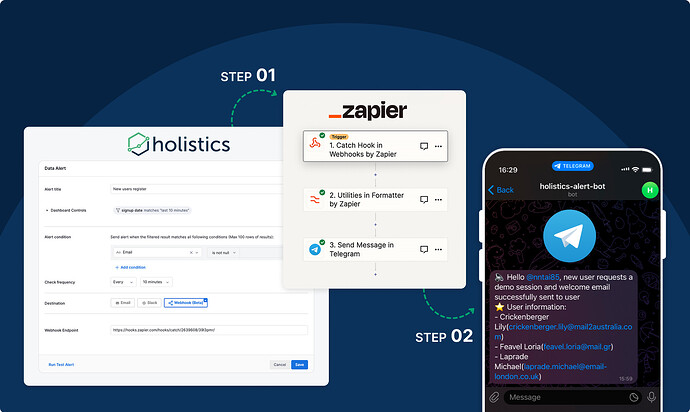
Holistics now supports Webhook for Data Alert, an enhancement to Holistics Delivery capability.
With this, you can quickly set up automated workflows for critical internal communication, like:
- Send alerts to Purchasing team on Telegram about low inventory
- Buzz marketing team on Slack when ad spending goes over the limit.
If you have any feedback for us, feel free to share it in our community post here: Sending Telegram message from Holistics Data Alert via Zapier.
 Dataset description for better collaboration
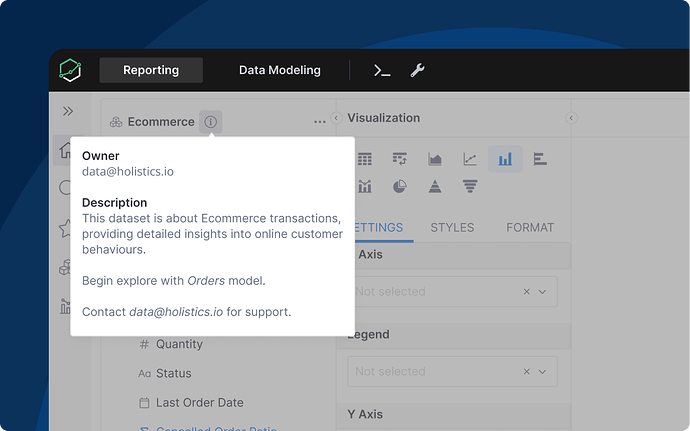
What is this dataset about? How should I use it? Who can I contact to learn more about using this dataset?
Sounds familiar? Business users need to really understand a dataset to self-serve effectively. This is why how you present a dataset is as important as how you design it.
From now on, you can write markdowns to add Descriptions to your dataset, making it easier for business users to navigate and explore the data you’ve prepared.
 Improved reporting experience with new Job Queue Updates
At Holistics, we used a Job Queue System to manage reporting requests.
A reporting action (e.g: view dashboard, schedule email, or explore dataset) creates a job, which is then slotted into a corresponding queue, and picked up by a worker to process. (Learn more here)
We’re rolling out new updates to the job queue system next month, including:
- New Job Queue: We split the “
Adhoc Query” and “Explore Dataset” Jobs into a new queue calledAdhoc Query. The new queue will have dedicated Job Workers that won’t be contested by other Jobs in theDefaultqueue. The newAdhoc Queryqueue will have the same number of workers as yourDefaultqueue. - More Job Workers: We increase the number of your Report Job Workers by 5. That is, if you currently have 10 Report Job Workers, you are going to have 15. To learn about the default number of Job Workers per queue, please refer to our doc here.
We value your feedback, so please don’t hesitate to share your thoughts and suggestions with us here. ![]()
 New to Holistics? Join our regular training sessions (free)
If someone just invited you to Holistics, we offer regular live training sessions to help you put Holistics to the best use. Each training session is 60-min long, and there are various time slots to accommodate different time zones. And oh it’s completely free of charge.
Interested? Find a slot.
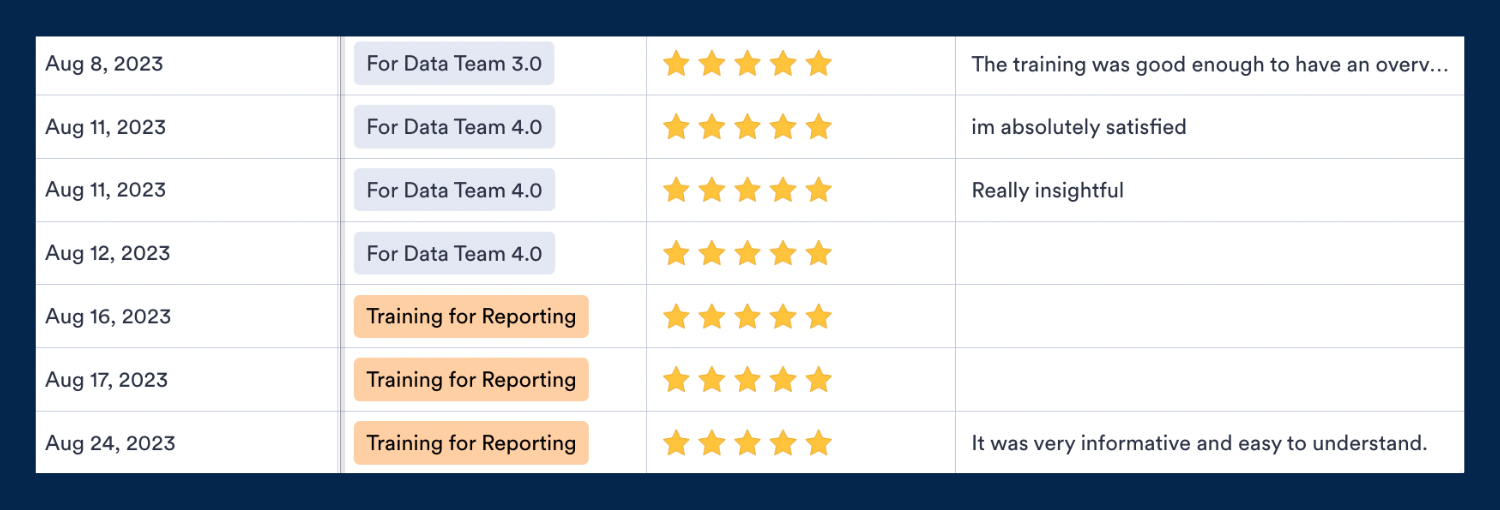
P/S: Not intrigued? Here’s what the audience has been saying! ![]()
 September UX updates
Like always, we jazz things up with a bunch of new UX improvements to make your day-to-day work with Holistics even more delightful. Here are some UX updates highlights:
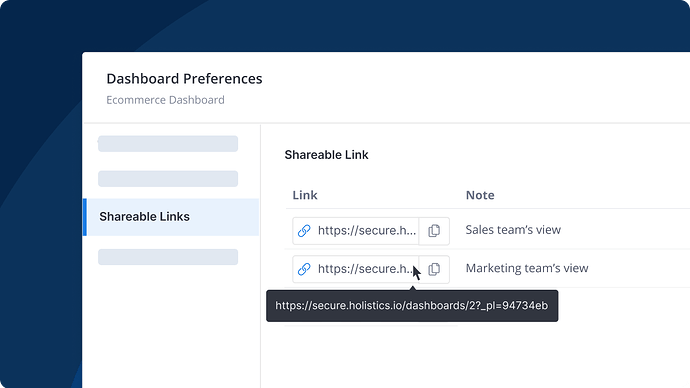
 Truncated shareable link: In Dashboard preferences, long shareable links are truncated and there needed to be a way to see them in full. A tooltip is now added when hovering on them.
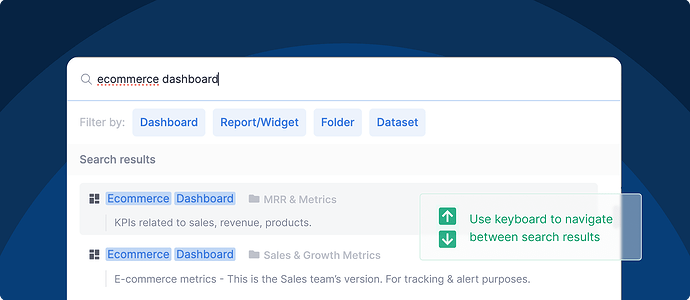
 Better search experience: You can now use your keyboard to move up & down and select between search results.
Check out the full Update here: 🥧 2023 October UX roundup
 Tips and tricks: Modeling unstructured data from MongoDB using dlt and Holistics
If you’re a CTO, then you probably love MongoDB: it’s scalable, production-ready, and a great dump for unstructured, and semi-structured data.
However, if you’re a data scientist or data analyst and you need to run analytics on top of MongoDB data dumps, then you’re probably not a fan. The whole process of transforming and storing the data from MongoDB to make it ready for analysis is effortful and tedious.
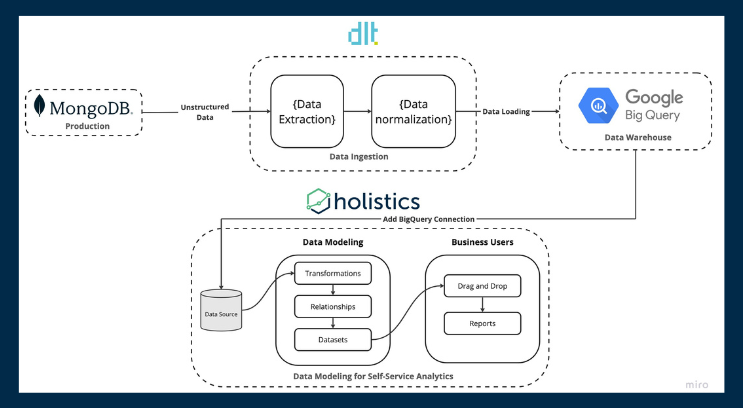
That’s why we teamed up with dlt to make this tutorial. We’ll show you how to transform and ingest unstructured production data from MongoDB to flat tables in BigQuery using dlt. You can read the full blog post here.
A Meme A Day Keep Troubles Away
When people ask me how I’m doing:
That’s all for this month. If you’re curious about our upcoming direction, check out our Product Roadmap.
I’ll see you real soon. Godspeed!
