Monday, October 21, 2024
It’s that time of the year when ghosts haunt, goblins creep and skeletons rattle - but to us, they aren’t nearly as scary as messy analytics workflows and clunky dashboards!
While haunted houses may give you the chills, managing your dashboards shouldn’t. So, our Product team cooked up some spooktacular updates this month to help you avoid the real horrors—like confusing workflows or sluggish dashboards. ![]()
Here are the latest treats from Holistics (no tricks, we promise)!
 Dynamic Data Sources (coming soon)
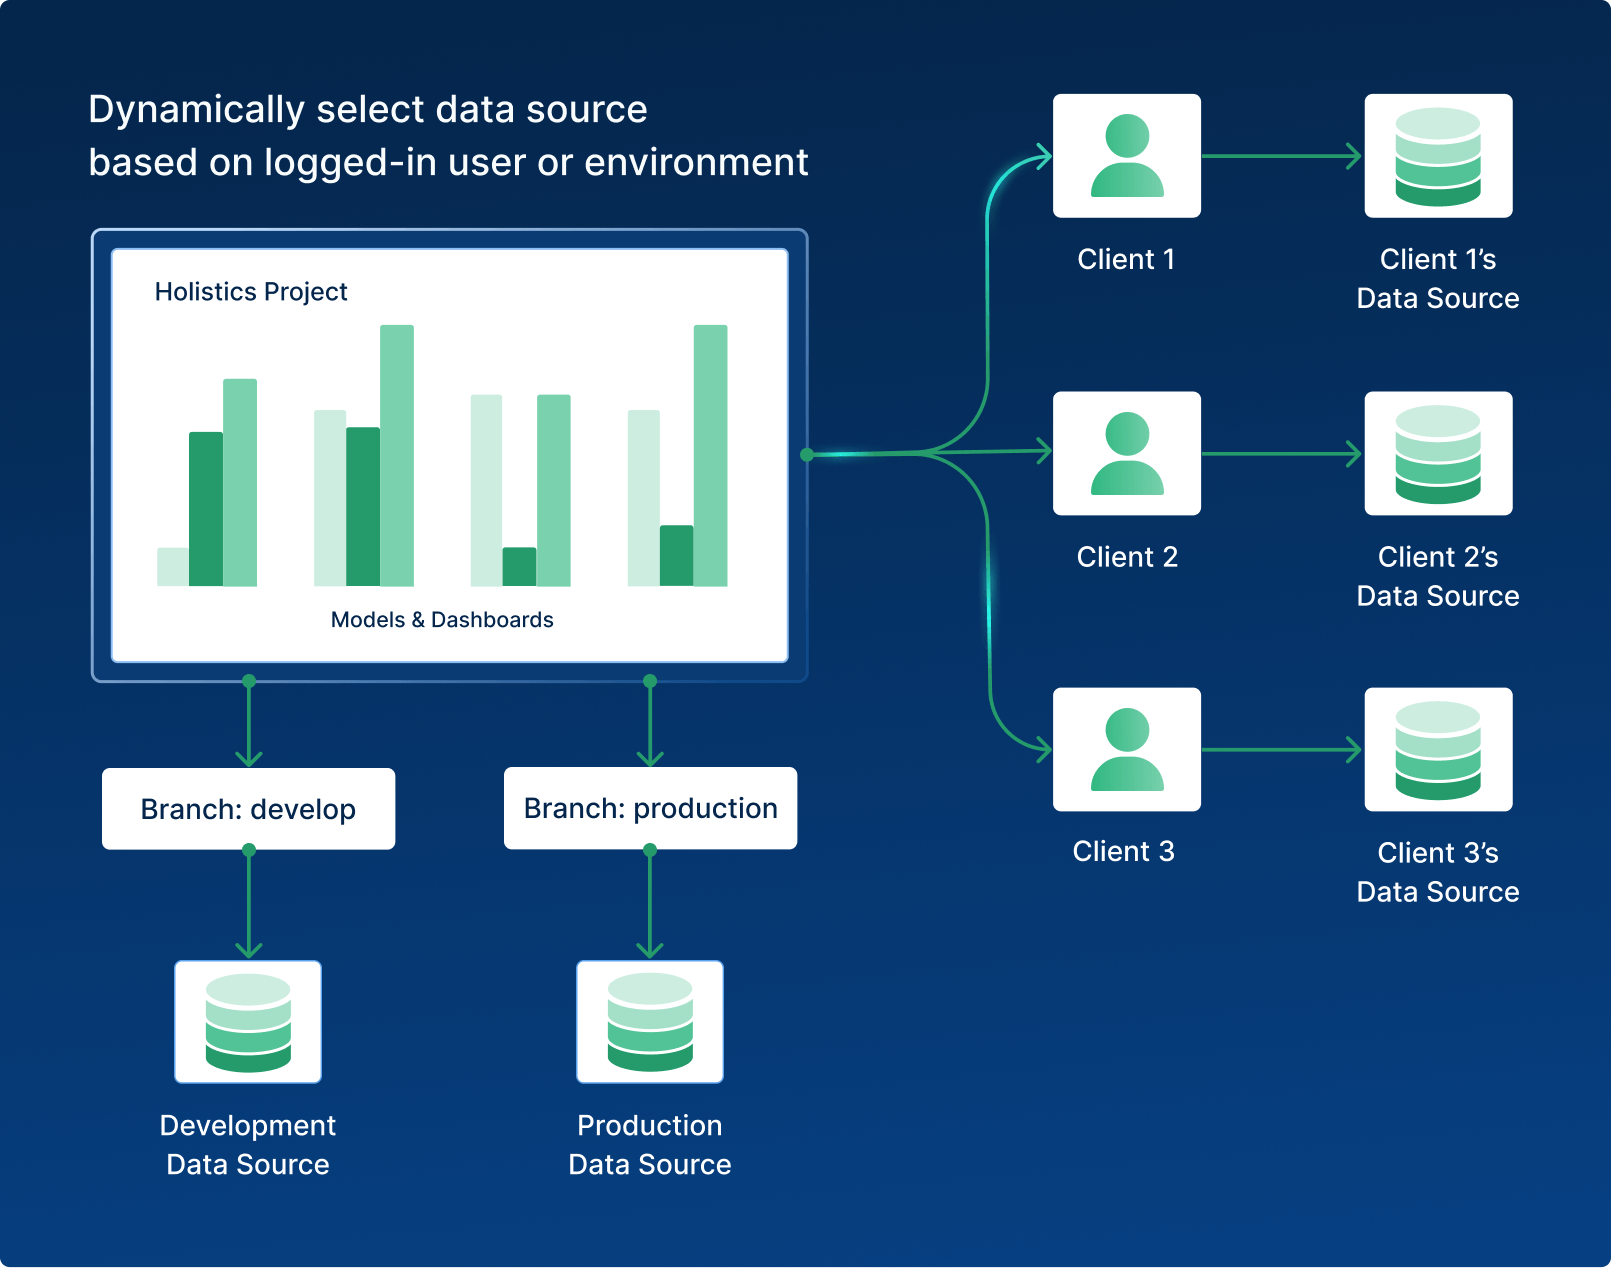
Our product team has been hard at work on Dynamic Data Sources. This upcoming feature allows you to automatically switch data sources based on who’s viewing your report or whether you’re in dev or production mode.
With Dynamic Data Sources, you can:
- Use the same models, datasets, and dashboards for different clients, each with unique data sources—no need to rebuild for each client.
- Easily switch between development and production data sources depending on where you’re working—no more constant manual updates!
For more information, check out our community post here. And if you have any feedback for us, we’re all ears.
 Control the number of frozen columns in Pivot Tables
You can now control how many columns to freeze in your Pivot Tables. By freezing only the most important columns, you can navigate your Pivot Table more easily and focus on what matters most.
For more information, check out our public doc here.
 Hide columns in Tables
You can now temporarily hide columns that aren’t relevant to your task, giving you a cleaner, more focused view of your data.
Even better, you can still sort your tables by these hidden fields, keeping your data organized without cluttering your view.
For more information, check out our community post here: Launched: Hiding columns in Table Visualization ![]()
 Line Interpolation - Step Before, and Step After
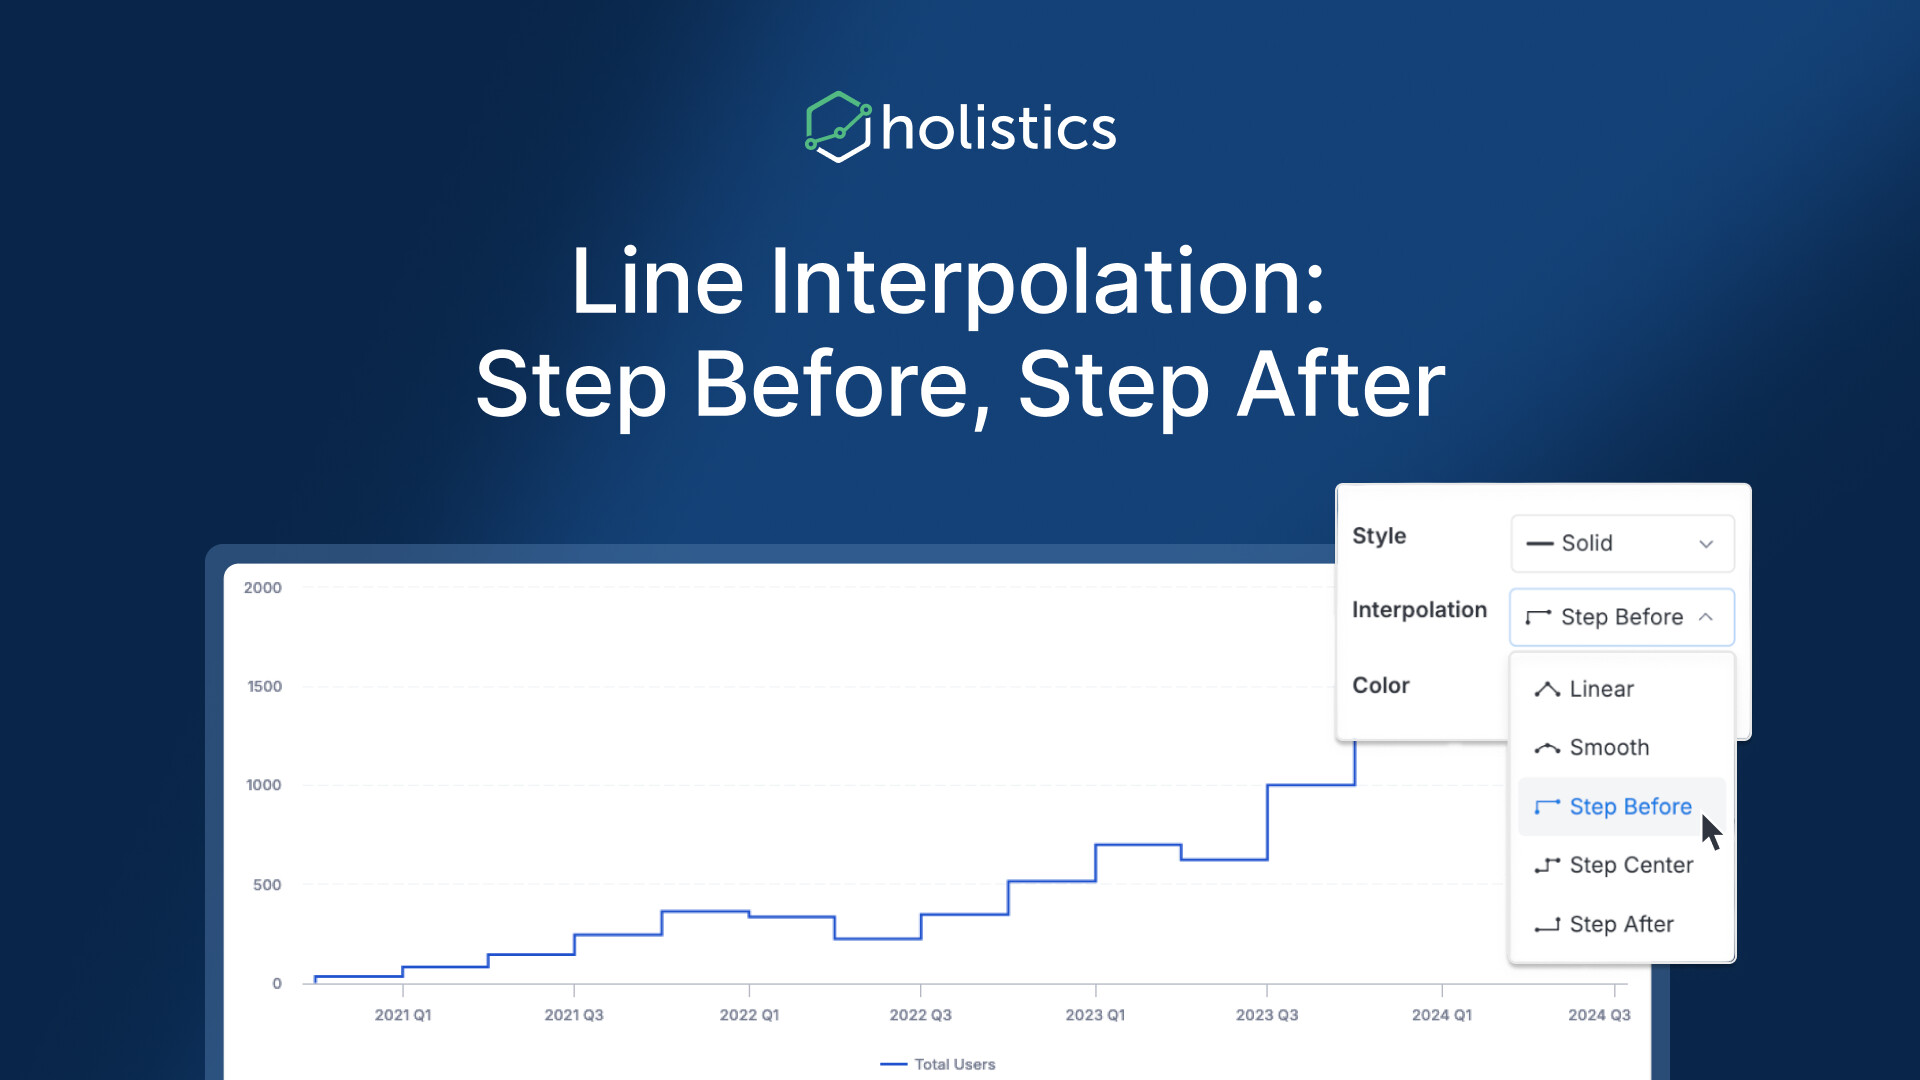
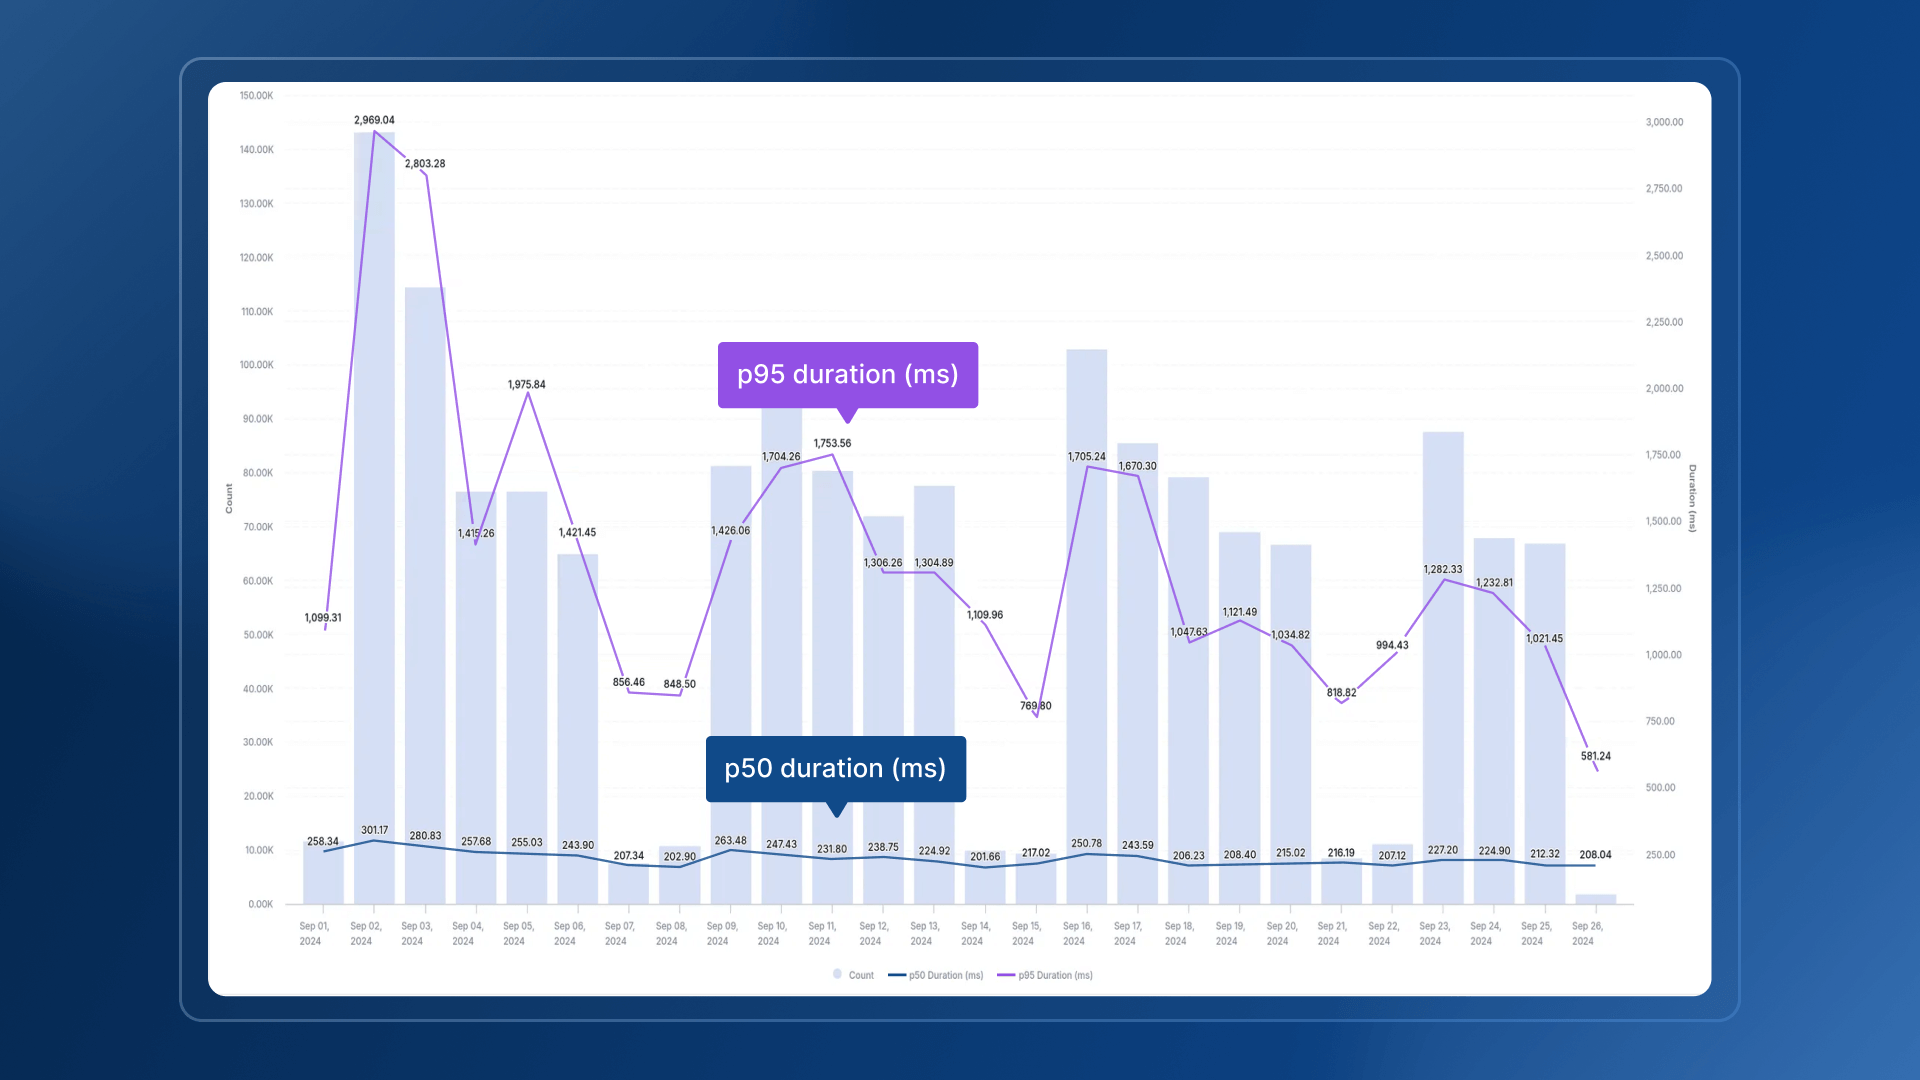
Another quality-of-life improvement in Holistics—more data presentation options for Line Interpolation. Now, you can customize how your line charts display changes between data points for better clarity.
A good chart is a chart with great visual clarity, and this little feature helps analysts get one step closer to that.
 Copy formatted and raw values in Tables
Copying table values just got a lot easier. You can now right-click on any cell or range to quickly copy and paste values.
Plus, you have the option to choose between formatted (WYSIWYG) or raw values, giving you more control over your data. ![]()
Visit our public doc for more details: Data Table Holistics Docs (4.0)
 Auto Publish with Publish API
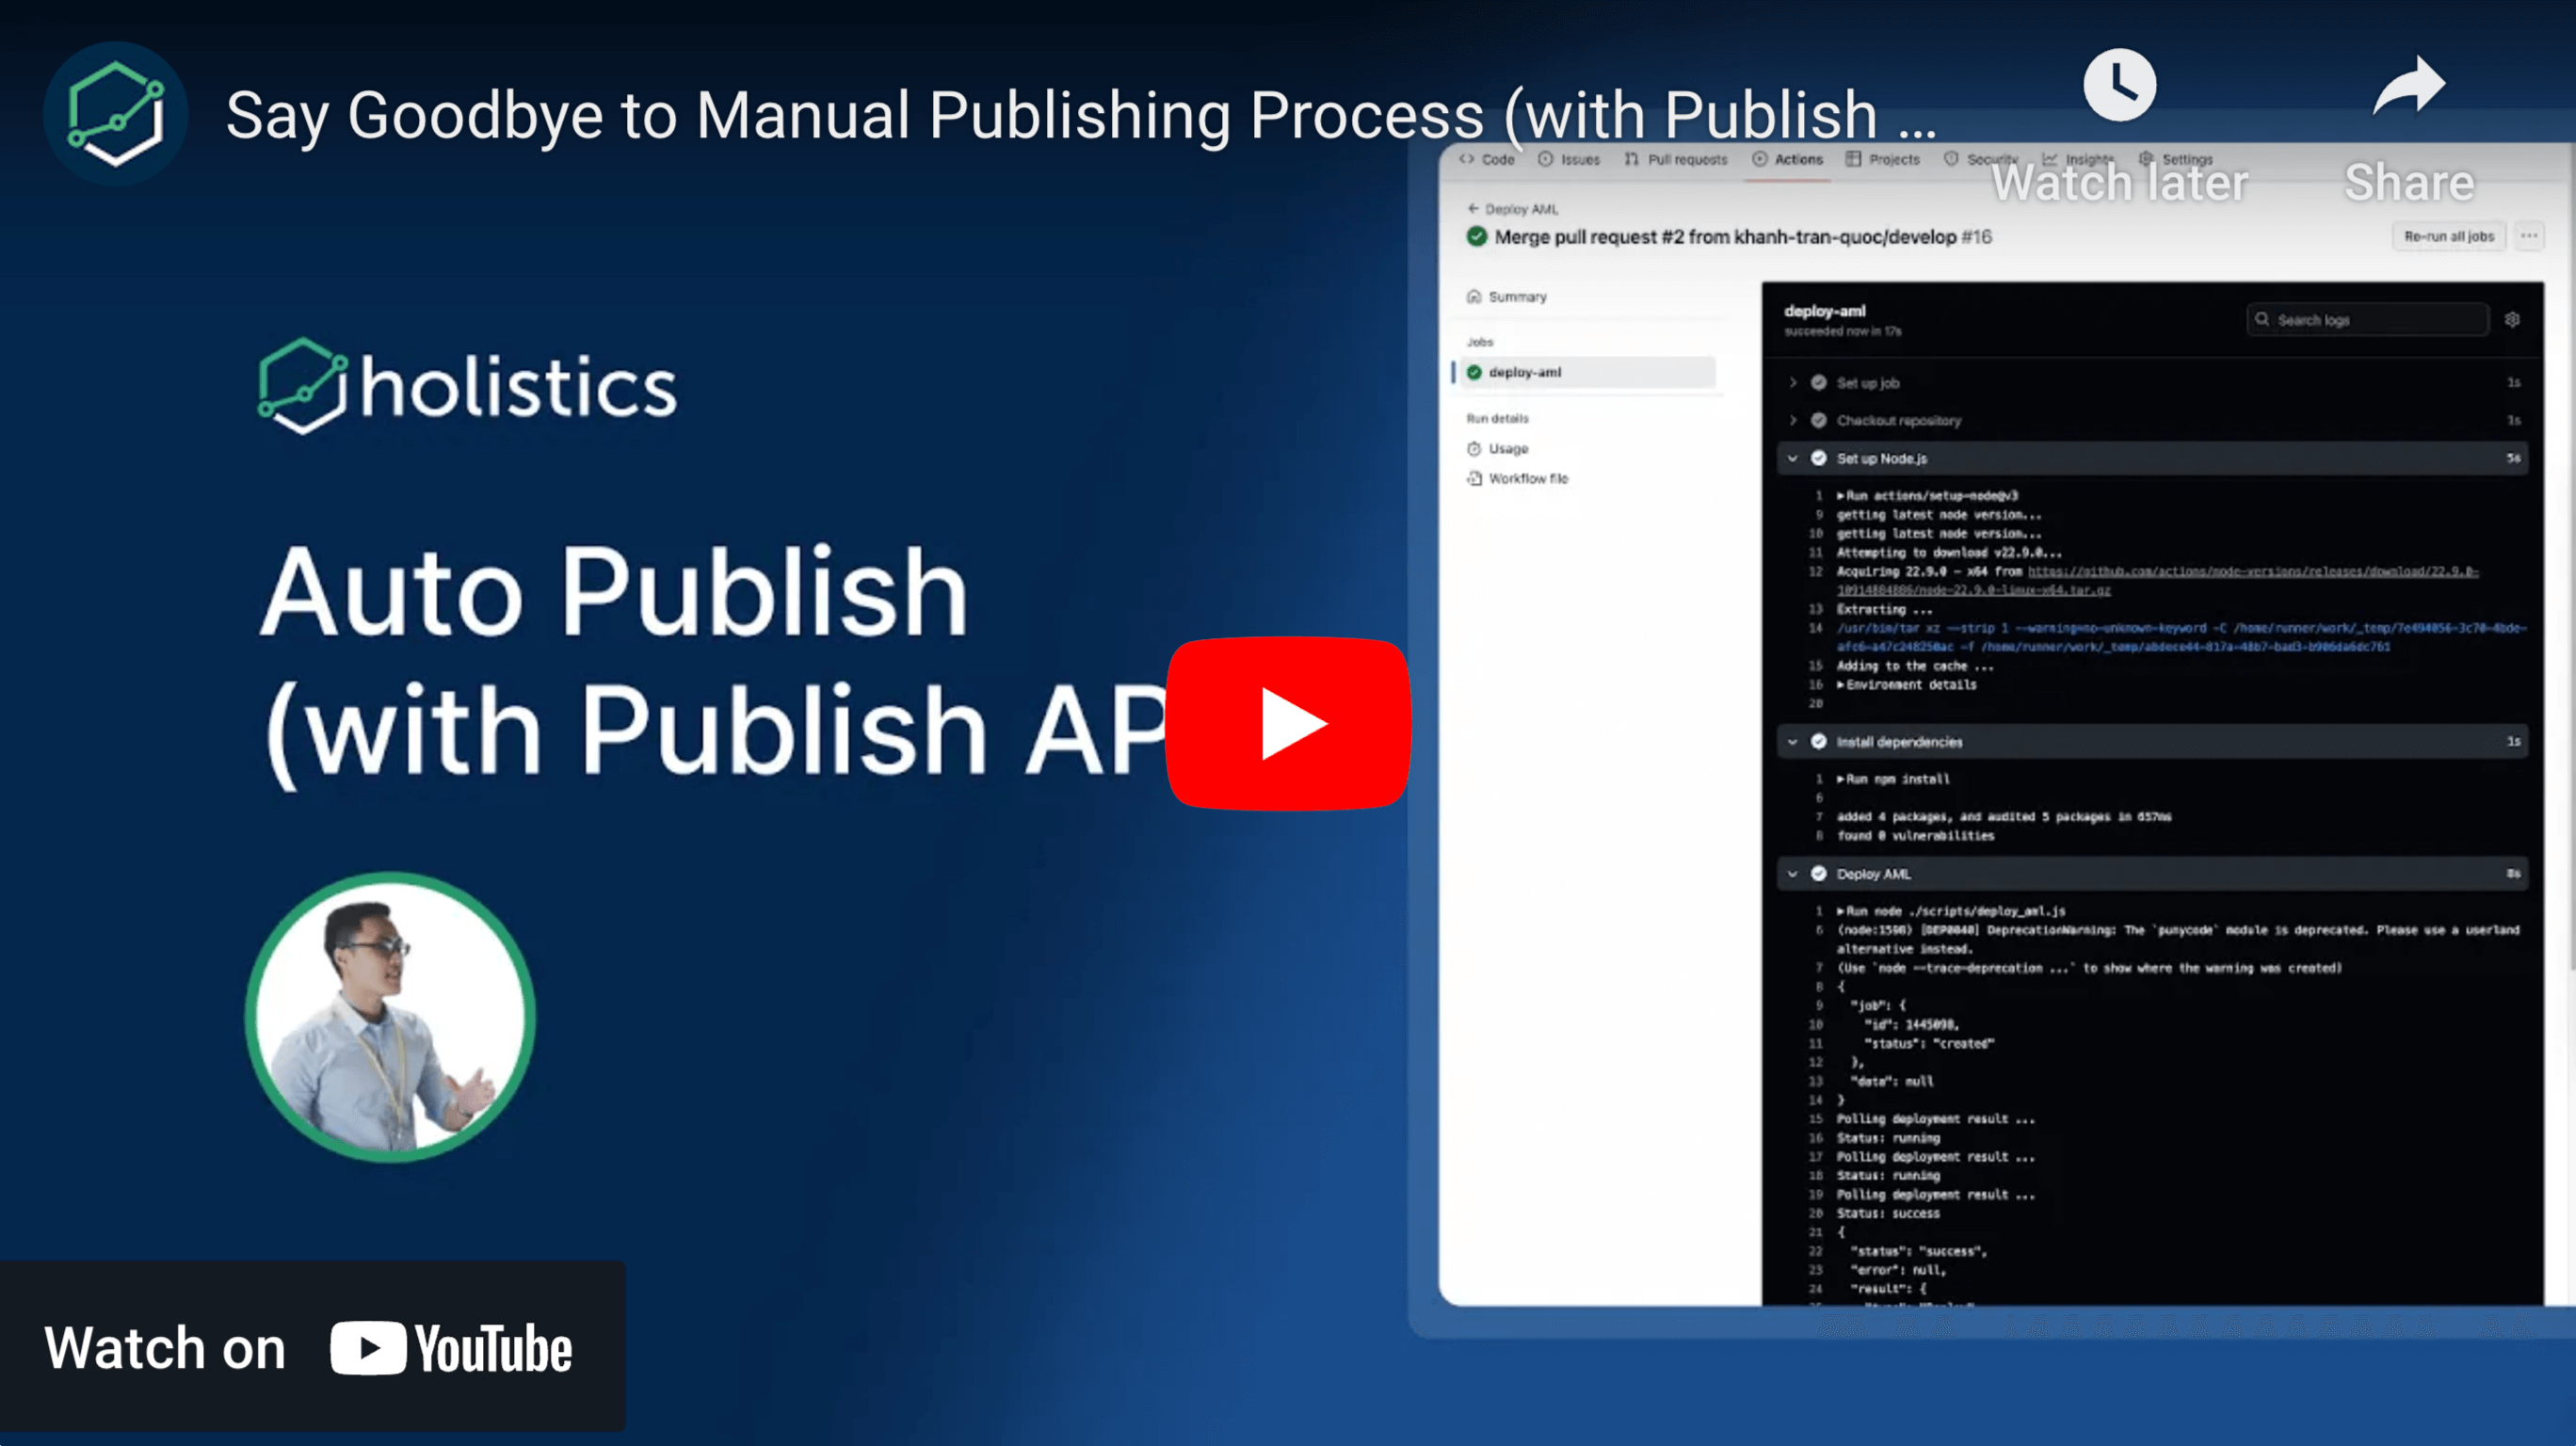
The Publish API lets you publish your projects externally from Holistics, tightly integrating with your CI/CD workflows. With this feature, you can:
- Publish the latest update after merging a PR into the
masterbranch by integrating the Publish API with your CI/CD pipeline. - Publish the latest updates automatically whenever new changes are pushed to the
masterbranch.
Check out a quick demo here.
For more information, check out our doc here.
 Switching branches via URL
Previously, when someone shared a URL to an object in their working branch, you often couldn’t access it. The URL kept you in your branch instead of theirs.
Now, with the new branch parameter in the URL, you can easily navigate to the exact branch and location of the AML object.
 Faster dashboards, better performance
This month, we’ve rolled out several performance optimizations. First, we reduced the loading time for Canvas Dashboards by 1-6 seconds, especially for dashboards with many blocks.
We’ve also optimized SQL processing for Datasets, especially those with many models/fields, reducing loading time by 0.1-3 seconds for Datasets and Reports.
 Excited about the new features? Join our Free Training
If you’re thinking, “Wow, that’s a lot to take in—how do I make the most of these updates?” don’t worry, we’ve got you. ![]()
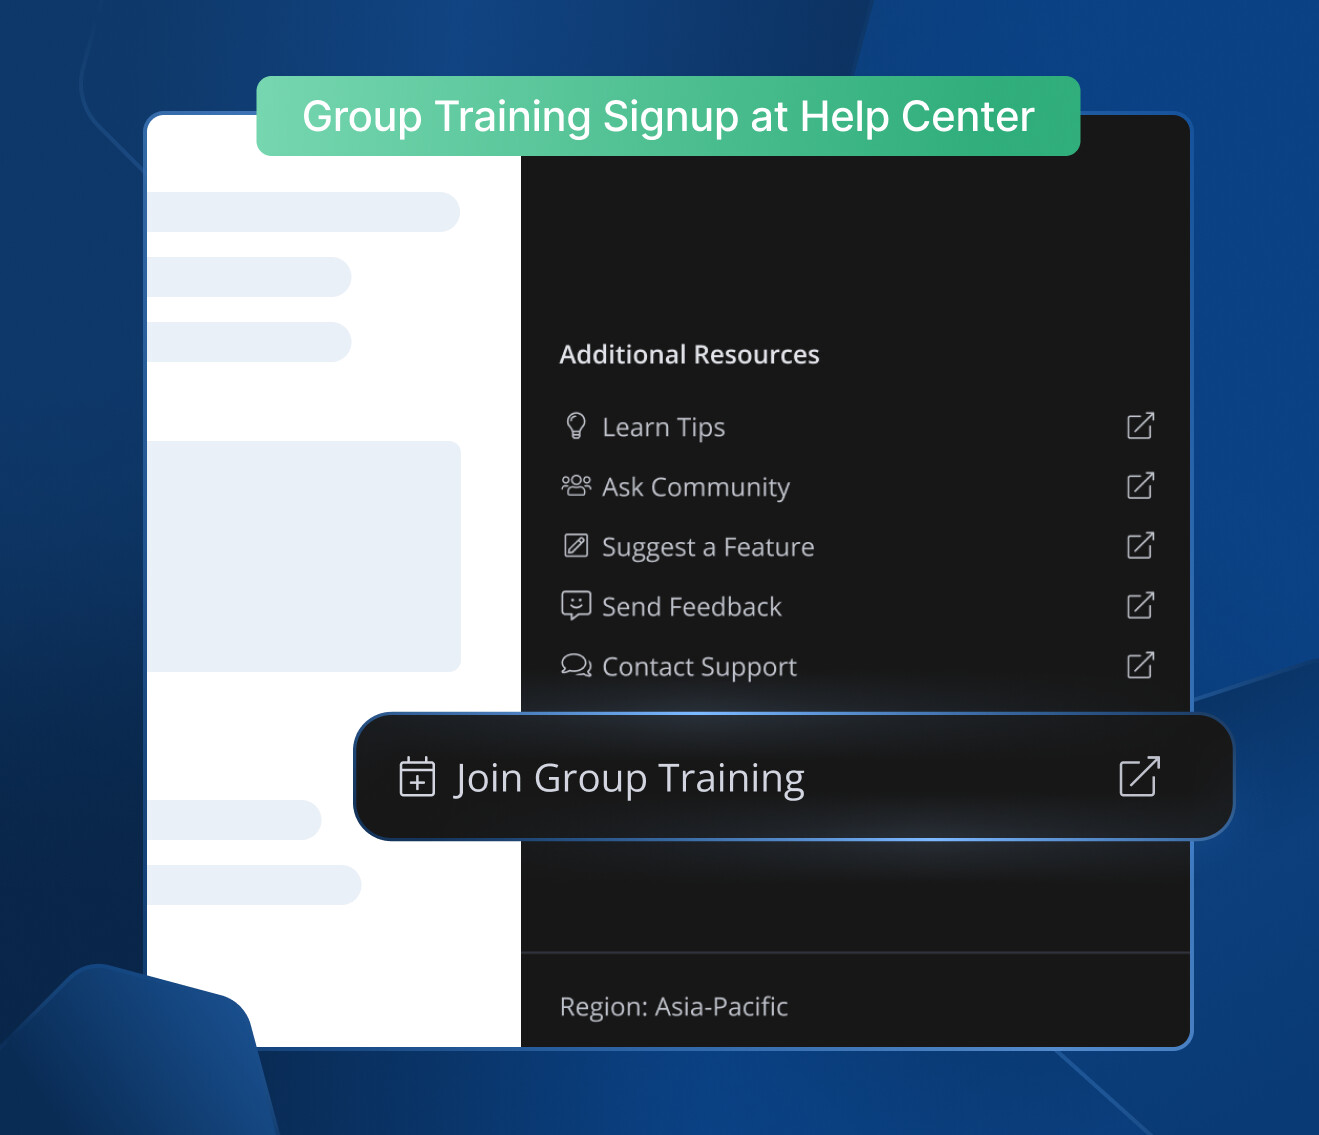
We offer 60-minute live training sessions designed to help you get the best out of Holistics. With multiple time slots available, there’s a session that fits your schedule, no matter your time zone. And it’s completely free of charge.
Interested? Find a slot here, or sign up for Group Training through this handy button in the Help Center.
Not intrigued? Here’s what the audience has been saying! ![]()

 October UX Updates
Our Product Design team has been unstoppable! They dropped 20+ updates in September and 30+ in October—either they’ve found some magical potion, or they’ve enlisted a few Lovecraftian deities for assistance. ![]() Whatever the secret, I’m pretty sure no one’s complaining!
Whatever the secret, I’m pretty sure no one’s complaining!
Here’s a quick look at the highlights from our latest UX update:
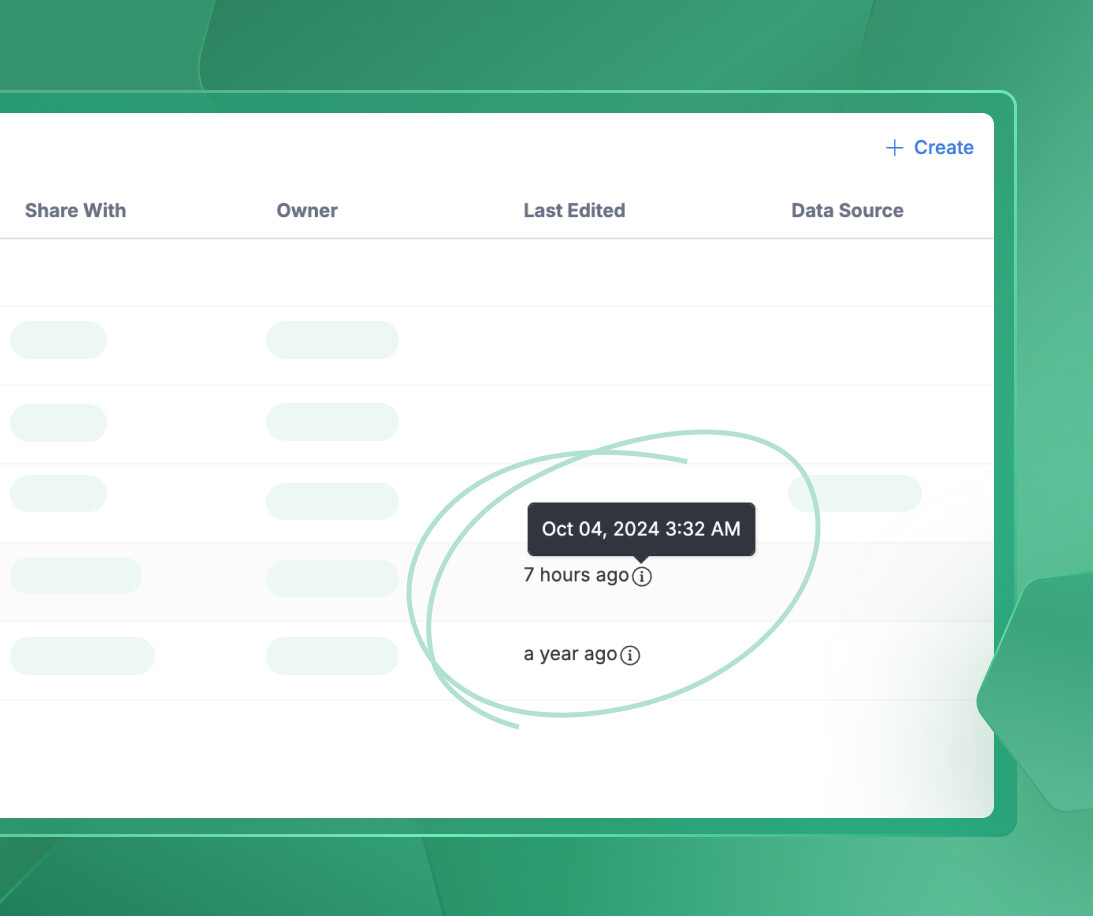
- We’ve added exact timestamps to Folder View for your Dashboards. Now, you can easily identify the last updated time and find the information you need quickly✨.
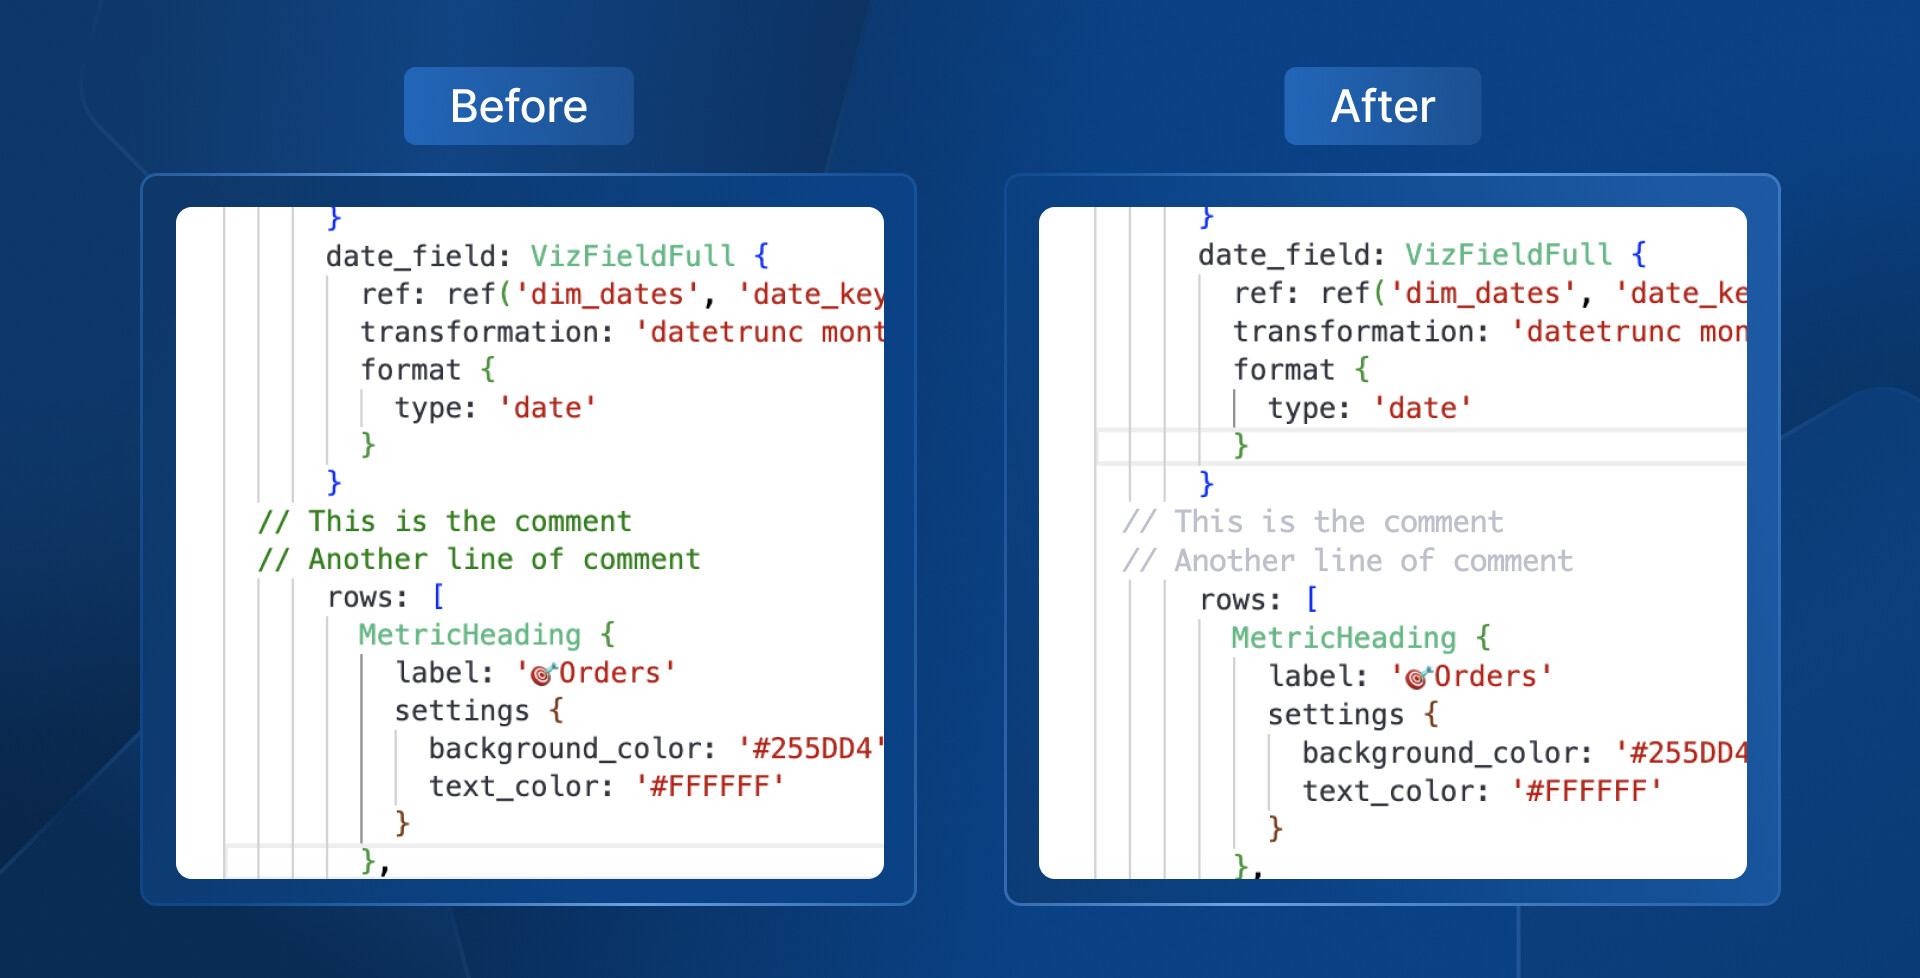
- In the code editor, we changed the comment color from green to light gray for easier code skimming.
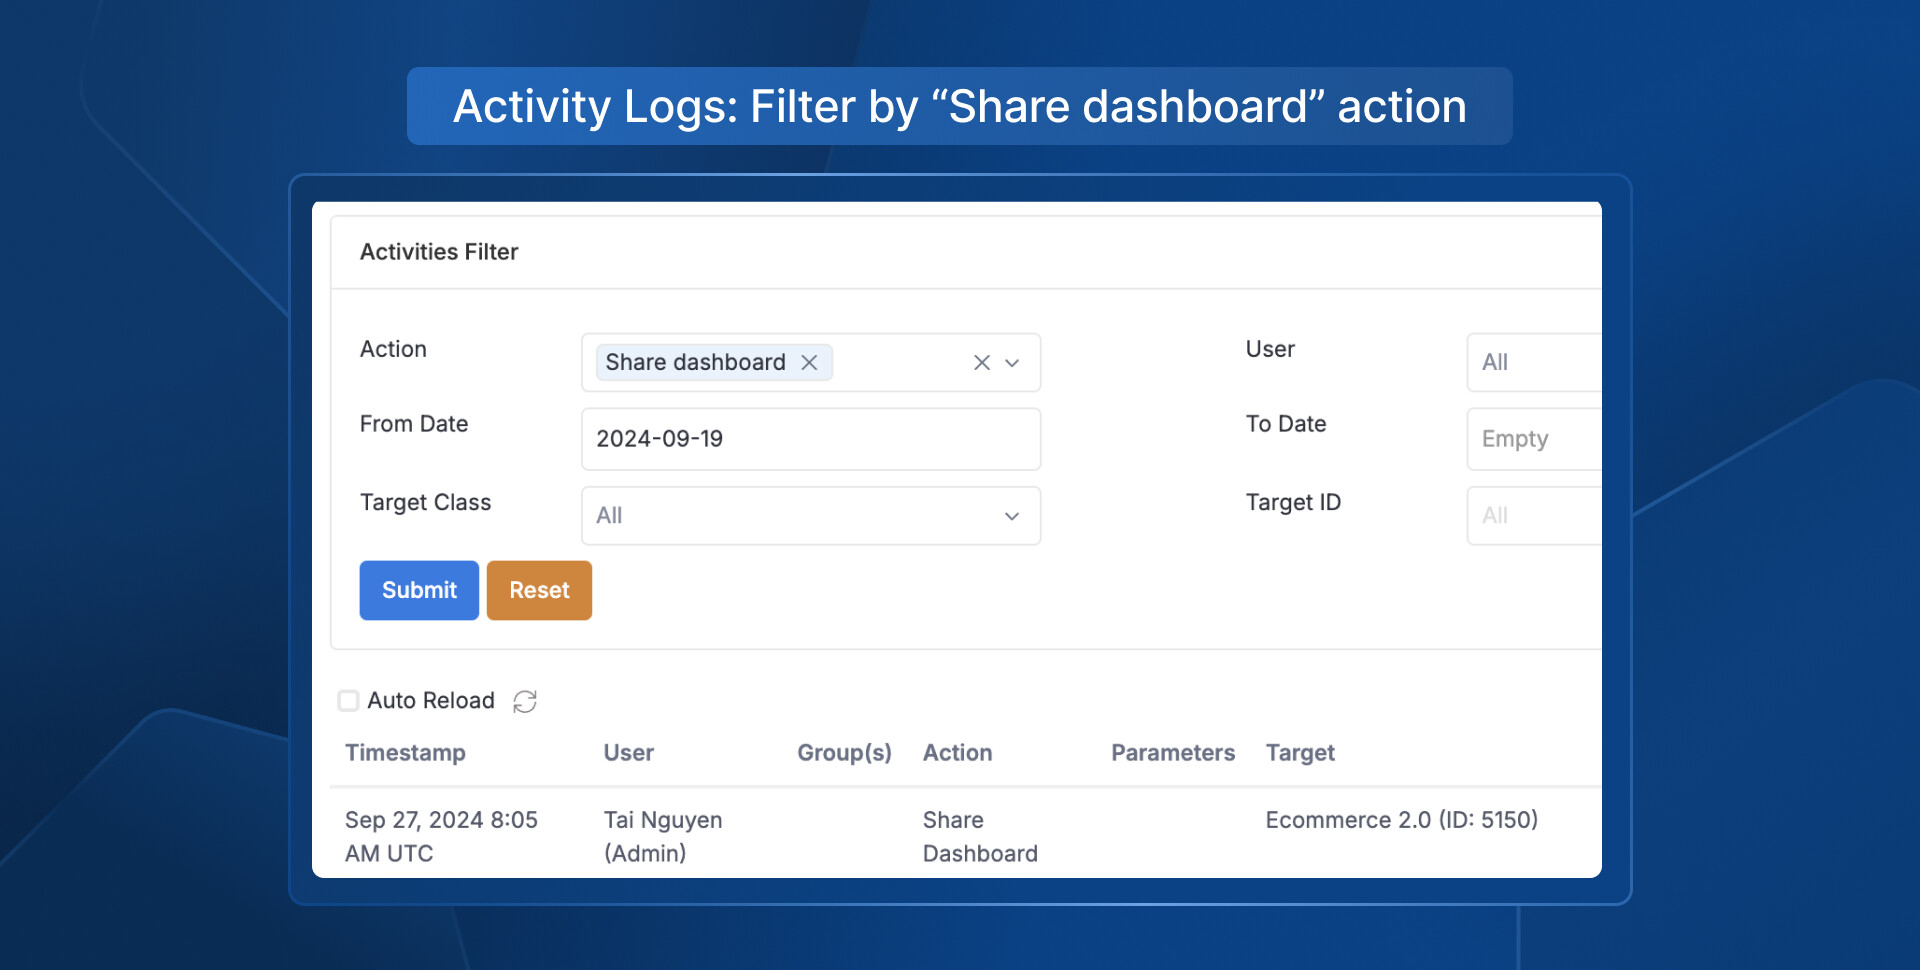
- Activity Log action filtering – you can now filter the “Share dashboard” action in the Activity Logs.
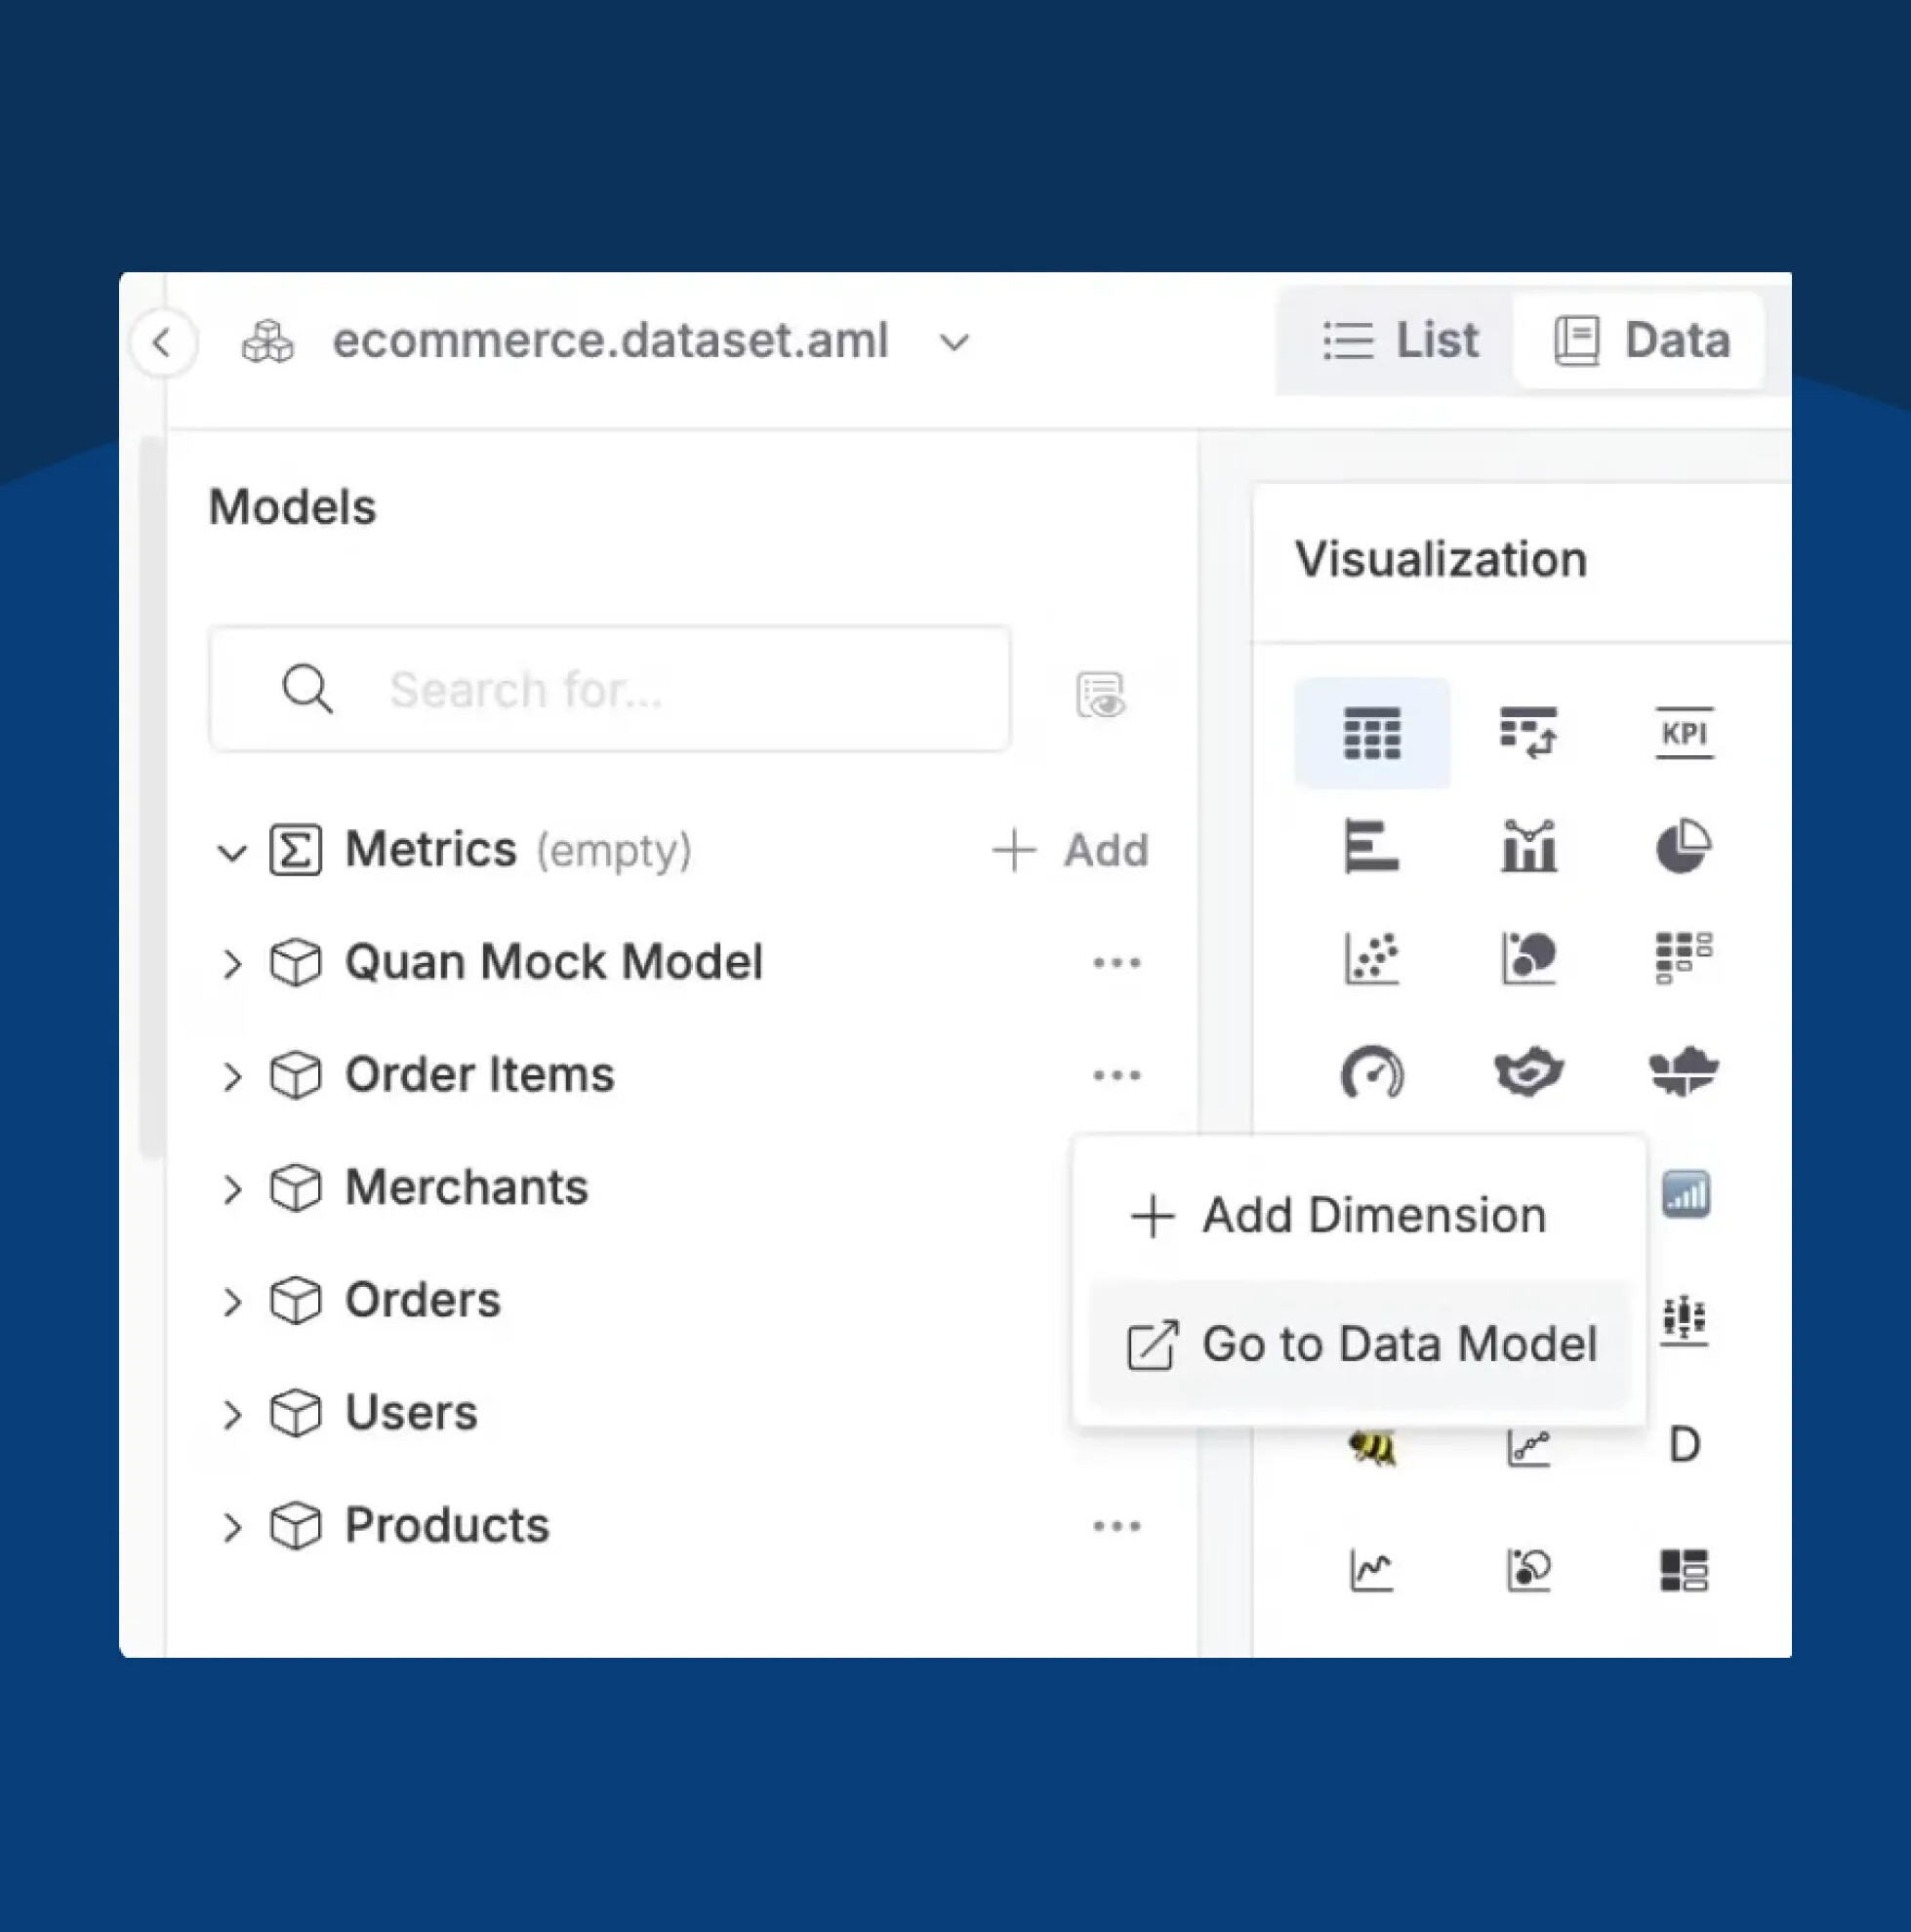
- A “Go to Data Model” button has been added to the Dataset Data view for quicker navigation.
For more details, check out our community post here.
Final words
That’s all for this month. If you’re curious about our upcoming direction, check out our Product Roadmap. If you’re interested in what we just released in the past few months, check out our Release Note.
Do you have any feedback for us? If you do, hit Reply and let me know.
I’ll see you again real soon!