Monday, June 17, 2024
There are two common feedback loops that most data teams are familiar with:
- Stakeholders want a dashboard. Data teams build it. Stakeholders request changes. Repeat until the data team is frustrated with the request queue and nothing gets done.
- Stakeholders want a dashboard. Data team shows how to build it. Stakeholders build it. Verify with data team. Improve understanding. Take action. Build a better dashboard. Repeat until knowledge is accessible to everyone.
At Holistics, we’re all about the latter. Our latest updates continue to make this feedback loop quicker and more delightful. Analytics functions are easier to calculate, dashboards are more accessible, and data exploration is much smoother.
 Reference Line
You make a chart. Congrats, but you’re not done yet. You don’t simply get insights by eye-squinting and going off on vibes. The line is wiggling, but are you doing better, or are you doing worse?
This is where the Reference Line comes in.
In just 03 clicks, you can now add a Reference line, and compare your data against a specific value (i.e.: the sales target), or a dynamic value (i.e.: average sales across all products).
 Pre-filter dashboards by editing URL parameters
Now you can add filters to your dashboard, without even needing to open it.
Just by editing the URL query string of your dashboard or widget, you can add interactive controls like filters, PoP, and Date Drills. When you load your dashboard, it’ll already be filtered how you want it.
For more details, check out our community post here: Passing Filter Parameters via URL Query String.
 Job monitoring is now available to analysts
As data usage increases, analysts often take on the responsibility of maintaining, debugging, and optimizing data resources. To support their efforts, we now make Job Monitoring also available to Analysts, not just Admins as before.
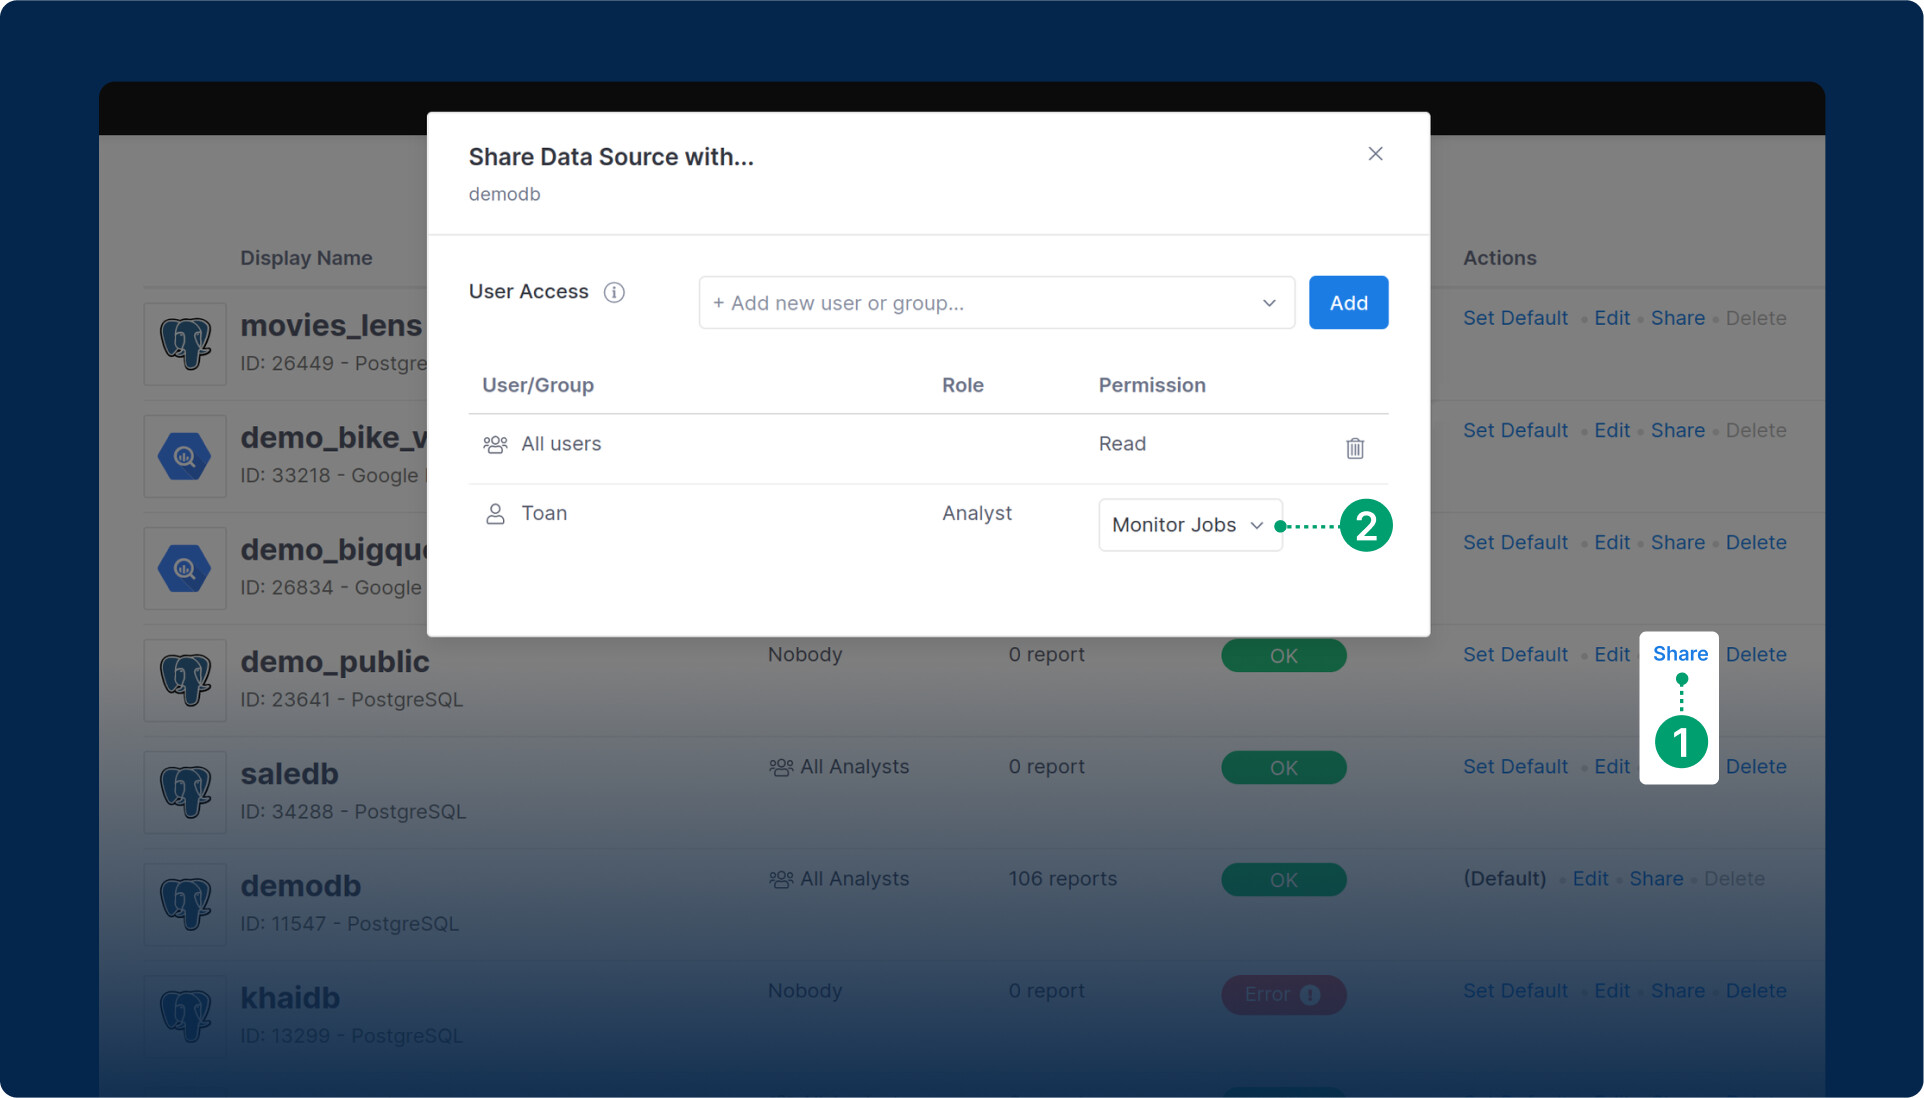
For more details about Job Monitoring, check out our docs, or our community post: Launched: “Monitor Jobs” permission for Analysts.
 Actions (coming soon)
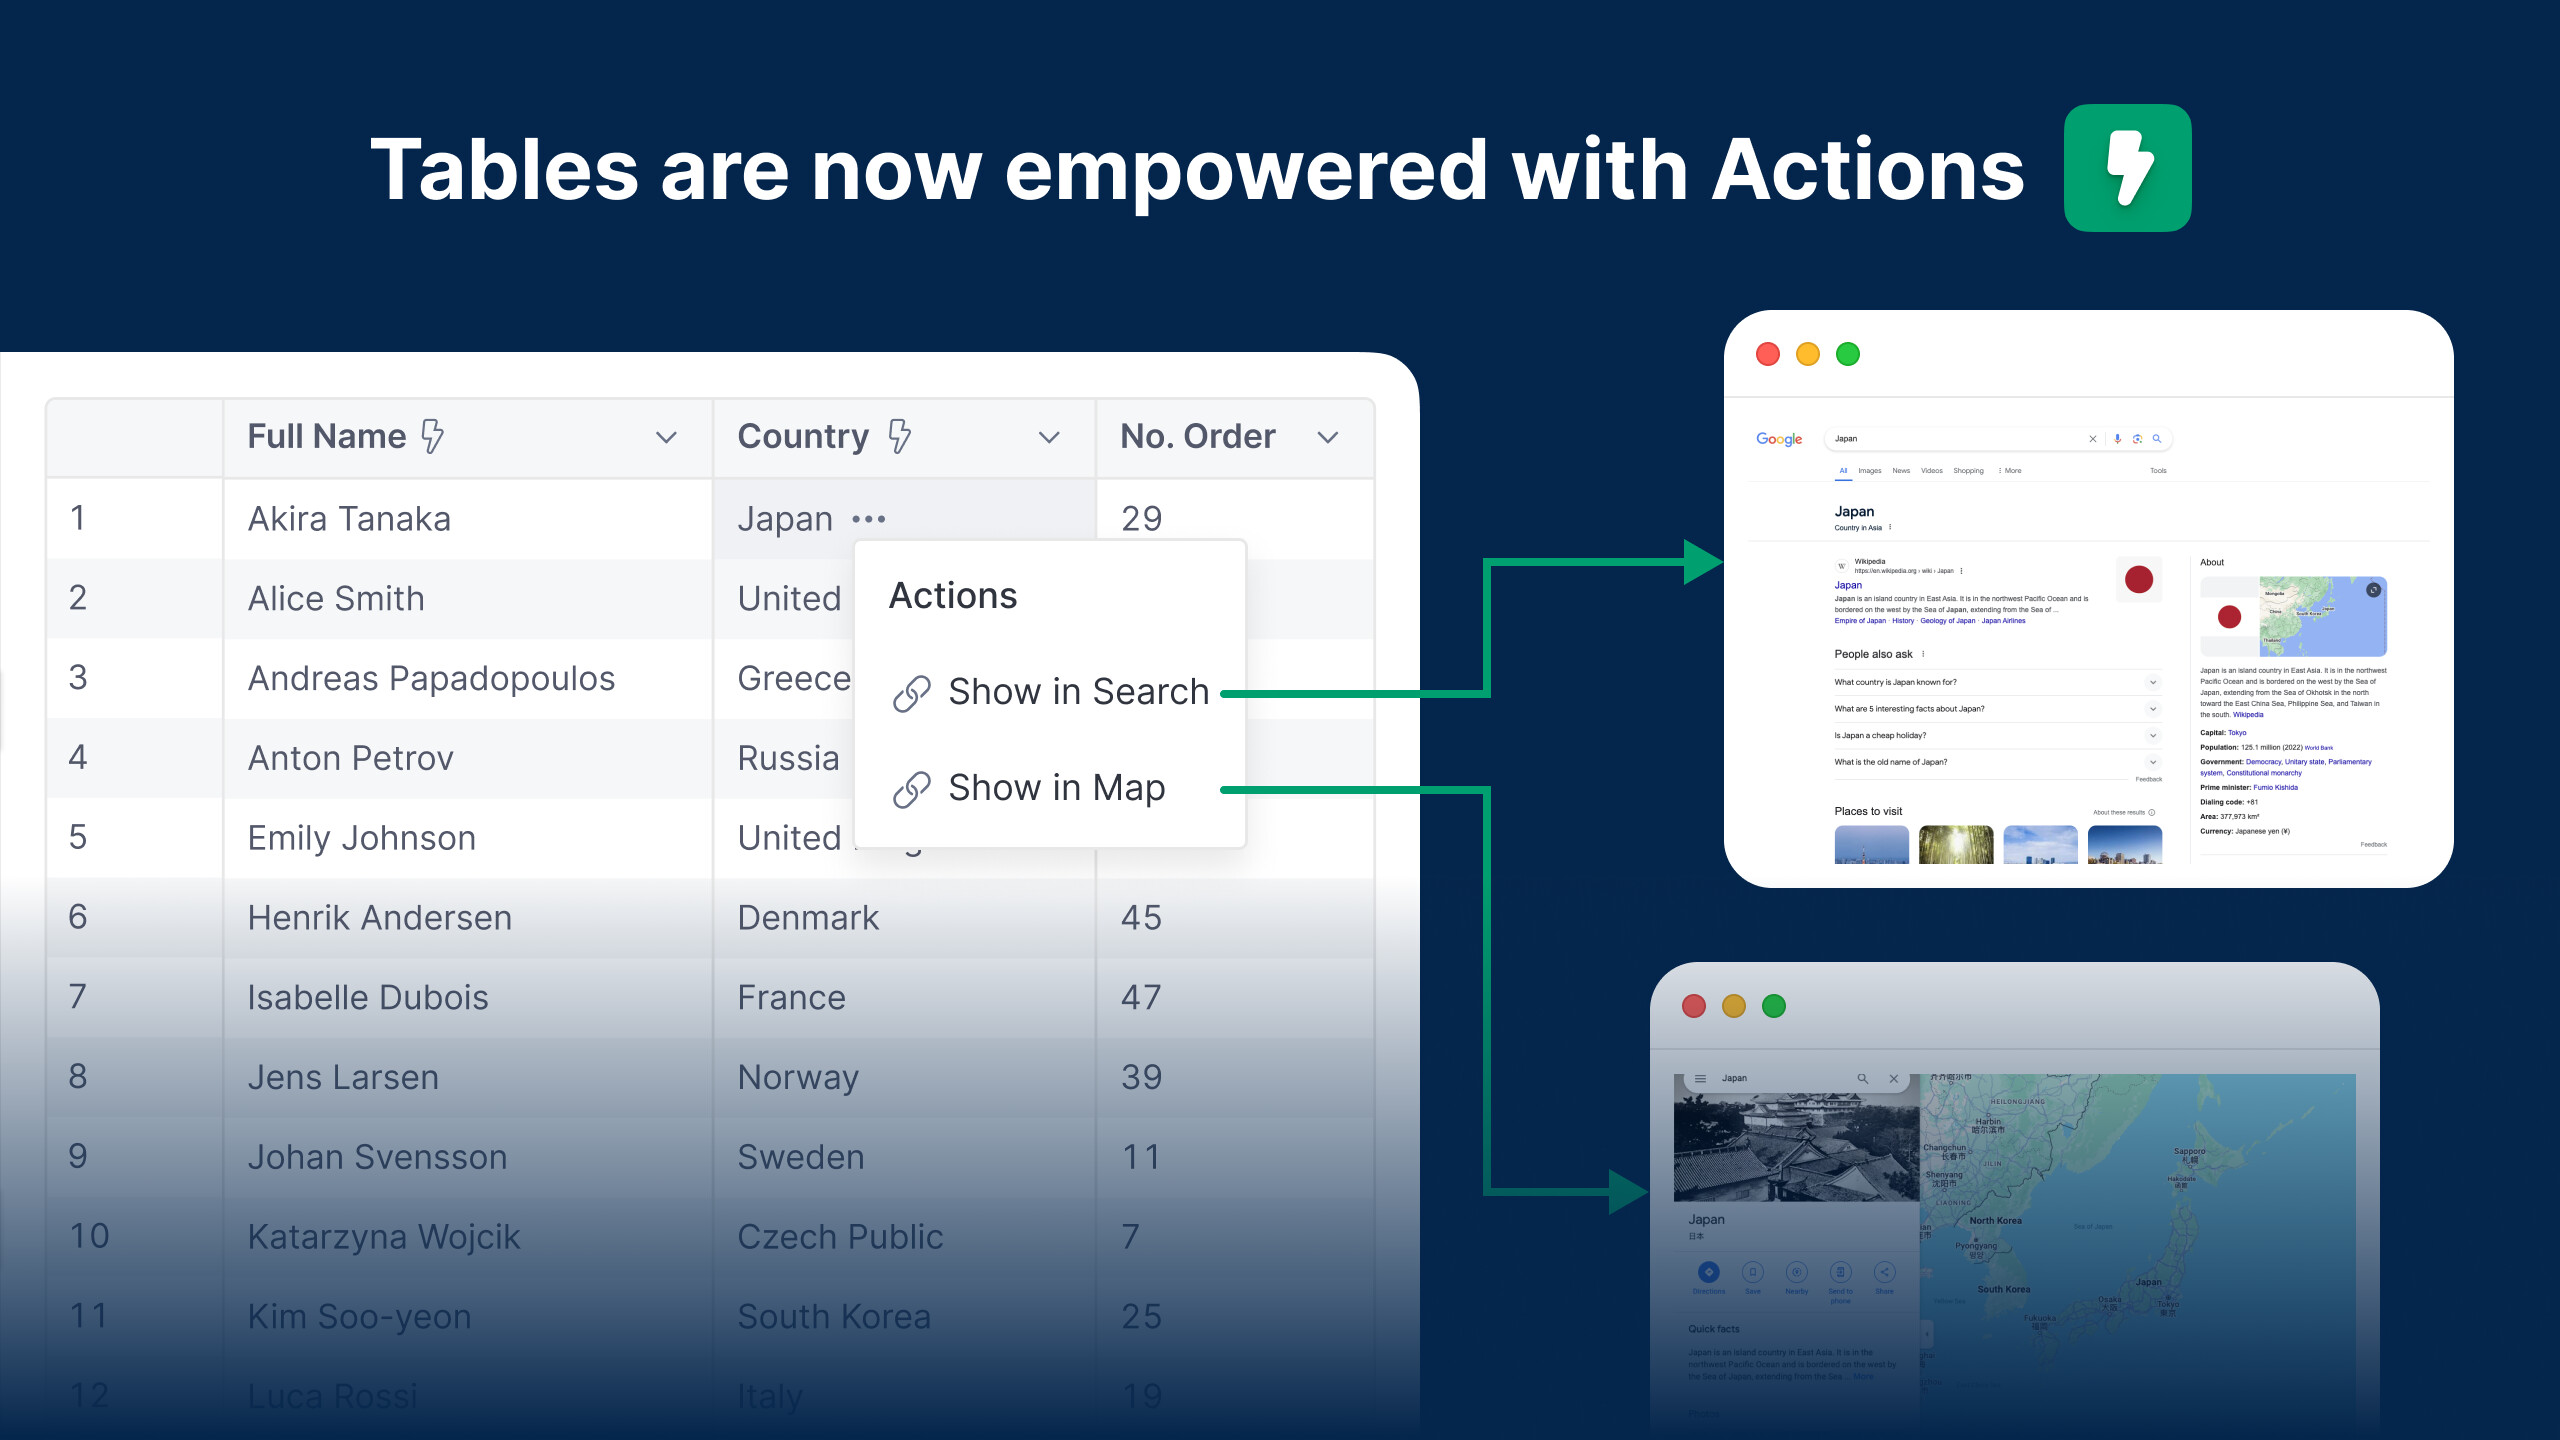
You don’t need a BI tool just for static report viewing—Excel and PowerPoint can handle that. BI tools are for gaining insights, taking action, and closing the loop.
For example:
- See a report showing product stock by vendor? You want to click on a vendor and send a re-stock email when stock is low.
- Checking a CRM dashboard? You want to open CRM details directly when detecting customer inactivity.
This is where Actions (or what we’d like to call it: the Swiss knife of data interactions) come in. This upcoming feature allows you to define specific actions in reports, enabling more dynamic interactions with your data and visualization.
The possibilities are abundant, and we’re excited to share it with you soon ![]() For more information, please refer to our Community Post here.
For more information, please refer to our Community Post here.
 Point-n-click to calculate Percent of Total (Coming soon)
With Holistics AQL (Analytics Query Language), calculating Percent of Total takes one single-line expression. It’s easy.
Yet, we understand writing code is not for everyone, so we make Percent of Total even easier to calculate: You just point and click.
 Aggregate awareness, a.k.a pre-aggregations (Coming soon)
When reporting from large datasets or tables, data teams often pre-aggregate data into smaller tables to improve query performance and reduce query costs.
With Aggregate Awareness, Holistics query engine can automatically identify eligible pre-aggregated tables and substitute those tables into queries. The queries process less data but still produce accurate results!
For more details, check out our community post.
 New to Holistics? Join our regular training sessions (free)
If someone just invited you to Holistics, we offer regular live training sessions to help you put Holistics to the best use. Each training session is 60 minutes long, and there are various time slots to accommodate different time zones. And oh it’s completely free of charge.
Interested? Find a slot.
P/S: Not intrigued? Here’s what the audience has been saying! ![]()

 June UX updates
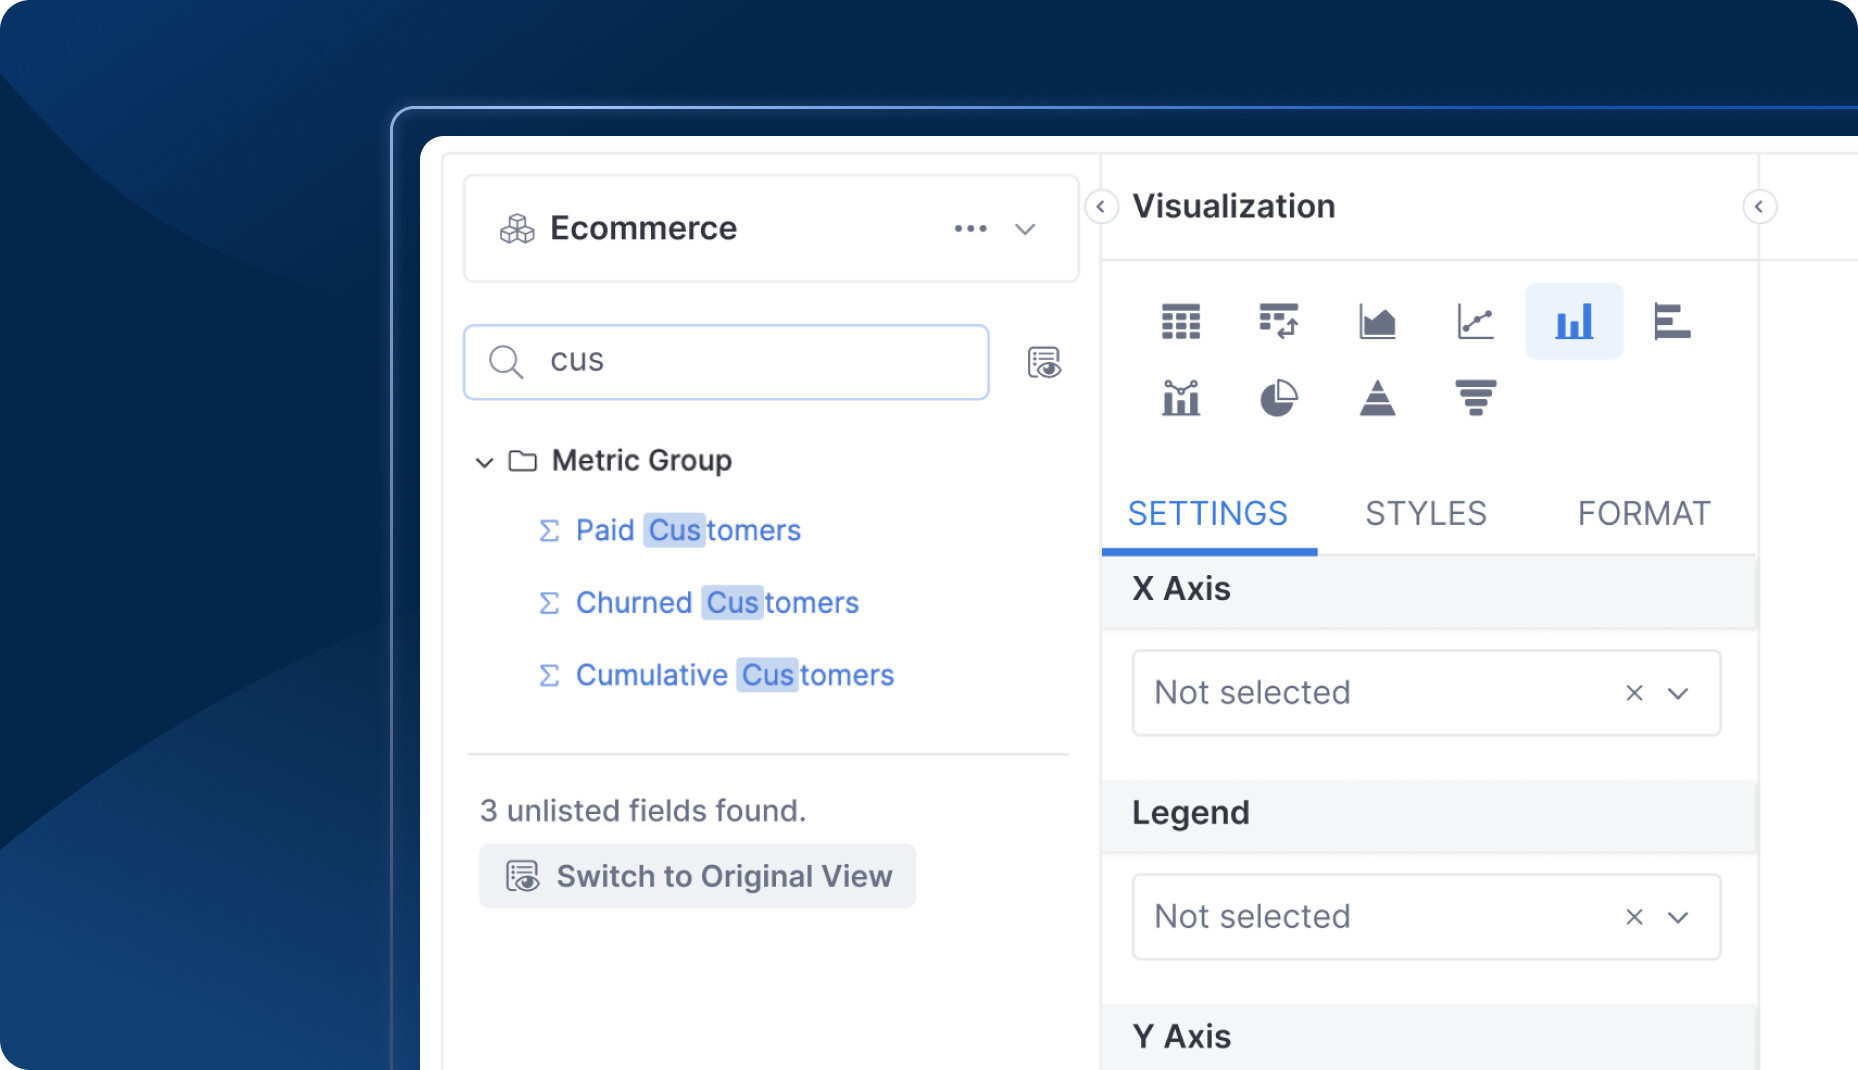
Like always, we jazz things up with a bunch of new UX improvements to make your day-to-day work with Holistics even more delightful. Here are some UX updates highlights:
We made it easier to find the right fields by providing more information about hidden ones in the Datase
When doing modeling, you’ll soon be able to discard all changes with a single click.
Check out our newest UX Update here: 2024 June UX roundup
Final words
That’s all for this month. If you’re curious about our upcoming direction, check out our Product Roadmap. If you’re interested in what we just released in the past few months, check out our Release Note.
Do you have any feedback for us? If you do, hit Reply and let me know. Or connect with me on LinkedIn and we can chat.
I’ll see you again real soon!