Tuesday, July 16, 2024
Hello hello friends of Holistics, how are you doing?
July is here, and with it, the sweltering heat and summer vibes. Can you believe we’re already halfway through the year? It feels like just yesterday we were making New Year’s resolutions. Maybe time flies when you’re swamped with shipping out awesome features. ![]()
That said, we didn’t forget our New Year’s resolution: To help everyone build dashboards that are fast, beautiful, and insightful. This month’s update is us still keeping with our resolutions, check it out!
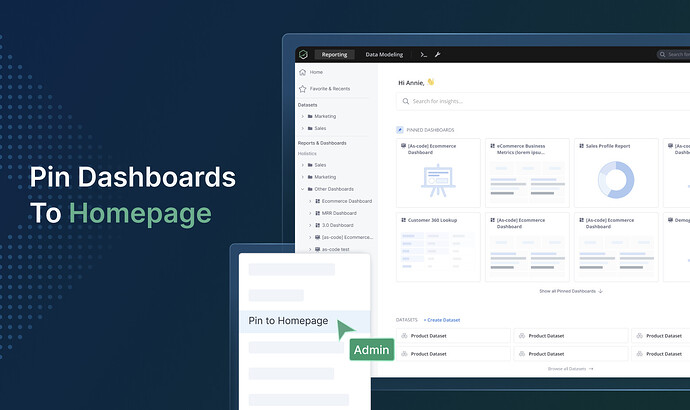
 Pinning important dashboards to the homepage
Now you can pin important dashboards to everyone’s homepage.
This is especially handy when your boss wants to rub it in everyone’s face that revenue is tanking, and everyone all needs to work ridiculously harder. Just rename your Revenue dashboard to ‘The Ship is Sinking’ and pin it to the homepage for maximum impact!
Jokes aside, we just think life is easier when you don’t have to plow through layers of menus or search endlessly to find the dashboards you need.
 Faster initial dashboard view
TL;DR: Your dashboards open faster now.
We’ve made another round of improvements to how fast dashboards open in Holistics. Now, from the moment you click a link until all the widgets pop up (minus the actual data, of course), everything moves quickly.
If you’re into the nitty-gritty details of the optimizations we’ve made, check out this community post.
 Job performance analytics for Canvas Dashboard
With Canvas Dashboard, you can build the most visually stunning dashboard in the world, but no one will know if every dashboard visit is a game of “spin the loading wheel”.
Dashboards should be both fast and beautiful, we get it, so we’ve brought Job Monitoring and Job Performance Analytics to Canvas Dashboards.
Now you can spot the slowest reports in your workspace, see which Canvas dashboards are dragging their feet, check if your Holistics Job Workers are overwhelmed, and make necessary optimizations to ensure your dashboards are fast enough to actually be admired.
If you have any questions, please let us know in this Community Post.
 Moving calculations (coming soon)
In Holistics, common analytical functions (period over period, percent total, etc) are all 1-click operations, without the headache of a complex setup. Keeping with this tradition, we’re making Moving Calculations just as easy.
Soon, you’ll be able to add a Moving Average trend line or calculate a cumulative Running Total in just a few clicks.
If you have any questions or suggestions for us, let us know in this community post
 Re-ordering table columns using drag and drop (coming soon)
Soon you’ll have the freedom to easily customize your table views with a simple drag and drop.
Want your columns in a different order, one that makes more sense to you? No problem! Just drag them around to your heart’s content.
 July UX updates
Like always, we jazz things up with a bunch of new UX improvements to make your day-to-day work with Holistics even more delightful.
Here are some UX updates highlights:
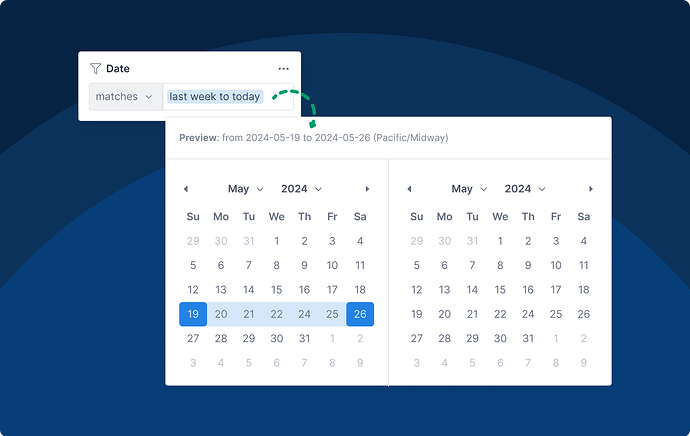
In Date Filter, the preview wasn’t displayed for default values. We fixed it!
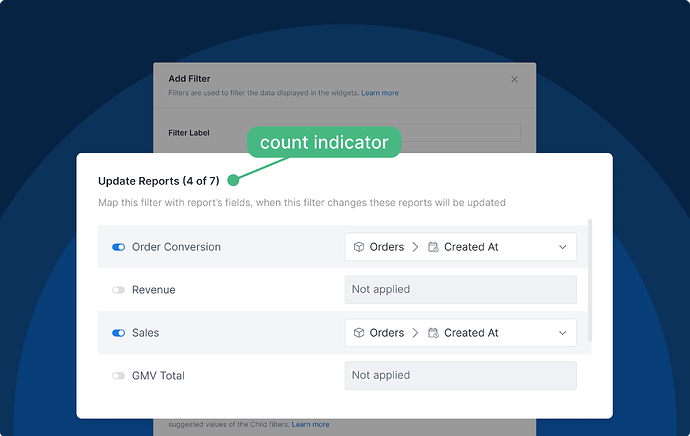
Tired of scrolling to check if your filters are mapped to the right report’s fields? We’ve got your back! We’ve added a nifty count indicator to show you at a glance how many reports are mapped.
Check out our newest UX Update here: 2024 July UX Roundup.
Final words
That’s all for this month. If you’re curious about our upcoming direction, check out our Product Roadmap. If you’re interested in what we just released in the past few months, check out our Release Note.
Do you have any feedback for us? If you do, hit Reply and let me know.
I’ll see you again real soon!


