Introduction
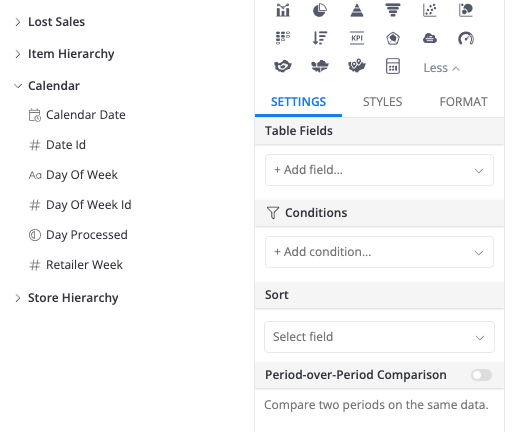
You will most probably recognize this. You open a dataset, and you need to browse through hundreds of fields to find the field you actually need. Also some field names might be very close to each other.
When using naming conventions, you might get away with a better experience. But what if you could organize the dimensions and measures in folders?
Feature suggestion
As an Analyst, I want to be able to organize my fields in groups, for easier browsabiliy.
Example folders:
Revenue metrics
Leadtime metrics
Operation metrics
etc etc
By having the ability to organize your fields in such a way, end users who can build dashboards will have a much better experience
As a workaround to this, you could split it into multiple models, and join those models up again in the dataset with a relationship between them
When you have multiple models in a dataset, Holistics will group the measure/dimensions by the source model.
You could create…
model_revenue = select key, revenue from base_table
model_leadtime = select key, leadtime from base_table
model_operation = select key, operation from base_table
In model_leadtime & model_operation you could then set the attribute for field key as hidden = true to prevent the key(s) showing multiple times.
Then create the dataset with a relationship on key
When your users browse the dataset, the measures/dimensions will be grouped per the underlying model.
Thank you for your suggestion.
I think it would be a very rough workaround just for achieving those folders
You would still have in the end cross-model metrics that touch multiple models.
Most people that have a data warehousing use a Star Schema, and that has one table in the center connecting to other tables. Using your approach might introduce some complexity issues with the SQL generator when you do not set your relations correctly.
What my honest opinion is, that workarounds are only fine when they don’t introduce any issues/limitations.
While the feature request is very simple, the workaround introduces a lot of work and possibly more limitations
If you’re currently surfacing a single model in your dataset with hundreds of fields, then configuring a few separate models to break this out to be honest feels like a sensible thing to do anyway.
That said, I agree being able to group them would be useful - but it’s important to think about the best way/place to do this.
Personally, I would suggest this be configured within the model, as part of the measure/dimension config.
You would then want to have some settings at the dataset level to then control the behaviour, such as sort order of the groups, and sort order of the dimensions in the groups
something like
import '../models/calendar.model.aml' {
  calendar as model__calendar
}
import '../models/sales.model.aml' {
  sales as model__sales
}

Dataset daily_sales {
  label: "Daily Sales Records"
  description: ""
  data_source_name: "my_datasource"
  models: [
    model__calendar,
    model__sales
  ]
  relationships: [rel(sales.date > calendar.date, true)]
  dataset_grouping: [default | custom] #should it use the custom grouping from the dataset or standard grouping?
  dataset_group_ordering: [alpha_desc | alpha_asc | etc] #how should it order the groups
  group_dim_ordering: [alpha_desc | alpha_asc | etc] #how should it order the dims with in the group
}
Thanks for asking Abdel, I personally am very keen to get this implemented, because I feel the pain here as a user myself. I’m pushing internally to get this implemented within Q3 this year! Hope to be able to give you good news soon.
Being able to control where a particular field appears in a presentation layer (i.e. appearing in a user-controllable model or folder) would be a massive help in organising the front-end.
Hi @Alex_H
I believe that there are several possible solutions for the same problem “Organizing fields in dataset”. It can be either supporting folder grouping in dataset (like Abdel’s suggestion), or ability to hide unnecessary fields in a particular dataset,… or all of them.
So we decided to put this request into our backlog and then spend more time researching on the solution first. I’ll let you know if we have any plan to implement it in the next few months
I suggest looking at things like how PowerBI and other do this.
IMO being able to organise the list of fields and put into folders, so that hierarchical fields can be grouped together and that implicit relationship is now very explicit to your report users can easily be seen. At the moment, without complex naming conventions, this implicit relationship is hidden and people cannot see and understand it.
Just hiding fields won’t be enough in this context to make the dataset understandable for users.
I want to bump this topic again because I believe it is quite an essential UX feature. As mentioned here, other tools have this implemented and Looker with the LookML “group label” could serve as inspiration for an AML implementation.
Thanks for raising this @Abdel and @Gabriel. I agree with you that this is quite an essential UX feature. We’re going through product roadmap exercise right now, and I’ll be sure to bring this up with the team. I’ll get back to you when we have any update on this.
Our team is now concentrating on developing the as-code modeling layer; thus we have decided that we will not be able to meet your request at this time. Please know that our team carefully evaluated your request, and has come to this decision based on both business direction and customer interests.
We also want to let you know that this feature request has already been added to our 23Q1 backlog. Our team will get back to you soon when there’s any new update on it.
Thank you for your patience and understanding during this time
We are working on an upcoming feature Dataset View that can potentially addresses the problems discussed above. Would you mind check it out and share us your thoughts on it?
I have just got around to trying this out and it’s a good first step.
For me the problematic piece of this solution is having to define the groups and ordering over and over again for specific table.
For instance, if I have a table Products then I use that in 4 different datasets, I have to define the groups/hierarchies and ordering 4 different times.
What would be great here is the ability to define a default view for each table, which can then be overridden in the dataset if required.
Is this something you are considering for this feature?