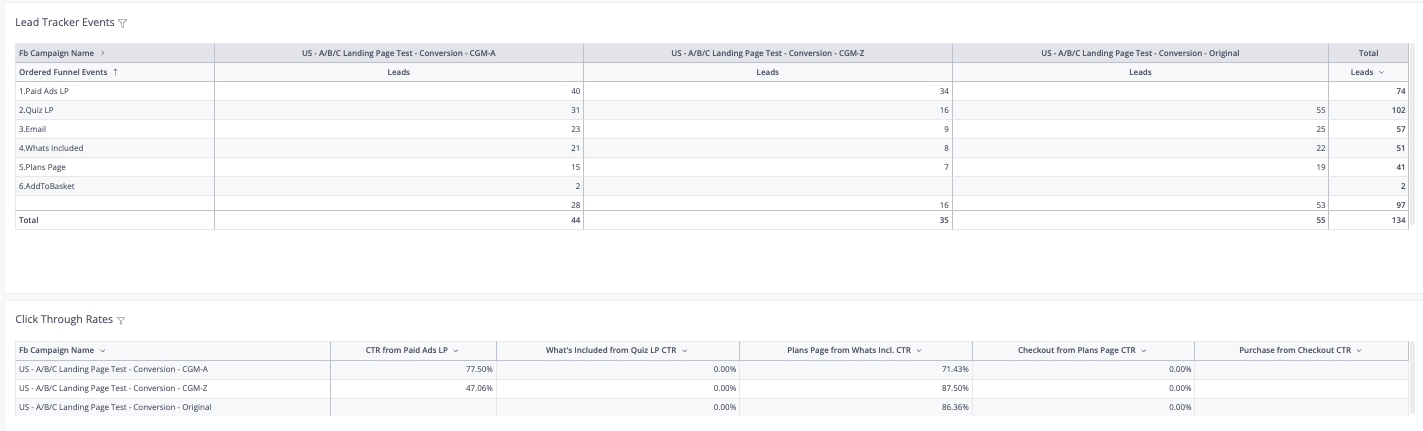
Hey guys, I am trying to build traffic funnel reports. As you can see from the picture I have built one chart that has our different funnel stages listed in the rows and then the number of leads reaching each stage of the funnel as the chart values. There is also a column for each different facebook ad that we are measuring.
This is how I want that report to look and I did this using a pivot table quite easily.
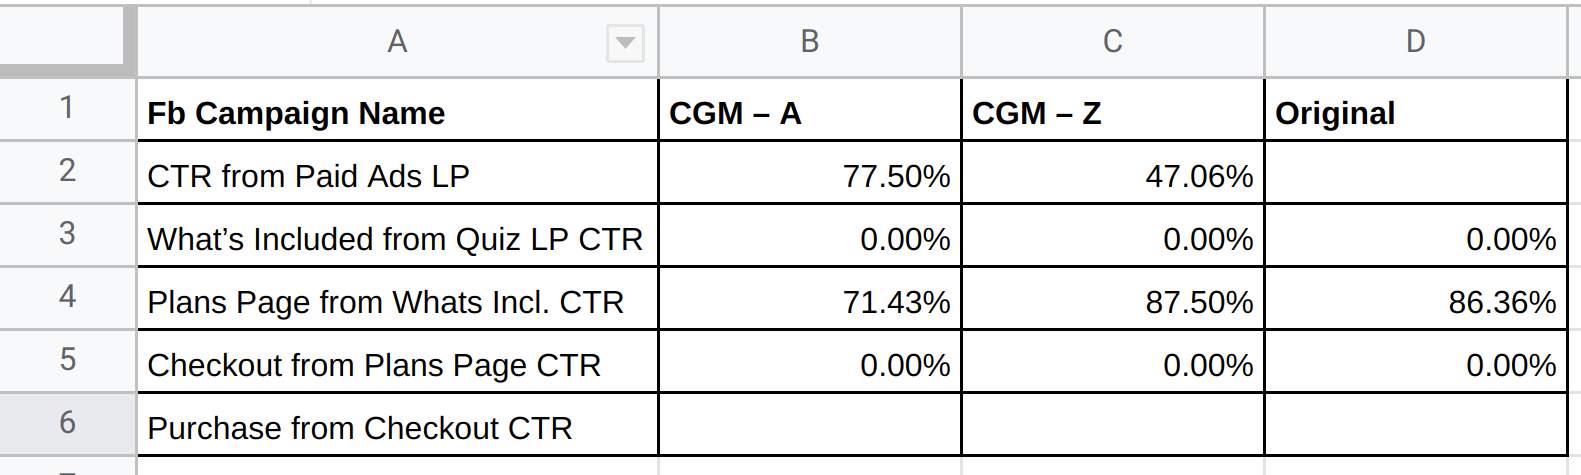
Now beneath that, I am looking to measure the ratios of those figures but I want the table to vertical just like the one above. I have had to create custom measures to build the metrics but i can’t put them as rows in the table - this means I haven’t been able to build a vertical report.
Does anyone know how this can be done?
Does anyone have any examples of any similar reports built nicely using holistics?
Hi @michael.mccann Thanks for your sharing. We really appreciate it!
At the moment, I’m afraid that there is no perfect solution for your case, except for using Transform model.
In the near future, if we support the ability to swap the table columns and rows, I believe it can help solve the issue