Yesterday I saw Dmitry Sofiev’s question: Pivot Table > Present Measures as rows in pivot table and realized that I also had the same issue. When I work with a table (or pivot table) that has a lot of columns but a few rows, I’d like to swap its rows and columns to make it look nicer.
If you also want Holistics to support this feature, feel free to share your case and upvote this topic
Often find that my end users want to see tables with columns being the date. Then each row is a different value. For example:
Columns:
weeks
Rows:
Sessions (format #)
Convert rate (%)
Revenue ($)
WoW change in Revenue (%)
The above (as far as I know) is impossible to do (with correct formatting) in Holistics.
In Holistics, using Pivot Table I can only do this with rows and columns reversed… I wish I could just click on ‘transpose’ button under Format, then it would just flip the rows and columns for me.
I know this is an old thread, but I don’t think this has been implemented yet as far as I can tell. We’d also love to see this feature. Thanks in advance!
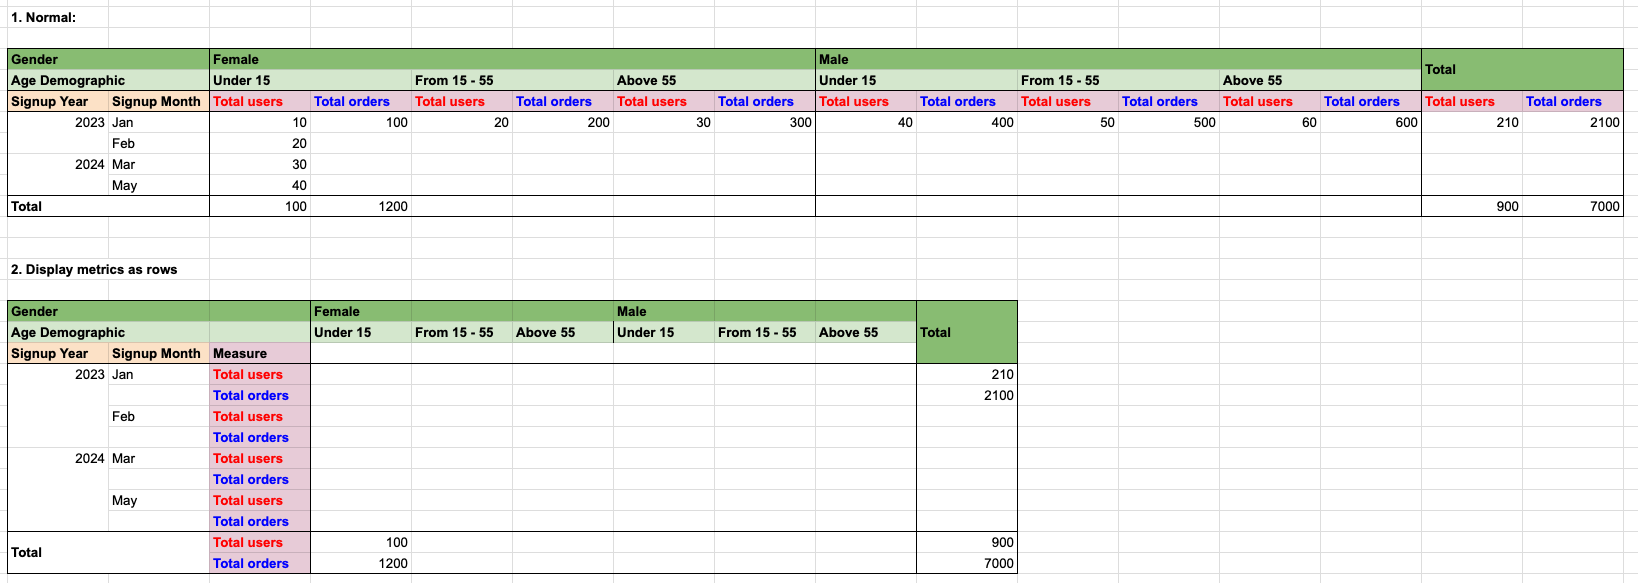
We’re working on a new feature that lets you display metrics as rows (instead of columns) in the pivot table. You can get a sneak peek at its layout in the image below.
The first release is planned for February 2025 (right after our Lunar New Year celebrations at the end of January).
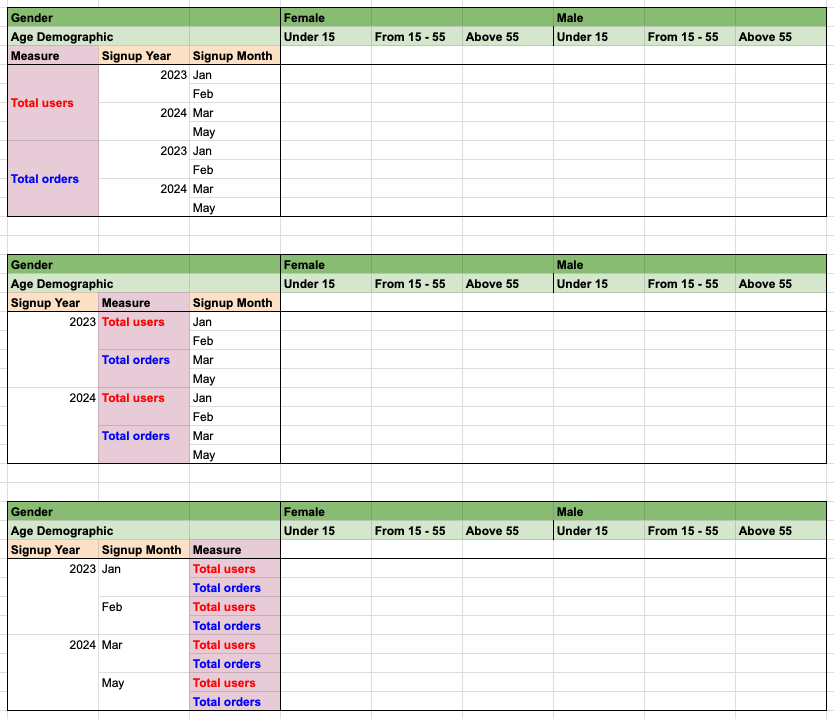
Following this, we’ll introduce another enhancement that allows you to control how metrics are displayed relative to dimensions: Inside, Outside, or Interleaved. This improvement is expected to launch by late February or early March 2025.
We’re excited to share that our Show metrics as rows in Pivot Table feature has been available for all users!
For detail, please visit our community post here: [Launched] Show metrics as rows in Pivot Table
We look forward to your feedback once you’ve had a chance to try it!