Trendlines in line charts

Any update here? It’s been over 8 months and I don’t believe we have trend-lines in the standard charts yet.

This was something that we chatted to the team and said we needed this feature when we first signed on with Holistics and that was 18+ months ago.

They want us to use the custom charts option. I’ve tried a few times but could never get exactly what I wanted and there’s no solid example that I could find for what we’re doing (bar chart w/ simple regression trendline). If anyone has luck please post the code

Hi @DataGeekDude and @sm_mk,

Our apologies for the lack of visibility on the progress.

We definitely agree that trend-lines are an essential addition to the standard built-in charts.
However, we plan to first switch our chart engine to Vega-lite, which will allow us to easily adopt more extensions for these standard charts, such as Trend-lines. Therefore it may take some time before this feature is available.

Please be assured that we are committed to creating standard charts for common reporting use-cases like this, and only intend Custom charts for ad-hoc reporting needs (or in some cases, as a temporary workaround).
Also, Trendlines is a highly prioritized item in our backlog.

In the meantime, I’d be happy to help you with a workaround. Could you please share the problem you are facing with creating Trend-lines using Custom charts?

Hi @sm_mk,

Sorry for the inconvenience as the “Trendlines in chart” template above is not available.
We’ve whipped up another template for “Scatterplot with Trendline” in the above thread. There is a full code example & a step-by-step guide for it, which hopefully will be easier to use or customize for a different chart type. Like bar chart for your case.

Please give it a try, and let me know if you need any assistance :beers:

I think it’s just hard sometimes to work out the VegaLite syntax etc to create charts and it would be great to have that easier or more examples, like a bar chart with trend line in your examples library

Thanks, Craig for your feedback! :pray:
I see. We’ve been working to make Custom charts & Vege-lite syntax easier to adopt, but I reckon it’s still tricky and requires lots of time for trial and error in many cases.

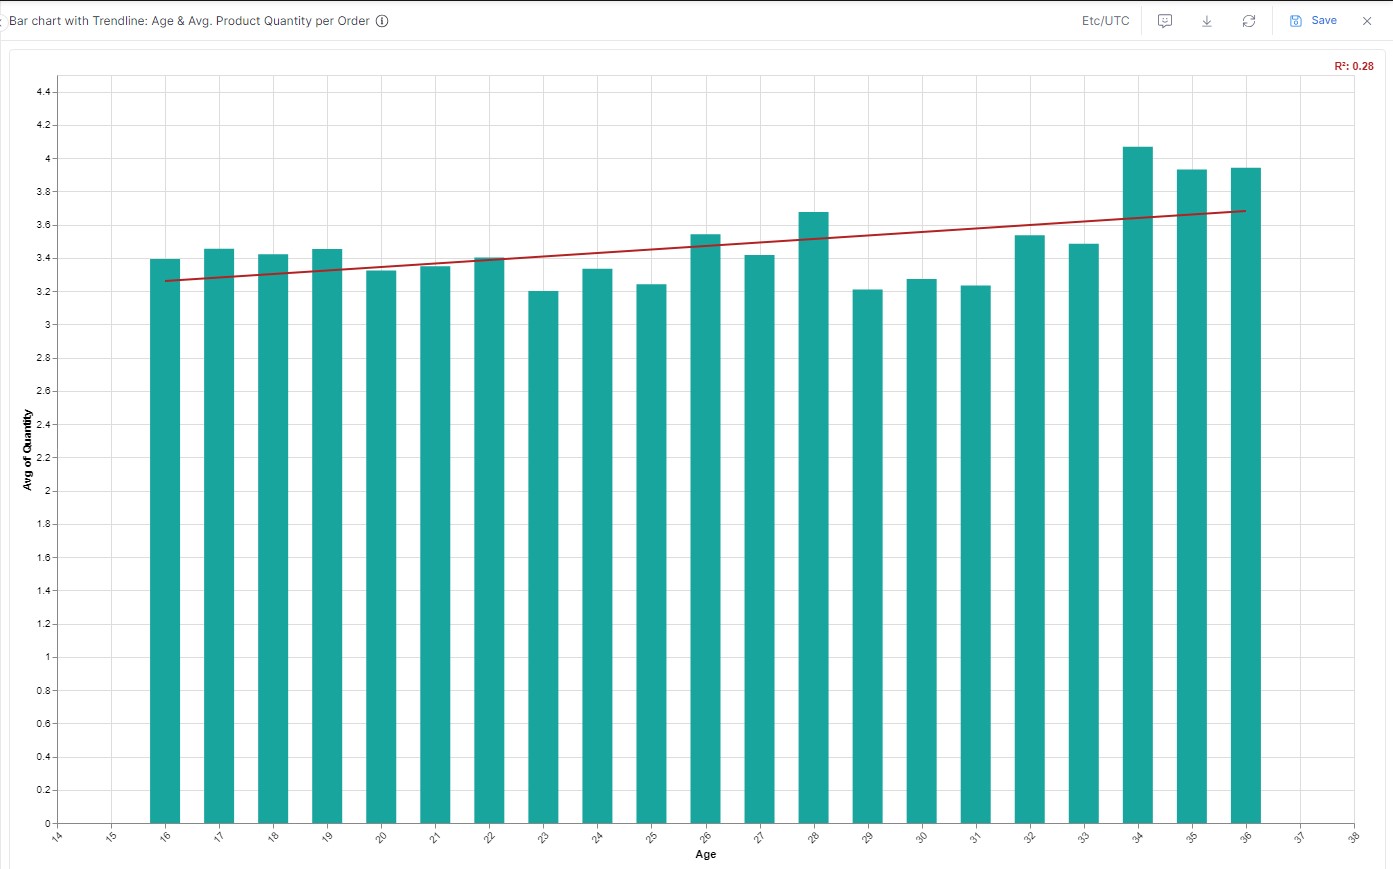
We’ve been able to put up a simple Bar chart with Trendline like below. Is it similar to your desired result? @DataGeekDude

Yes thats great, and I will go about getting that into our Holistics workspace today.

1 Like

Great!
I’ve put it on the Template library for you guys to make use of: <Bar chart with Trendline | Custom charts Library - GitHub>.

Pinging @sm_mk also, since it might be useful for you as well!

Cheers! :beers:

Hi @sm_mk @david-ri @Guido_Stark @hari @DataGeekDude,

We’re currently reviewing our backlog and would greatly appreciate your insights regarding the trendline feature. Could you kindly share your use cases for trendlines with us? Specifically, we would like to know:

  • In which types of charts do you want to create trendlines?
  • Which types of trendlines do you find most important (linear, moving average, exponential, etc.)?
  • What specific use cases or types of analysis do you intend to achieve with trendlines?
  • Are there any styling options you expect to have (dashed lines, labels, tooltips, etc.)?

Any additional information you can provide on this matter would be incredibly valuable.Your inputs will greatly help us better understand your needs and inform our solution design should we support the trendline feature in the future :smiling_face_with_three_hearts:

1 Like

Hi @sm_mk @david-ri @Guido_Stark @hari @DataGeekDude!

We’re thrilled to announce that trend line feature is already in progress and will be released to you soon :rocket:

Here’s a sneak peak of how it will look like :wink:

1 Like

This is awesome news, I appreciate Holistics keeping our requests in the queue. Also really loving canvas as-code so get that into prod asap, saved me sooooo much time!

2 Likes

Fantastic work team - this is very good news!

3 Likes

Any idea on an ETA? Will there be multiple trendline options?

Hi @sm_mk This function is going to be available within this month :blush:

In the meantime, could you kindly clarify what you meant by “multiple trendline options”? We want to ensure we address your needs comprehensively.

Thank you :blush:

Sure, for example if I have a line graph with multiple lines, each representing a different client in the legend, i’d like to see the trend line for each one.

1 Like

Thanks for clarifying @sm_mk :blush:
Yes, you can show the trend lines for each series as follows:

Hi @sm_mk @david-ri @Guido_Stark @hari @DataGeekDude

We have an exciting news for y’all: Trend Lines are now available in Holistics! :rocket:

We’ve made it very simple (yet flexible) to add a trend line in our platform:

More about the feature: Public Docs | Trend Lines

We’d like express our utmost gratitude for your patience and support during the development process of this feature. For any questions or feedback you may have, please don’t hesitate to let us know. Thank you! :smiling_face_with_three_hearts:

1 Like

Hi team,
Great work :fire: will you be adding a moving average at any point in the near future?
That would be super helpful for some of our series.
It would also be very helpful to a slightly extended information in the documentation to show exactly how the behaviour functions with different time periods in play?
Many thanks :slight_smile:

5 Likes

Very nice! Second the call for a moving average trend line, we use that a lot and have to do a bit of a hack to get there. Also, being able to plot an arbitrary line (basically a goal line) would be great too.

4 Likes

Hi @Guido_Stark and @Ian_McLaren

Thank you so much for the suggestions!

Regarding the moving average, we already have an AQL function in place (AQL Moving Average).

Have you played around with it and how did it work out for you?

When you said you wanted to have moving average in the app, were you referring to a point-and-click GUI like that of trend lines?