Most data practitioners we talked to agree on two things.
1/ We need an abstraction layer to define metrics consistently and rigorously.
2/ We do not have a consensus on how this layer will eventually look like. Not yet.
Between every Substack post asking for or championing the semantic layer, the buzz feels palpable.
Yet when we went through the literature, few talk about the true first-principled reasoning for such a concept, nor do they mention what an ideal design of such a layer looks like. So when someone invited us to speak at dbt meetup in Singapore recently, we decided to dig into this ourselves.
And what we found is fascinating: Semantic layer (or Metrics layer) is not just a concept, it is an entire paradigm shift in how people think and reason about analytical data in the business context.
We call this paradigm shift “metrics-centric thinking”.
Moving from table-centric thinking to metrics-centric thinking is like moving from Assembly to C, or from C to Python. You’re going up the abstraction levels, getting closer to the business logic, and leaving the technical semantics behind.
What does this mean for the analytics world?
It means a step closer toward truly self-service analytics - where non-technical users can have a much better shot at reasoning about analytical data without being confused by the “technical way of data thinking”.
It means data analysts now can play a more impactful role as thought partners, reasoning at a much higher level of abstraction, one that’s more resembling how their business counterparts would normally think.
Alright, let’s dive in. There are a few ways you can consume this:
- You can watch the 30-minute presentation video.
- If you’re the skimming type, I included below a narrated transcript right in the email, though it’s not as comprehensive and nuanced as the video.
- Or you can read the slides.

How it started
“Semantic layer" is a bloated word because different vendors might define it differently.
While the discussions surrounding the semantic layer have been going on for a while, they reached momentum in 2021 with a clamor of noteworthy events. So let’s have a quick walk-through to get a better understanding of how it started:
- In 2021, Transform nabbed $24.5M in series B funding to build a query and build metrics out of data troves.
- dbt Lab’s co-founder raised the question about incorporating metrics into dbt in a post made on the dbt Github - paving the way for the development of their own semantic layer. They later launched their semantic layer in 2022 and acquired Transform in 2023.
- Airbnb published a comprehensive blog post explaining Minerva, their internal metrics layer.
- Benn Stancil sparked discourse on the semantic layer by addressing its role as the absent component of the contemporary data stack. The fundamental issue with our present stack, as he identified, is the lack of a centralized repository for establishing metrics cohesively.
Investments made. Products announced. Discussions sparked. Some call it Semantic Layer, others call it Metrics Layer. Whichever name it takes, it’s the instantiation of a larger shift in perspective we mentioned in the beginning.
Let’s move on with a concrete example before getting to this paradigm shift.
Example: Same-day Activation
(The following example is inspired by Pedram Navid’s deep-dive analysis of metrics layers. It’s one of the best analyses we’ve read to date and we recommend you read it in full. )
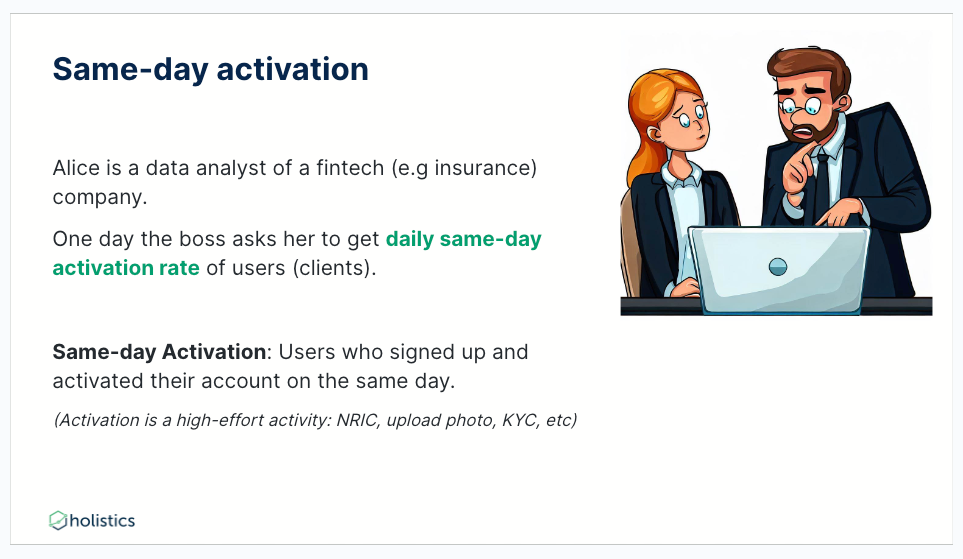
Let’s spare the SQL (you can read them in the slides/talk), to get same-day activation, Alice will need to:
- Create
user_funnelthat stores the signup_date and activation_date for every user_id. - Create
same_day_activationsthat check if a particular user_id signs up on the same day. - Create
same_day_activated_dailythat sum aggregates the numbers. - And finally, create
activation_ratesto calculate the conversion rate by day.
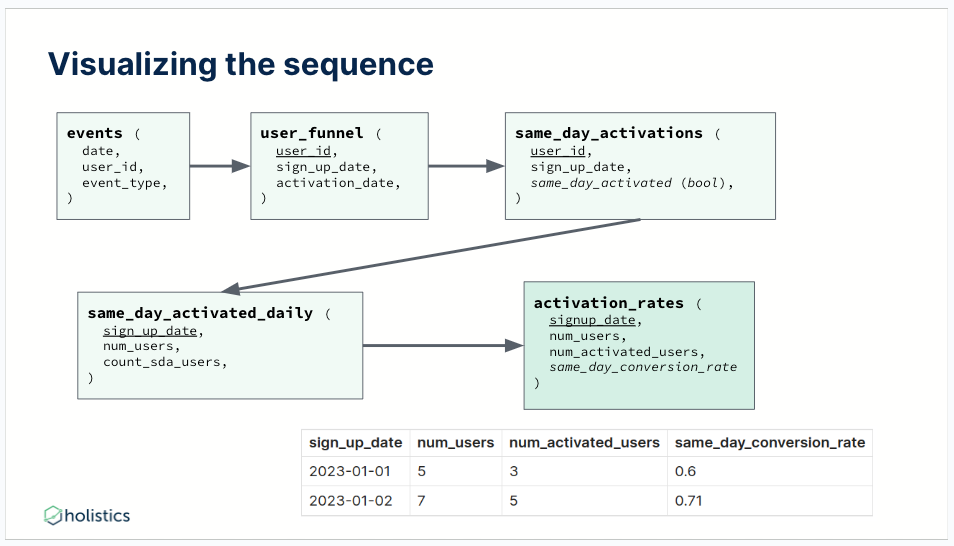
Visualizing the sequence to get activation rate
The maneuvering sequence was simple enough - but was it a good one?
If we look back at the whole process, Alice kept creating new model after new model until she arrived at the activation_rate metric. A lengthy sequence for a single metric begs the question of whether the effort was worth it, or if there is a better way.
We get the answer when we look into a slight variation of the same metric.
The problem: A slight variation requires recreating the table logic
Now, instead of asking to get same-day activation, what if the boss asks Alice to implement a 7-day activation rate? Reviewing the DAG, we can see Alice would need to duplicate 3 models with slight logic changes: 7_day_activations, 7_day_activated_daily, and activation_rates.
The desired metric is simple, why are we doing this again?
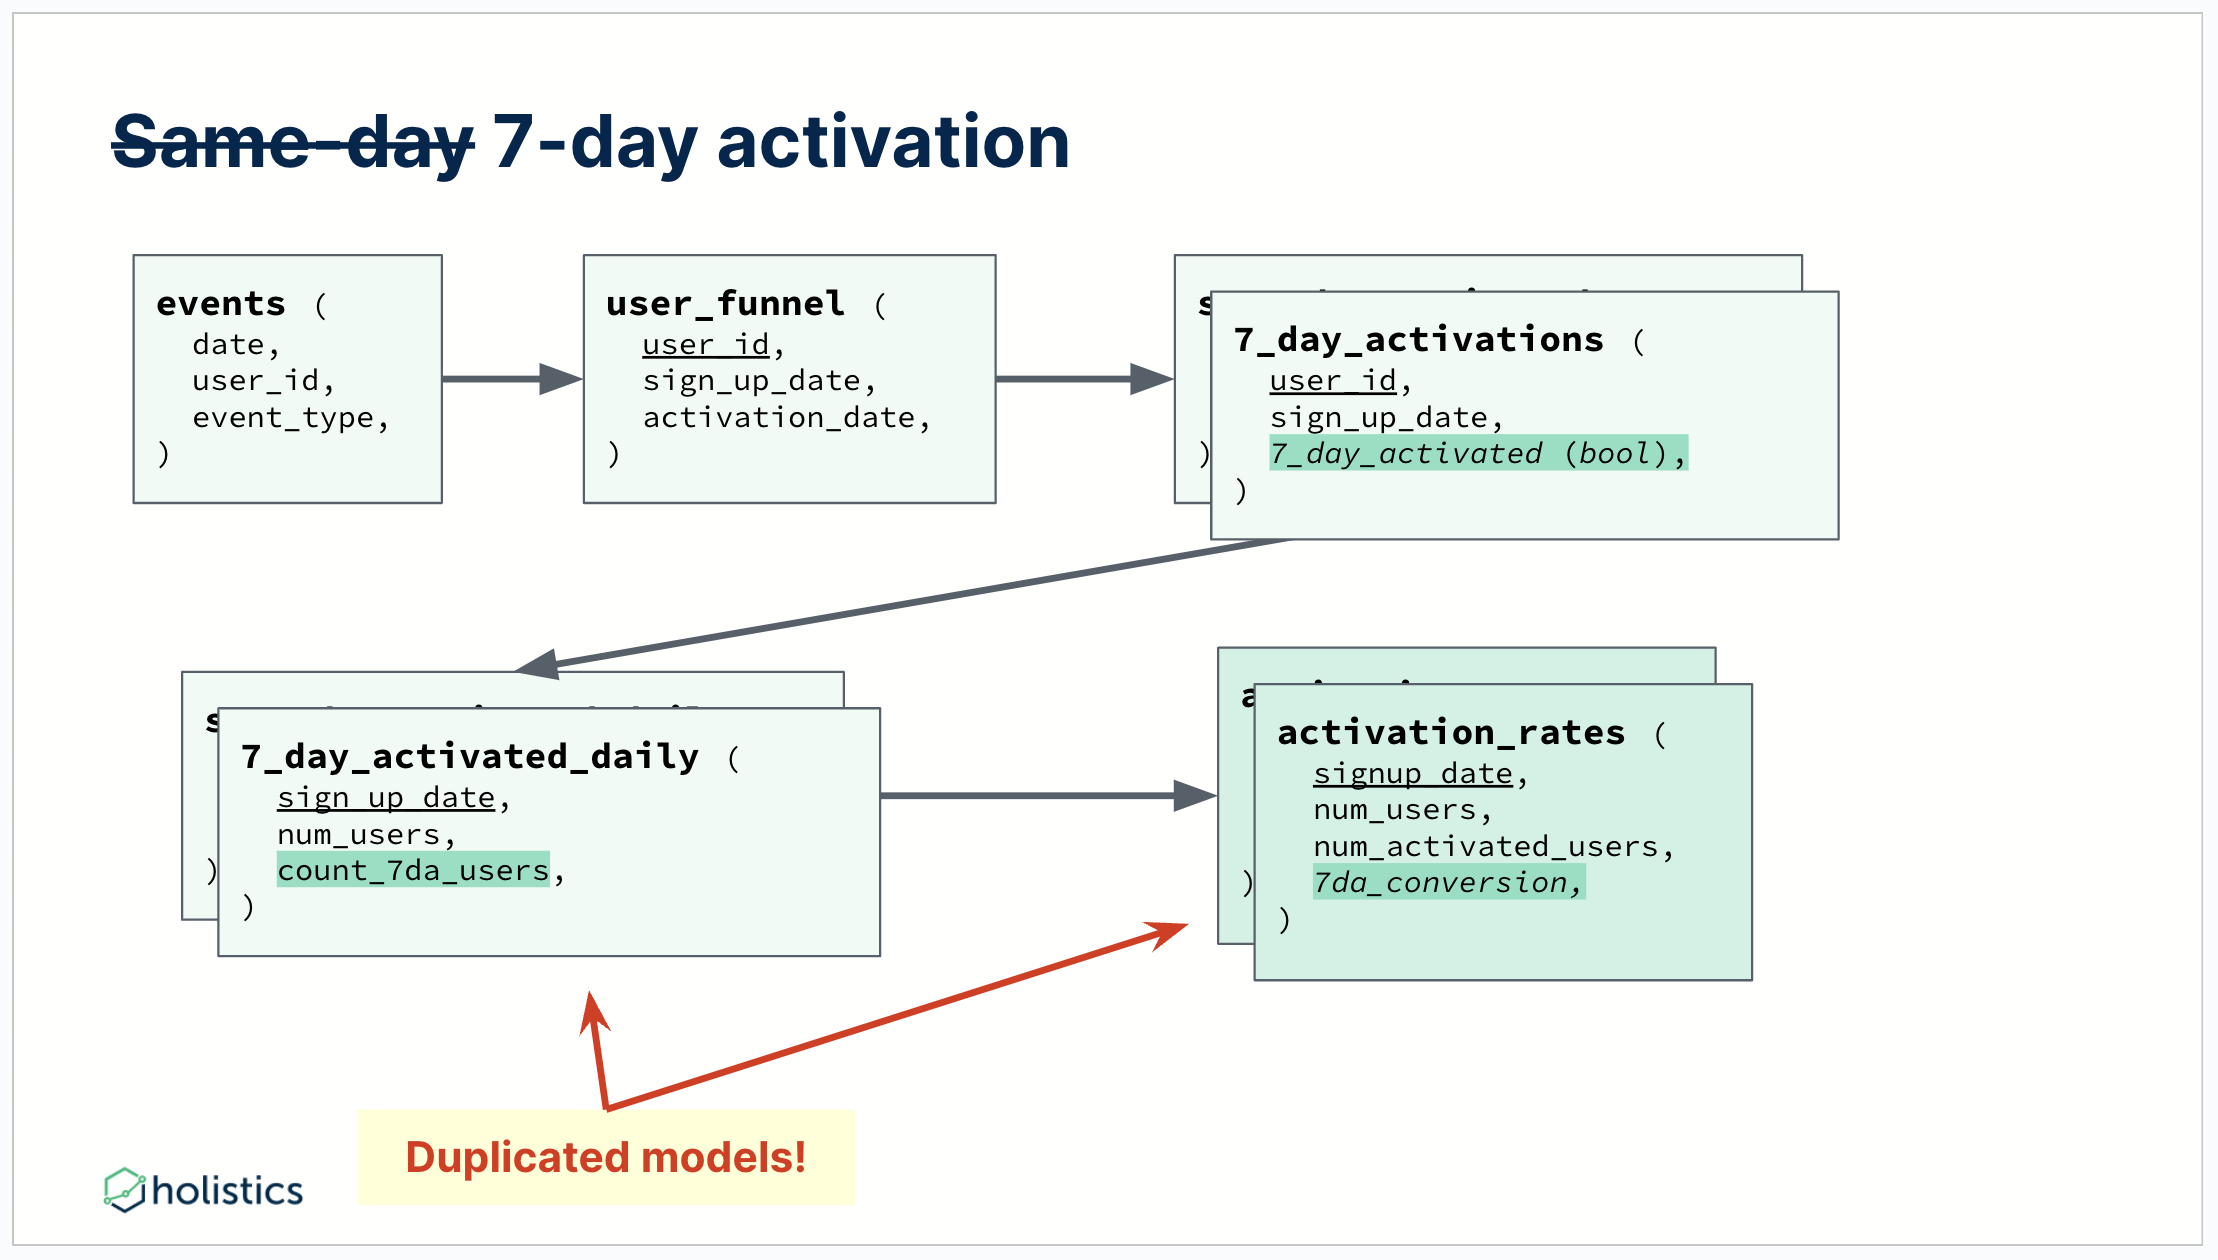
A slight variation requires recreating the table logic
It’s now evident the problems with this dimensional modeling approach: Any slight variation causes lots of rework for analysts, which is both error-prone - you have to carefully maintain duplication, and time-consuming - any slight variation requires analysts to put in tons of rework.
Is there a better way?
Hopefully, yes. Because our way of doing it was the analytics equivalent of the early steam engine: Somewhat functional, but much of the effort is wasted in the process without a strong grasp on what really matters.
What matters, in our case, is the logic of metrics.
It doesn’t help that in dbt, models are first-class citizens. You define models, reuse them, and track dependencies between models using a lineage graph. Models are the atomic unit of work, so when you transform the data, you’d still need to carry over the dimensions for the tables/SQL query to work with.

Metrics are what really matters!
But what if we can decouple the metrics from the dimensional definitions?
What if instead of fixating on model-based thinking, we switch to a metric-centric paradigm, how would the world look like?
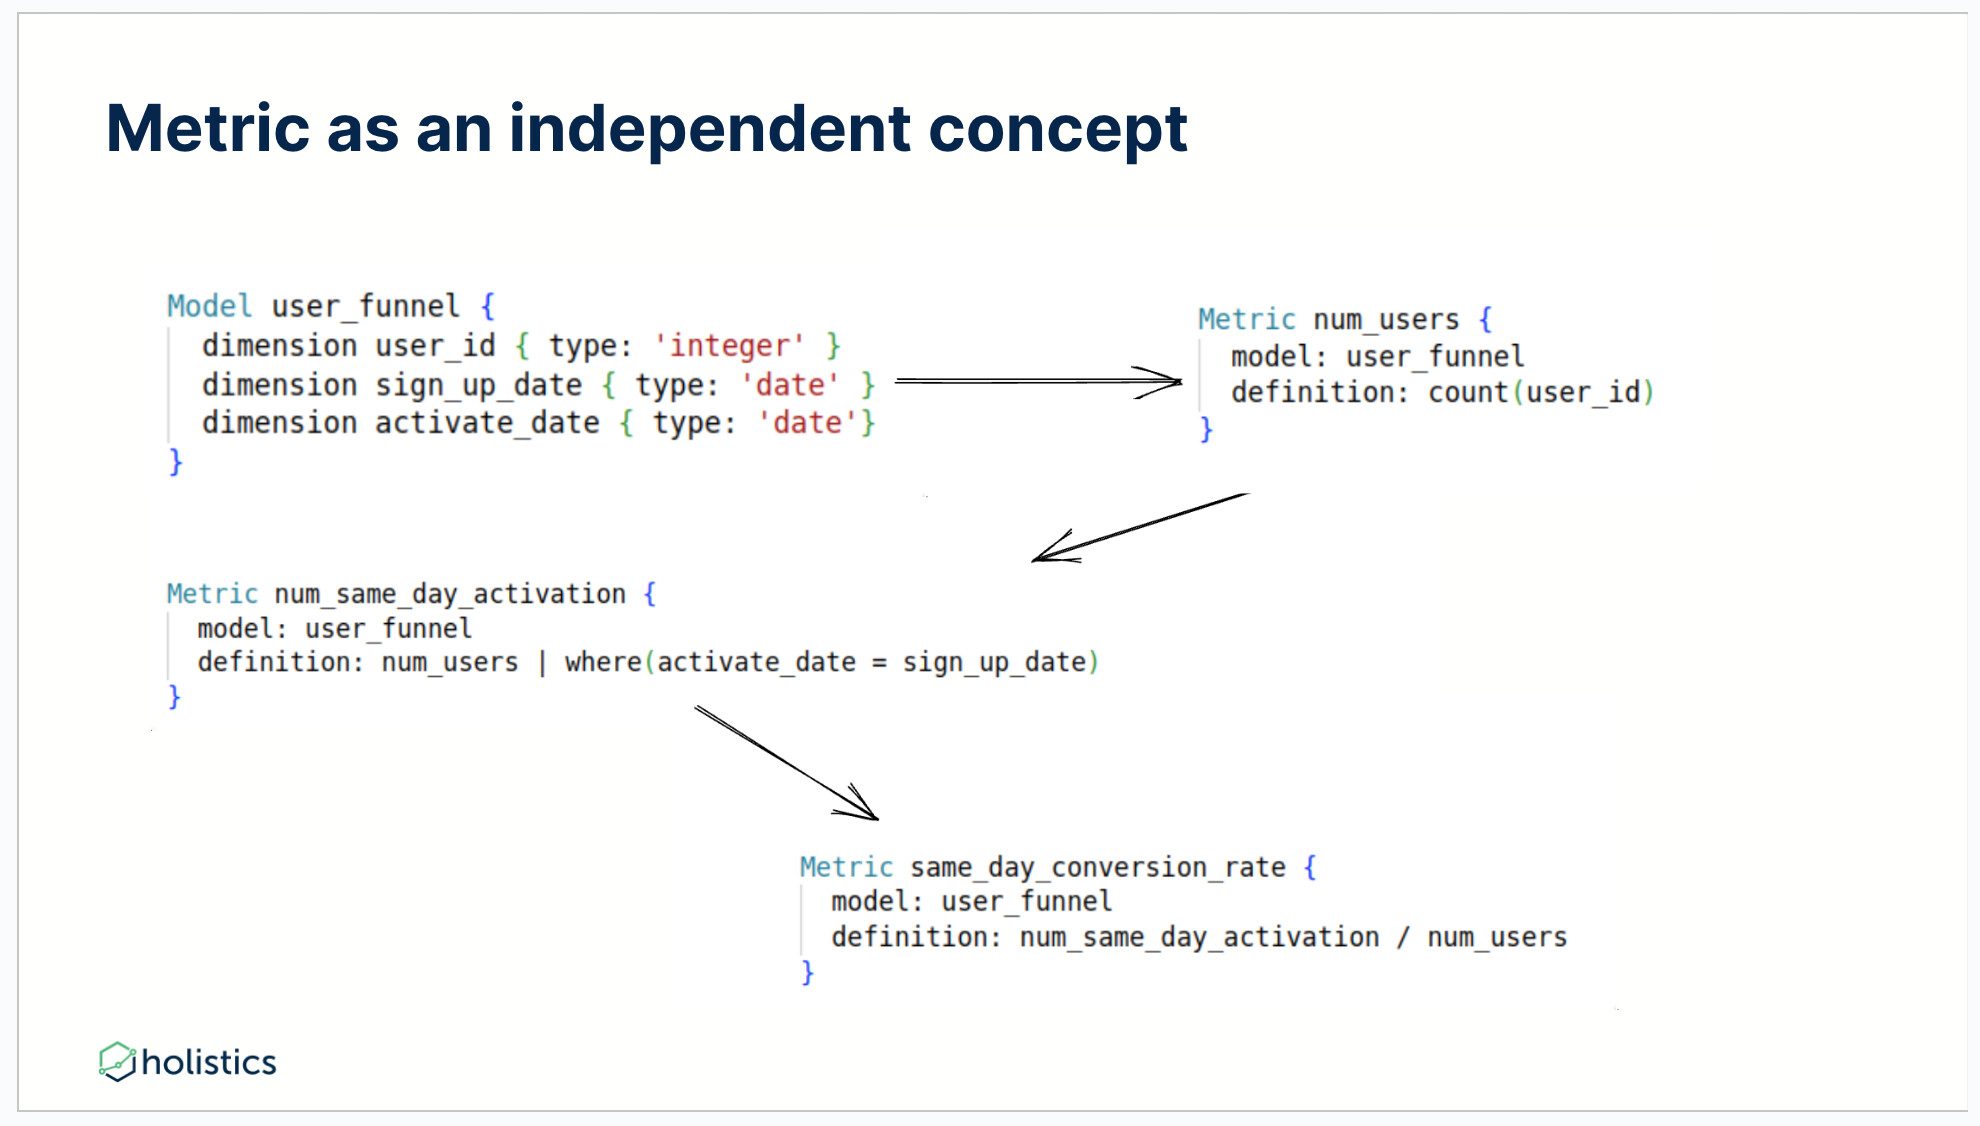
Switching From Model-Centric Thinking To Metric-Centric Thinking
Let’s rebuild the above diagram using a metric concept and defining them based on a model. Start with a pseudo-syntax language:
- First, define a model with 03 different dimensions.
- Define a metric to count the number of users.
- Define a metric for num_same_day_activation.
- And we have the end result: a metric that is the ratio of the 02 metrics we built - the number of same-day activation over the number of users.
To get a result similar to what we have in SQL, you’d just need to write something like this.
Query q1 = select(
  sign_up_date,
  num_users,
  num_same_day_activation,
  sam_day_conversion_rate
)
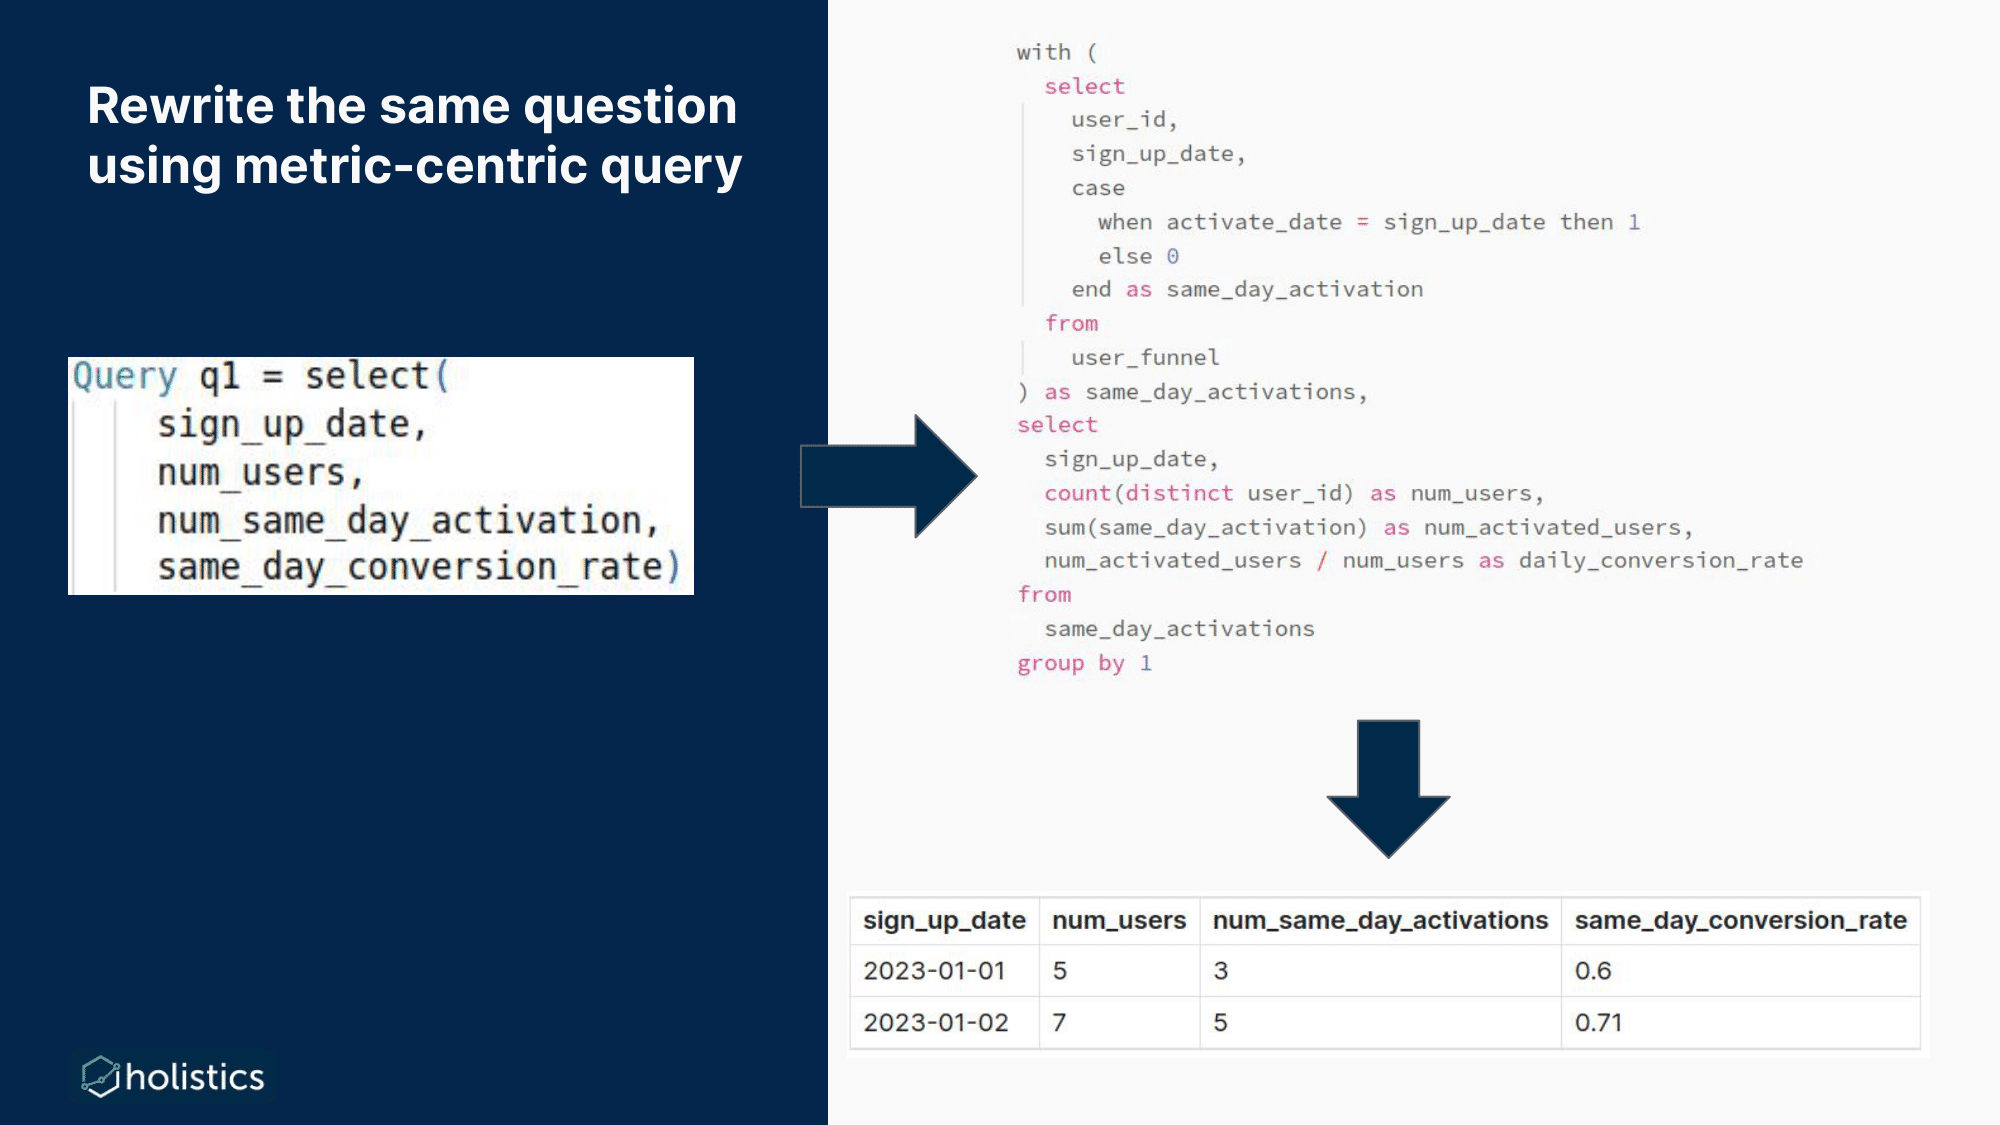
This example highlights how a switch from a model-based approach to a metrics-centric approach helps analysts get the same result while expending significantly less time and effort.
What are the other benefits of decoupling metrics from dimensions and tables?
- It takes less mental effort to write - because you just need to have your focus on the aggregation you want to calculate.
- It is more intuitive and closer to the end-users business language. For example, in this example,
num_same_day_activationis defined as the “number of users, where, activate date is sign up date. Sound like your everyday English. - It minimizes duplication of logic and efforts for modifications.
- (and most importantly) It provides greater flexibility as dimensions can be combined at run time instead of development time, which means that Bob can combine different dimensions at run time - instead of waiting for Alice to write SQL in development time and give them to him at the end of the day.
And it doesn’t stop here.
Using this made-up query language, Alice can easily give Bob 7-day activation.
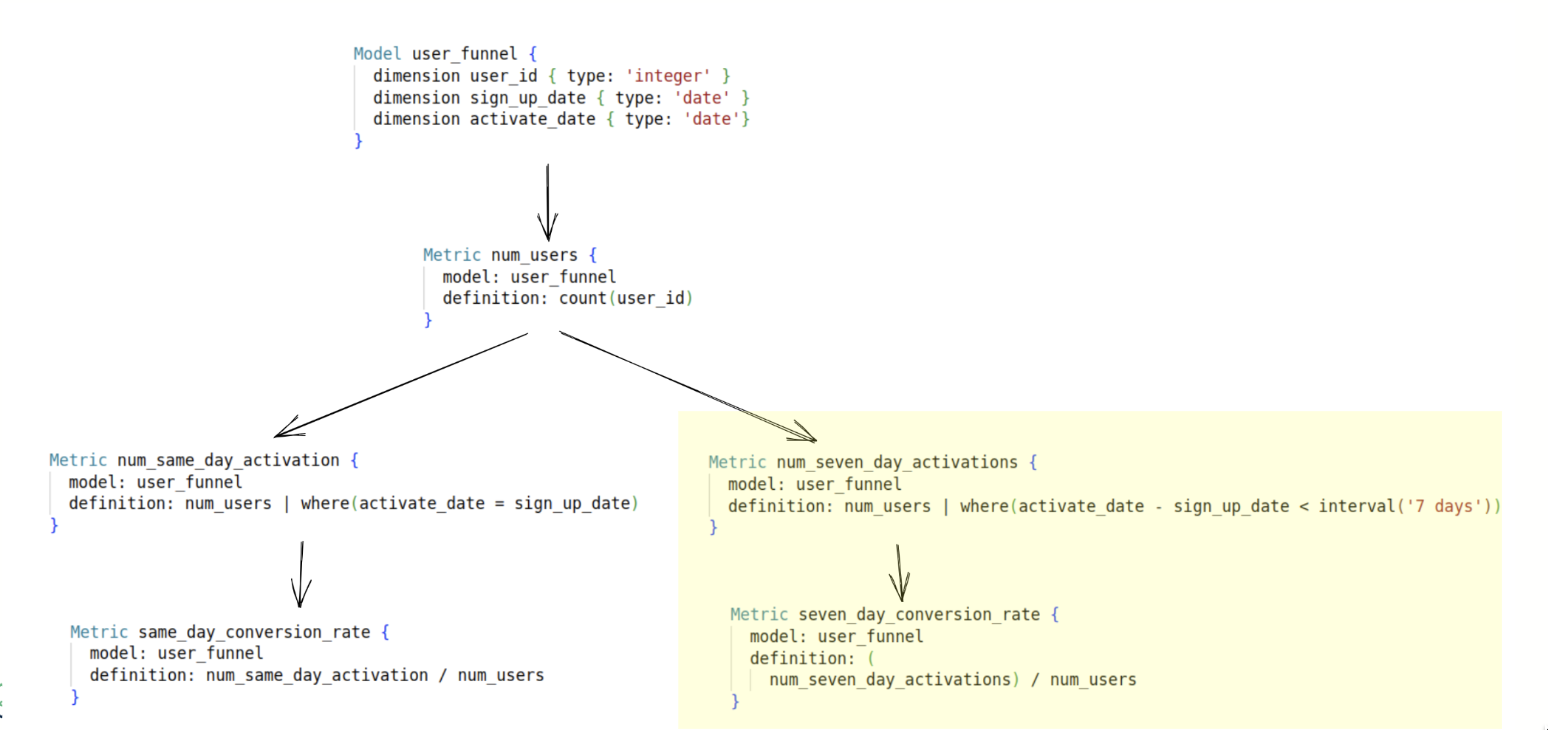
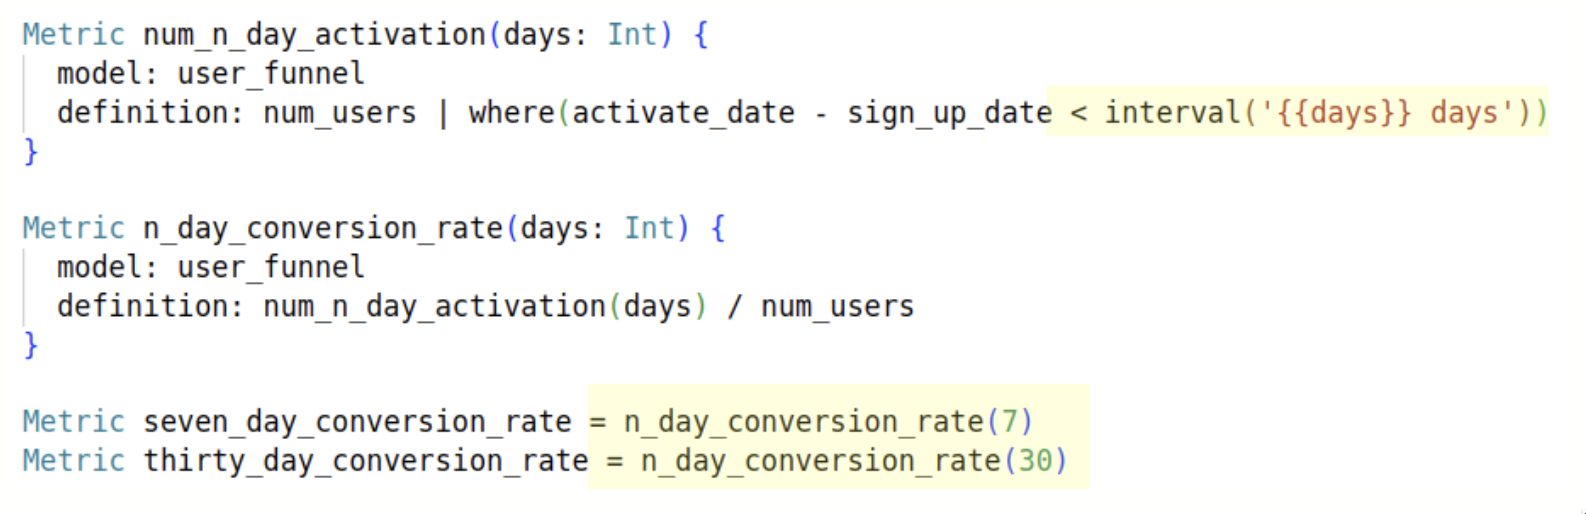
or generalize it with parameterized metrics to give Bob any n-day activation rate.
Working with multiple tables
What if there are more tables involved?
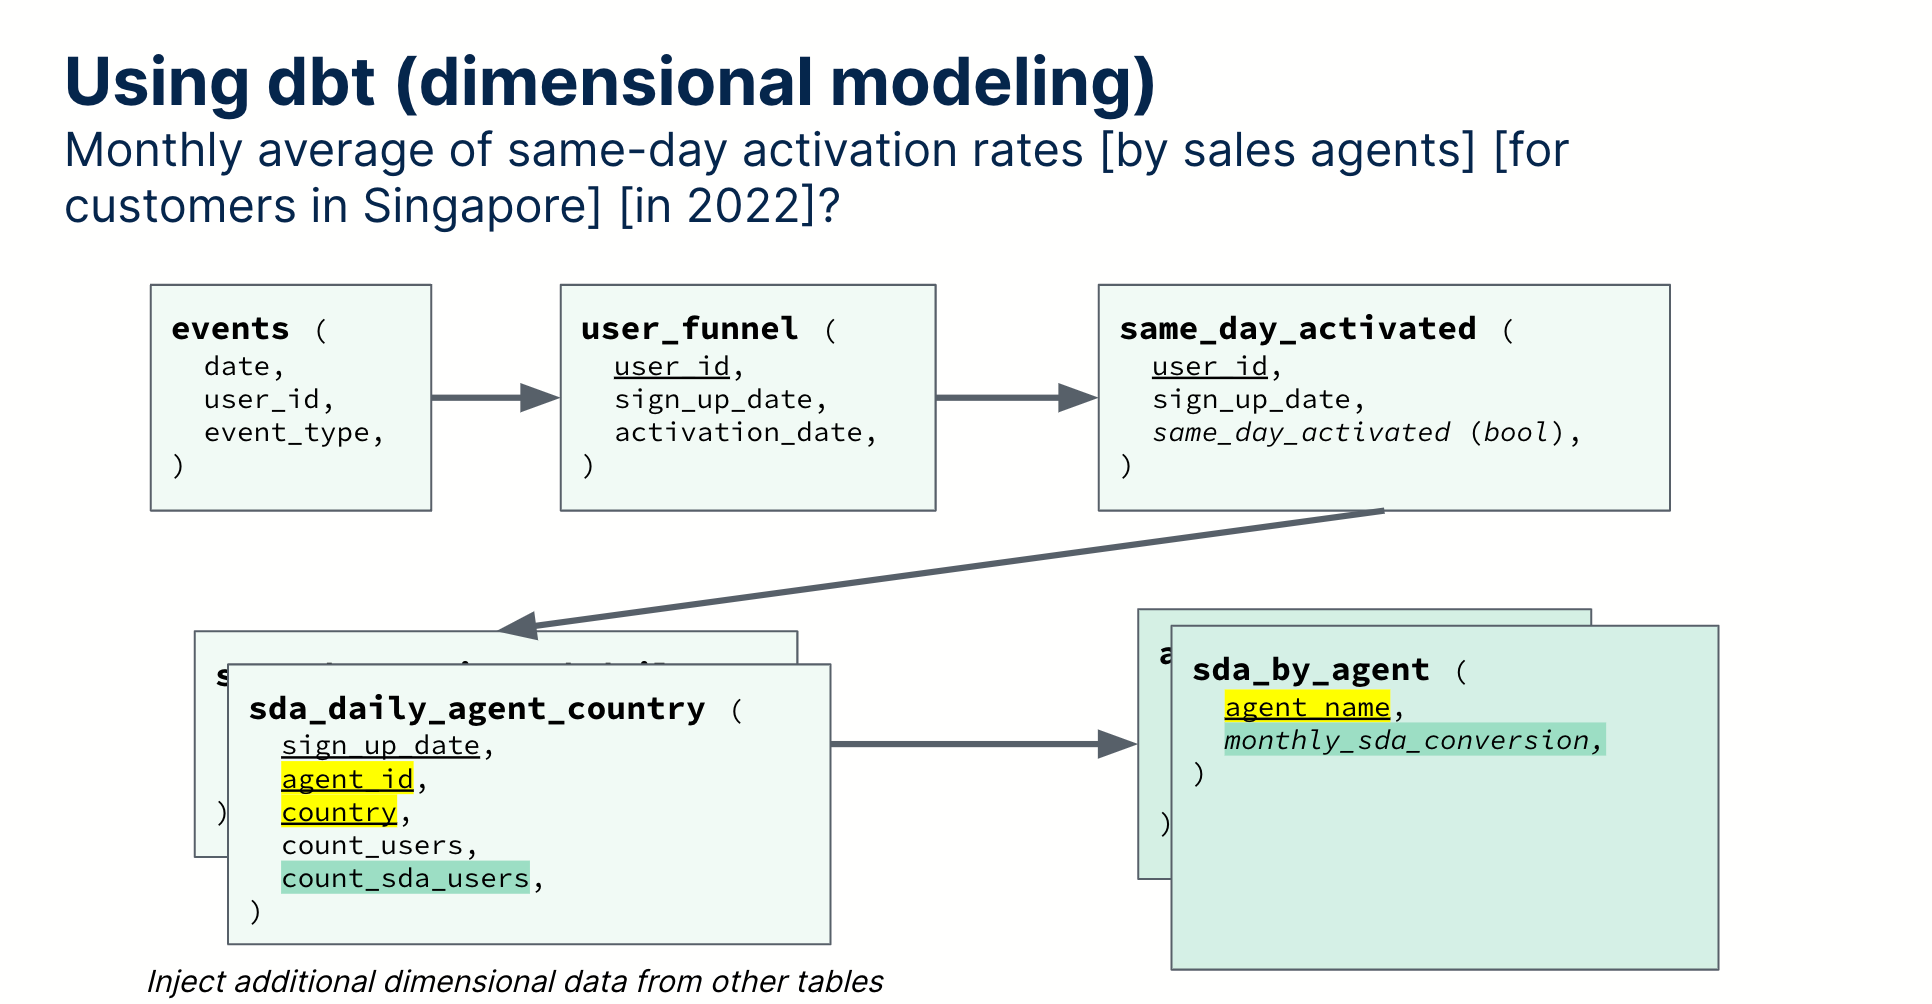
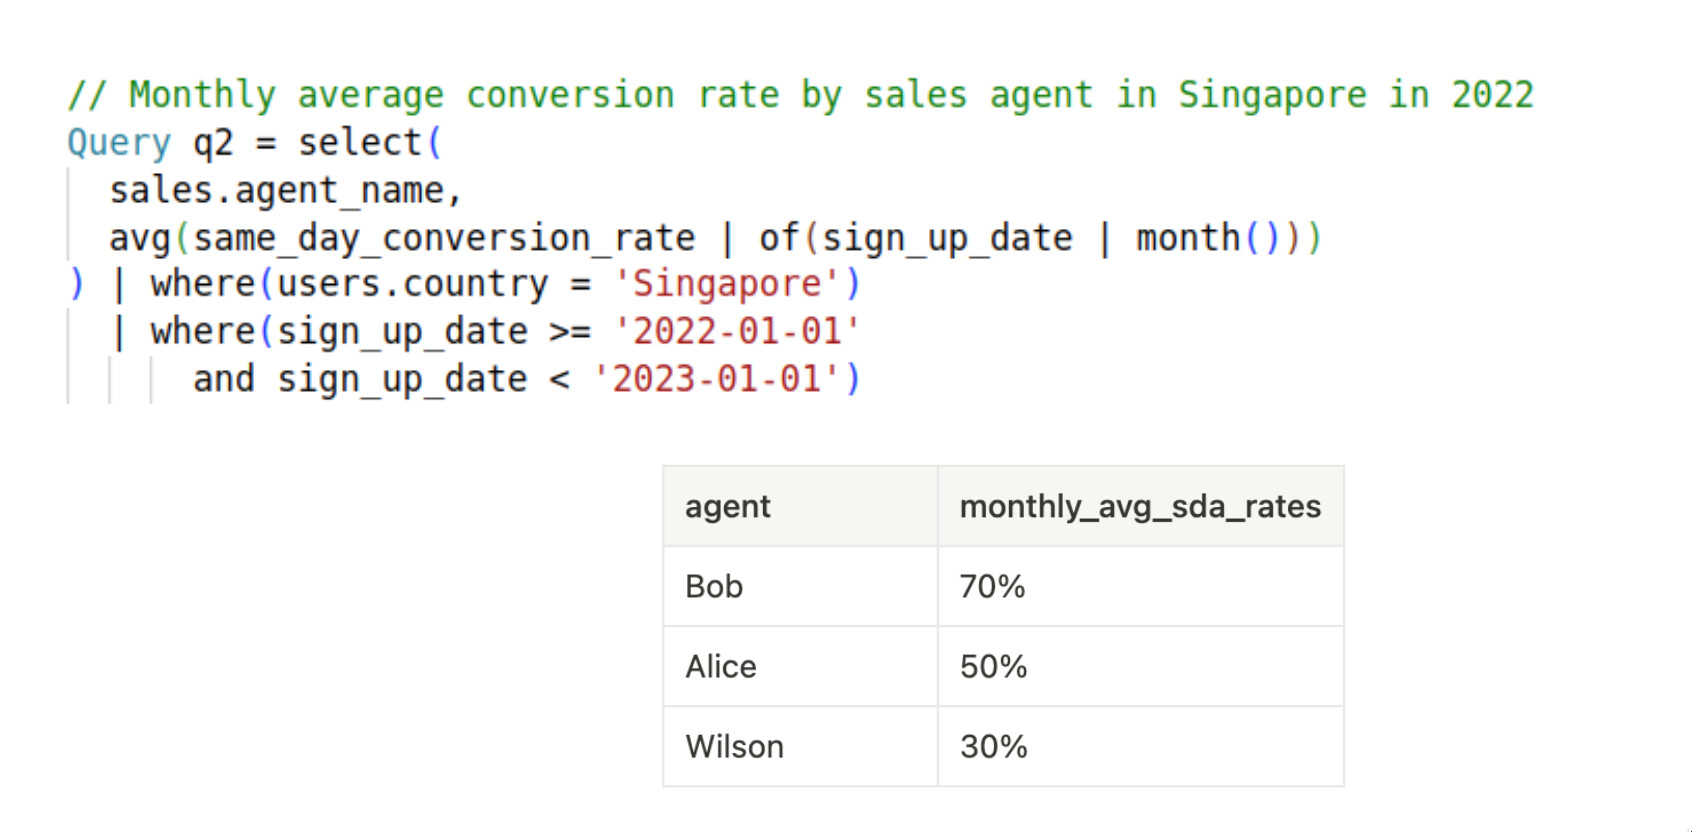
Let’s say I want to calculate [monthly average] of same-day activation rates [by sales agents] [for customers in Singapore] [in 2022]?
How long would it take you to get this result in SQL? 10 minutes? 15 minutes? Using dbt dimensional modeling, you’d need to go back and identify the right places to join the users and sales_agents table, and the right places to aggregate.
It doesn’t look too complicated - but the whole hassle of finding where to join, where to aggregate, and where to filter sounds like a lot of boring efforts for analysts.
While it’s not technically harder, it’s more mentally draining.
How’s about the same thing with metric-centric thinking?
With all of these metrics available - that we have created before, to answer the question, we’d just need to write 05 lines of code. You don’t even need to worry about joins.
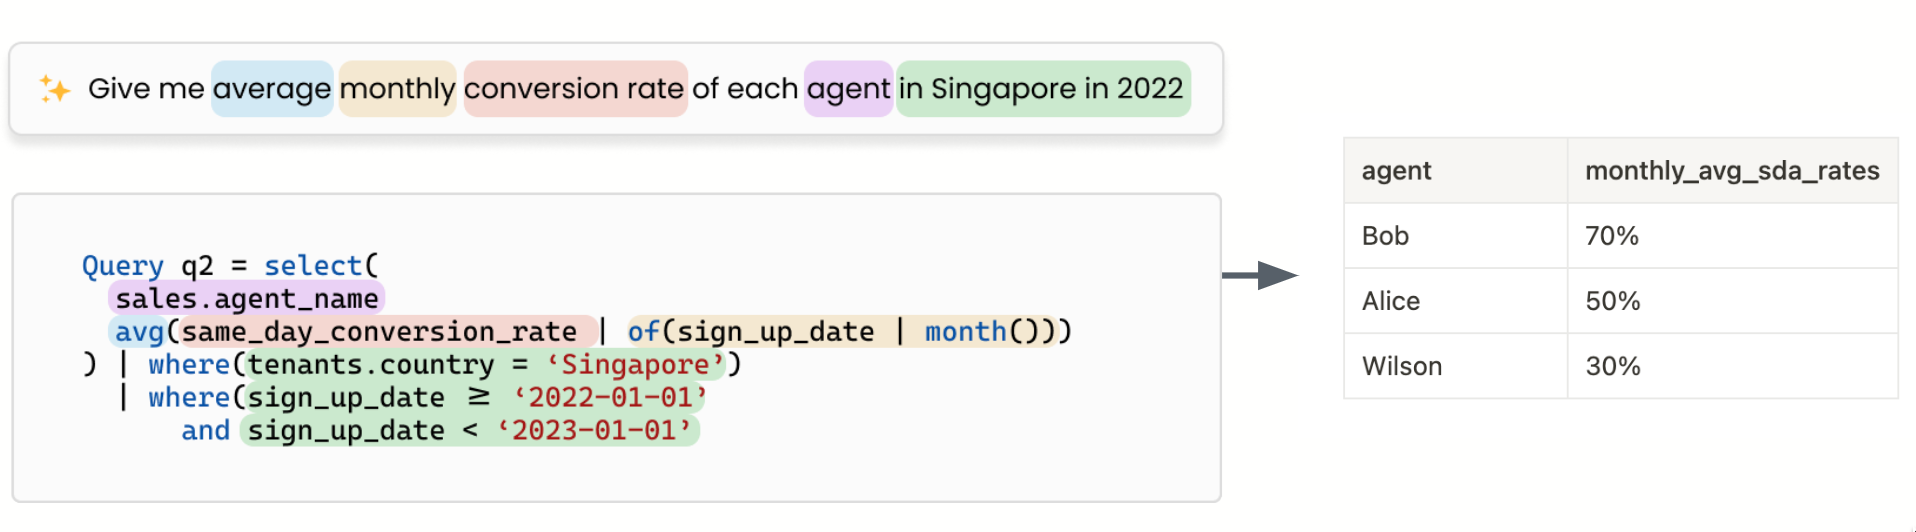
Not only it’s time saved for analysts, but also time saved for business users. You can easily build a UI on top of the metric for self-serve exploration.

or add a ChatGPT-like interface to let users enter questions in natural, conversational language.
When you have a semantic layer and a query system like this, you can encode all the constraints in that semantic layer and ratchet up ChatGPT’s reliability because generating output using this (made-up) query language is much easier than generating output using SQL.
(This is not Holistics by the way. Still a made-up example).
It might sound too good to be true - but envisioning the ideal state of a metrics-driven paradigm sheds light on the practical benefits a semantic layer can bring to data teams.
Now we just need to know what to look for.
Let’s go back to our central question: How Would The Ideal Semantic Layer Look Like?
The Ideal Semantic Layer
An ideal semantic layer, in our opinion, should have the following feature:
- Provides a higher level of abstraction than available with SQL, which saves effort, reduces errors, and enables self-serve interfaces.
- The metrics can be decoupled from dimensions, which can be provided during query time instead of hardcoded during development time.
- New metrics can be composed of existing ones - you build on metrics on top of each other.
- Should be join-aware to be able to work on multiple models instead of only one single model
And we’re not the only dreamer.
ThoughtSpot’s CTO - Amit Prakash also described 06 classes of metrics in an excellent blog post about the ideal design of a metrics layer - which include:
- Simple aggregation e.g. sum(revenue), avg(price), count(distinct users)
- Combined aggregation with scalar functions e.g. sum(revenue) - sum(cost)
- Metrics that require joins e.g. sum(sales.revenue * conversion_rates.exchange_rate)
- Metrics with window functions e.g. cumulative sum(sales. revenue) over weeks
- Metrics with multiple levels of details e.g. metrics with dynamic grouping
- Multi-fact metrics e.g. metrics that span fact tables without direct relationships
Some of these above metric classes are already available in prominent BI tools like PowerBI, Looker, Thoughtspot, and GoodData - which are also providing varied levels of capabilities but they are locked inside proprietary black boxes. This vendor lock-in problem can be circumvented with independent and open-source semantic layers - but again, they still have a lot of growing up to do.
At Holistics, we’re willing to make a bet that the semantic layer is part of the future for BI and analytics.
And the ideal one we described aspiringly - will completely reshape the analytics landscape as we know it. Though we’re still a long way from here, the beckoning future is an interesting one, and how we get there should be even more interesting.
–
This blog post is part of InnerJoin - which is Holistics’s newsletter about the contemporary practice of business intelligence. Join +15K data practitioners and get insightful think-pieces in your inbox every month.