Does anyone know how to visualise a moving average on Holistics charts.
In my dataset, I have a KPI per datetime. I want to group by month - year and do the sum which is straightforward but then have last 3 months average (of the summations).
Of course I could do it with SQL and a window function but I would prefer to avoid this.
We currently do not have support for visualizing moving averages. We will add your request to our backlog and notify you of any updates regarding this feature.
In the meantime, there are a couple of workarounds you could try:
Use our transform model to calculate the moving average.
Use our custom chart feature to draw the moving average. You can find more information on custom charts in our documentation here.
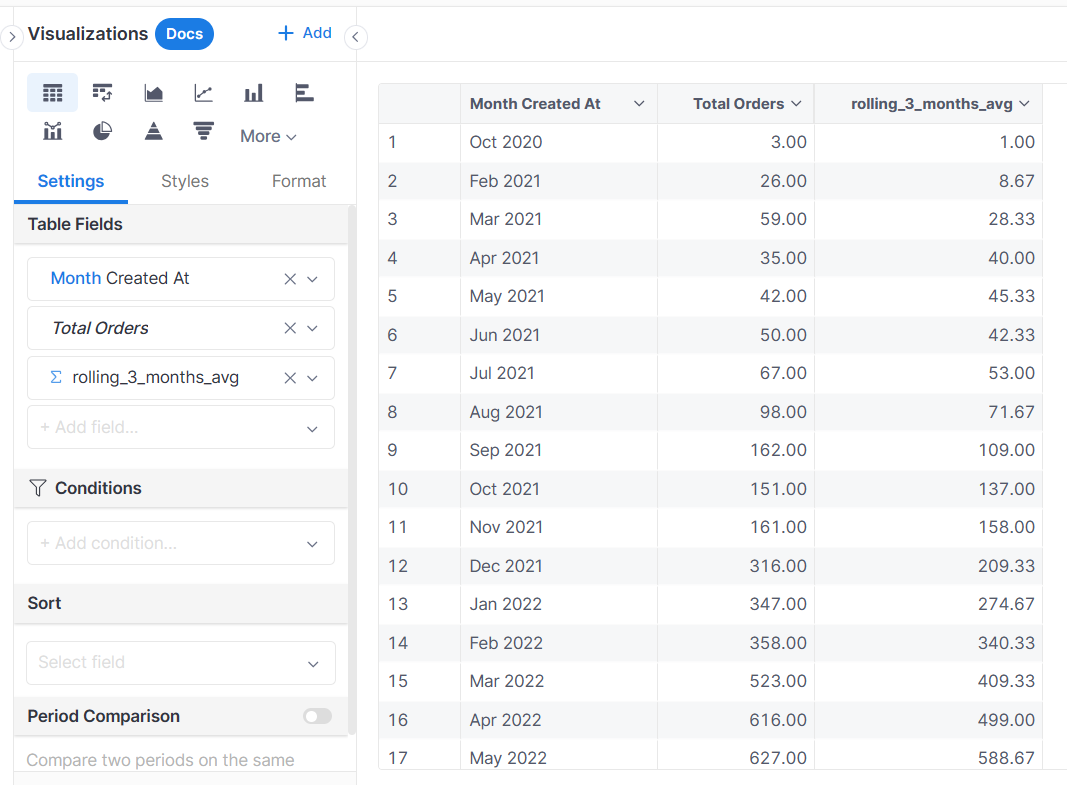
Basically, we have a function trailing_period() that calculates for a specific number of date periods up to the current period.
For example, you can apply this computation to determine the total orders you have in the last 3 months up until the current month, also known as Trailing 3 Months Metric.
We already have bunch of amazing features exclusively in the 4.0 such as as-code everything, canvas dashboard with themes, quick-and-easy analytic functions like percent of total and moving calculations,… and many more cool stuff to come!
We’d love to show you what our 4.0 can do in action Would you be interested in a 30-minute demo call? If yes, please input your preferred time here: Schedule a demo
You can also try out our simplified 4.0 version in our playground as well: Holistics Playground
We hope your monthly budget for BI tool would increase sometime soon, so we could have a chance to serve you and your team with our new amazing version!