Thursday, May 9, 2024
Hello hello, friends of Holistics, how’s everything going?
At Holistics, we’re all about making difficult things simple.
Want to add a period-over-period comparison? In other BI tools, you huff and puff with SQL to create custom parameters and filters for every YoY/WoW comparison. In Holistics, it takes just a few clicks. And we’re bringing this same simplicity to even more reporting features.
Draw a trend line? Just point-n-click. Set a reference line? Also point-n-click! This month’s updates are about making data exploration easier, smarter, and a whole lot faster.
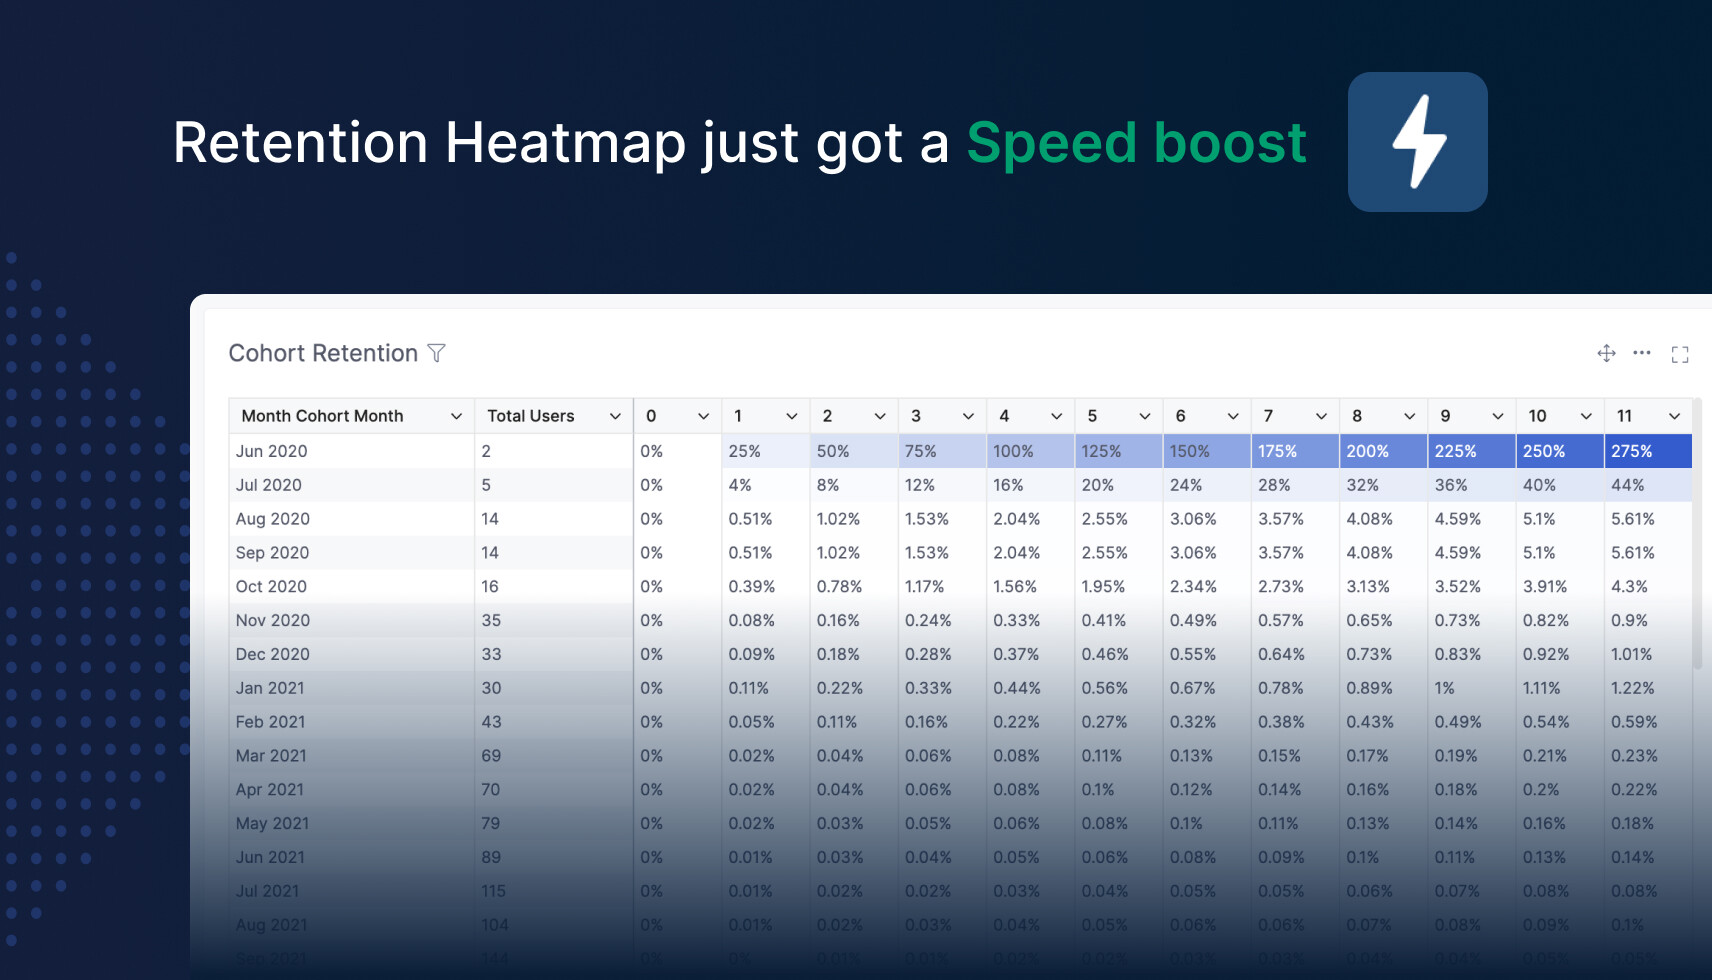
 x3 faster retention heatmap
Customers are churning, your org is bleeding money, and no one knows because no one can stand it when every spin of wheel feels like an eternity. Don’t you just hate that?
We know. This is why we just supercharged our Retention Heatmap to load 3x faster! Take it for a spin, and see how you enjoy our lightning-speed rows & columns!
 Trend lines
When exploring data, you want to know what’s hidden from plain sight, or what the future looks like. After all, they’re the bread and butter of data-informed decision-making, and they’re now much simpler to achieve with Holistics.
Now you can easily add trend lines in just a few clicks.
Whether it’s forecasting data patterns or identifying hidden trends, point-n-click is all it takes.
You can learn about this feature in our docs here: Public Docs Trend Lines
 Sharing canvas dashboards externally
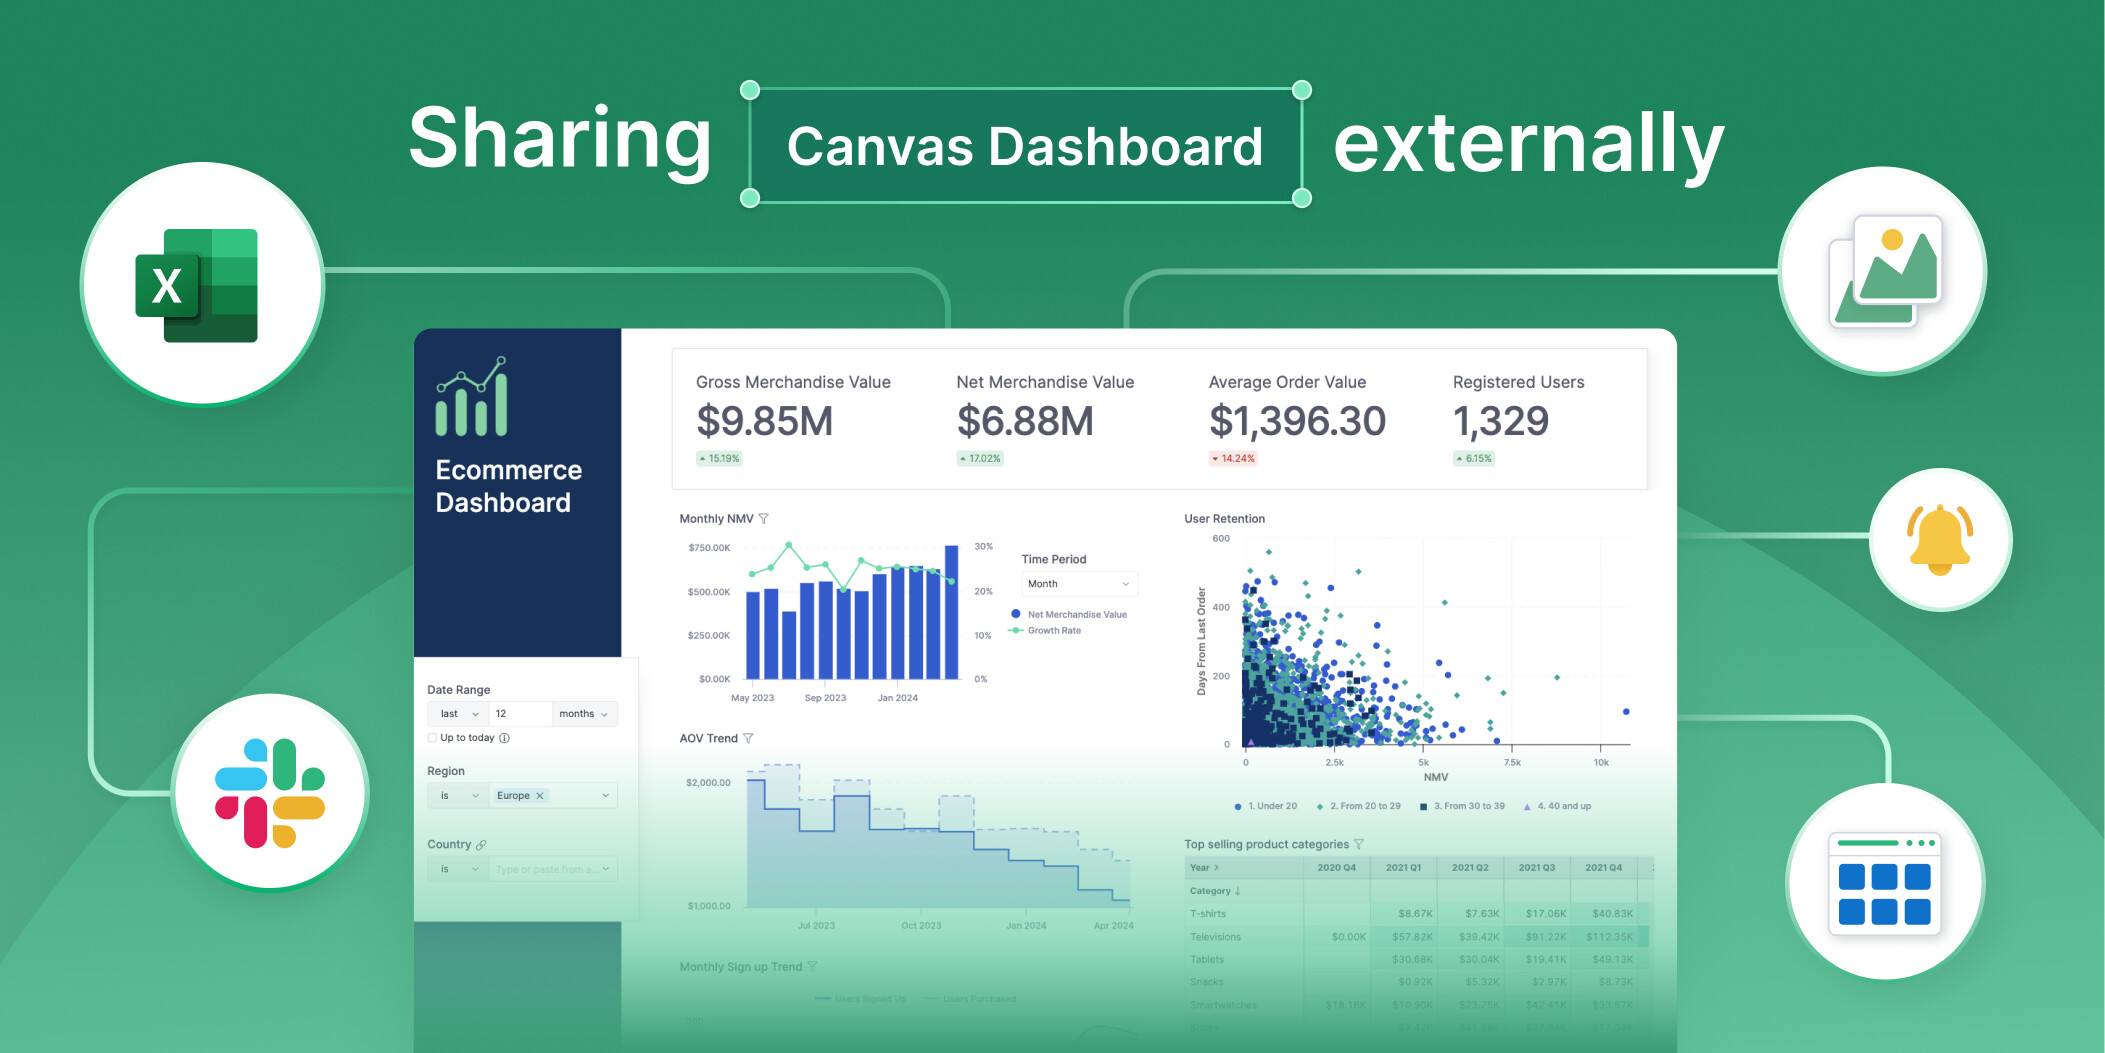
With Canvas Dashboard, you turn data into narratives. Now you can share them with the world - your favorite data delivery features are coming to Canvas Dashboard, including Export, Data Alerts, Sharable Links, and Embedded Analytics:
- Export: Download your dashboard as PNG, PDF, or Excel.
- Data Alerts: Send notifications to your team when certain conditions are met.
- Shareable links: Create and share customized, password-protected links.
- Embedded Analytics: Embed your stunning dashboard in your web apps.
![]() Canvas Dashboard is in Beta! To get access, register your interest here: Canvas Dashboard Early Interest Form
Canvas Dashboard is in Beta! To get access, register your interest here: Canvas Dashboard Early Interest Form
 Reference lines (coming soon)
You make a chart. Congrats, but you’re not done yet. You don’t simply get insights by eye-squinting and going off on vibes. The line is wiggling, but are you doing better, or are you doing worse?
This is where the Reference Line comes in.
In just 03 clicks, you can add a Reference line, and compare your data against a specific value (i.e.: the sales target), or a dynamic value (i.e.: average sales across all products).
 Custom Persistence DDL (Data Definition Language)
With our new Custom Persistence DDL feature, you can declare the custom_ddl for a Persistence, and customize how the persistence table is created in your Data Warehouse.
This allows you to apply Data Warehouse optimization features and techniques - such as indexing, clustering, applying SORTKEY, etc. - to improve the performance of your physically persisted tables!
Custom Persistence DDL is currently in Closed Beta. To join our Beta, kindly fill in this form.
Learn more at our docs here. If you have any feedback or questions, please share them on this Community Thread.
 Pre-filter dashboards by editing URL parameters (coming soon)
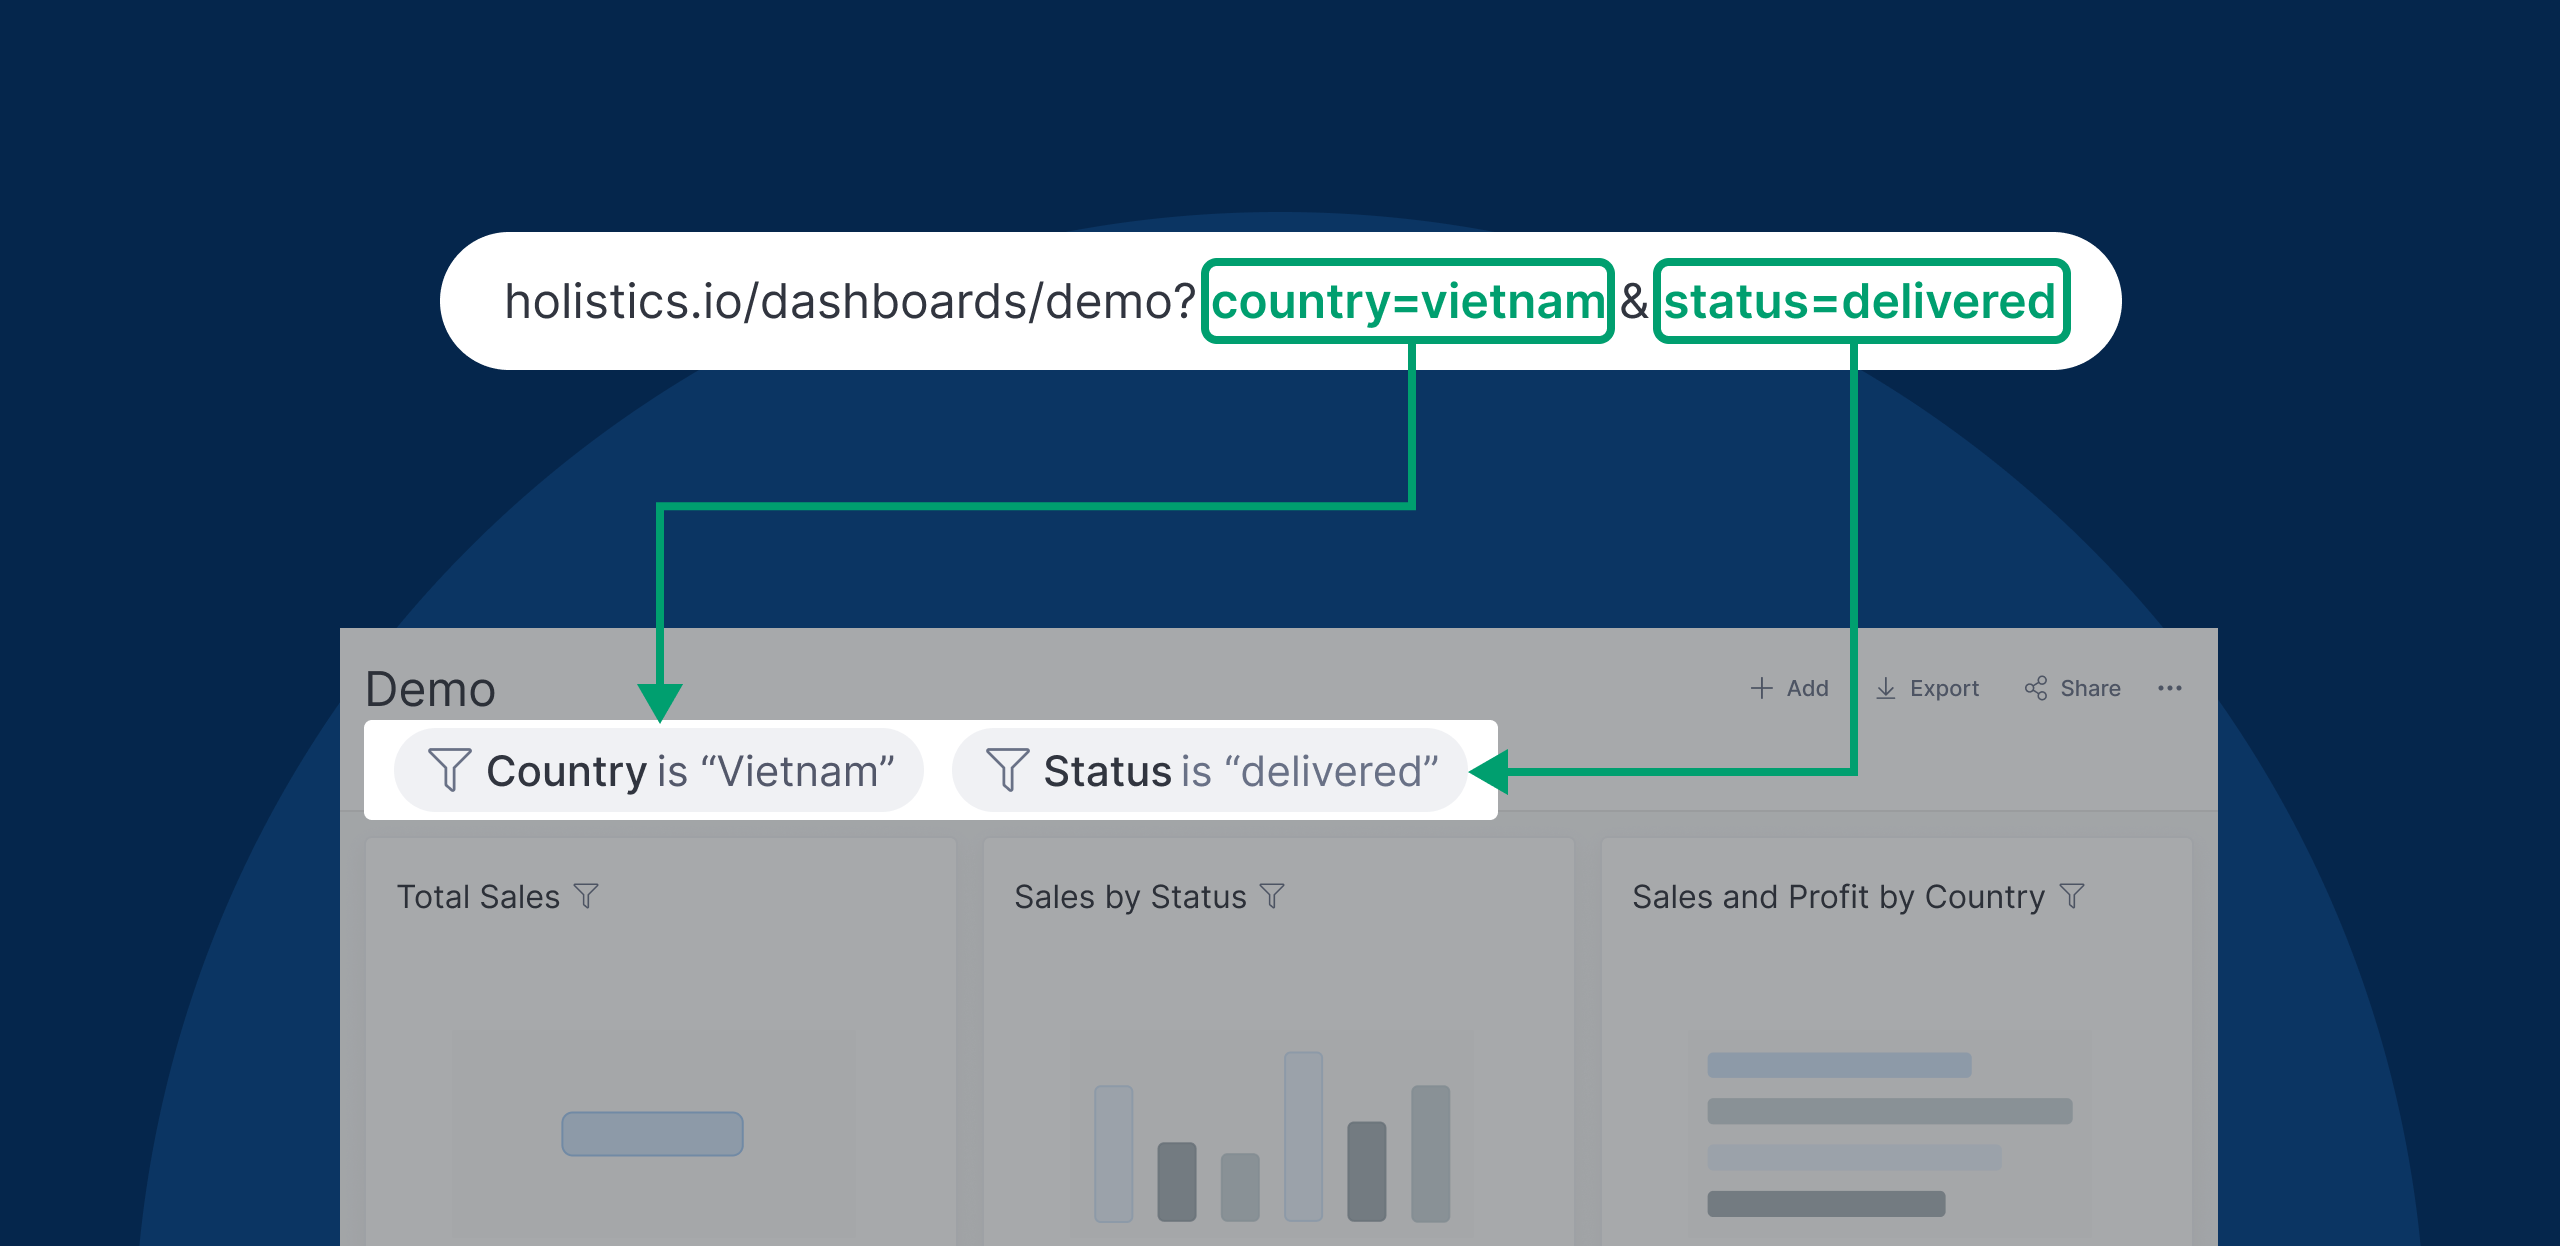
Soon you’ll be able to add filters to your dashboard, without needing to open it.
Just by editing the URL of your dashboard or widget, you can add interactive controls like filters, PoP, and Date Drills. When you load your dashboard, it’ll be filtered just the way you want it.
 Better Metrics Building Experience (coming soon)
Soon, you’ll be able to open the AQL metric editor right from the Reporting view. This allows you to quickly add new metrics, preview them, and use them right on the spot, without switching back and forth between different screens.
How convenient is that!
 New to Holistics? Join our regular training sessions (free)
If someone just invited you to Holistics, we offer regular live training sessions to help you put Holistics to the best use. Each training session is 60 minutes long, and there are various time slots to accommodate different time zones. And oh it’s completely free of charge.
Interested? Find a slot.
P/S: Not intrigued? Here’s what the audience has been saying! ![]()

 May UX updates
Like always, we jazz things up with a bunch of new UX improvements to make your day-to-day work with Holistics even more delightful.
Here are some UX updates highlights:
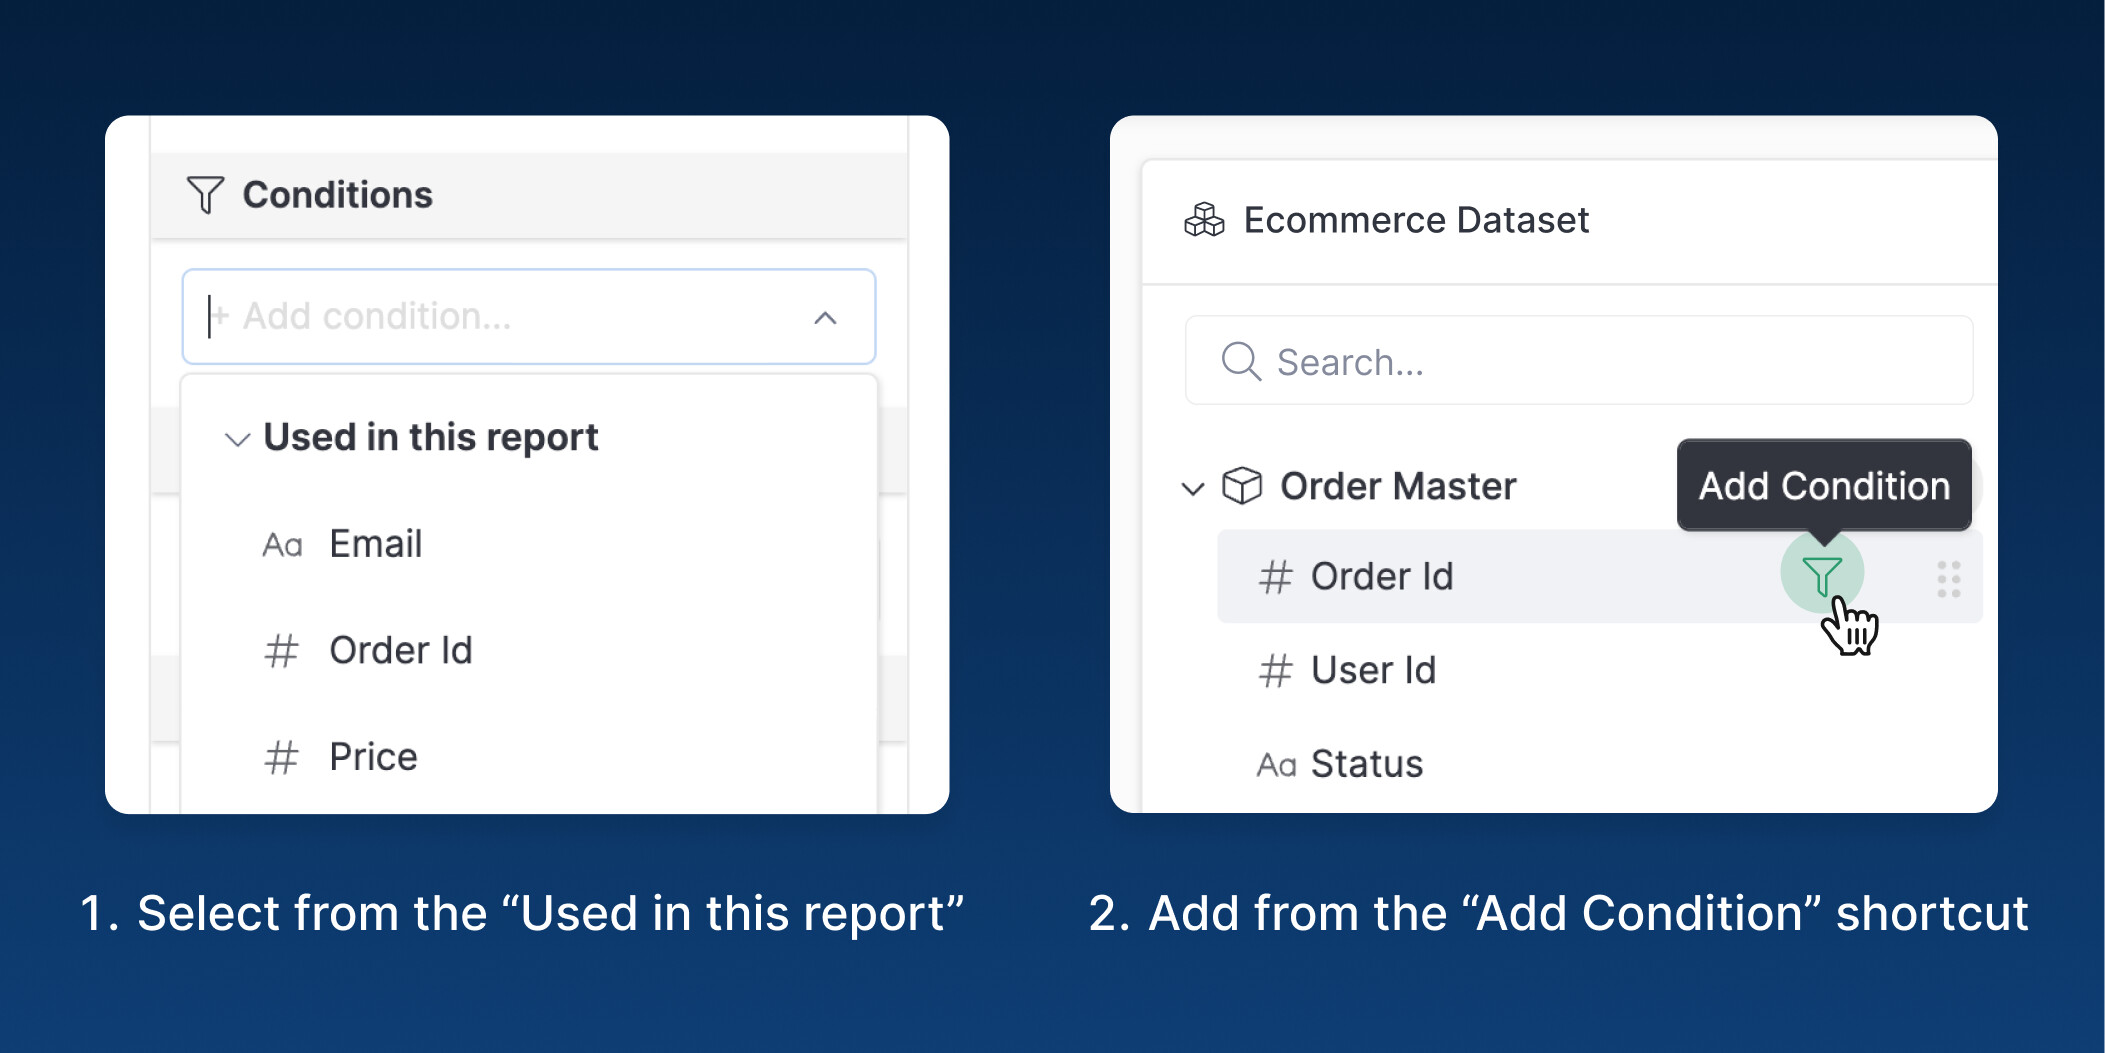
Adding a Condition when exploring is much easier thanks to:
- A new “Used in this report” section, containing selected fields for quicker selection.
- Or you can just click this shortcut & add directly from the field list.
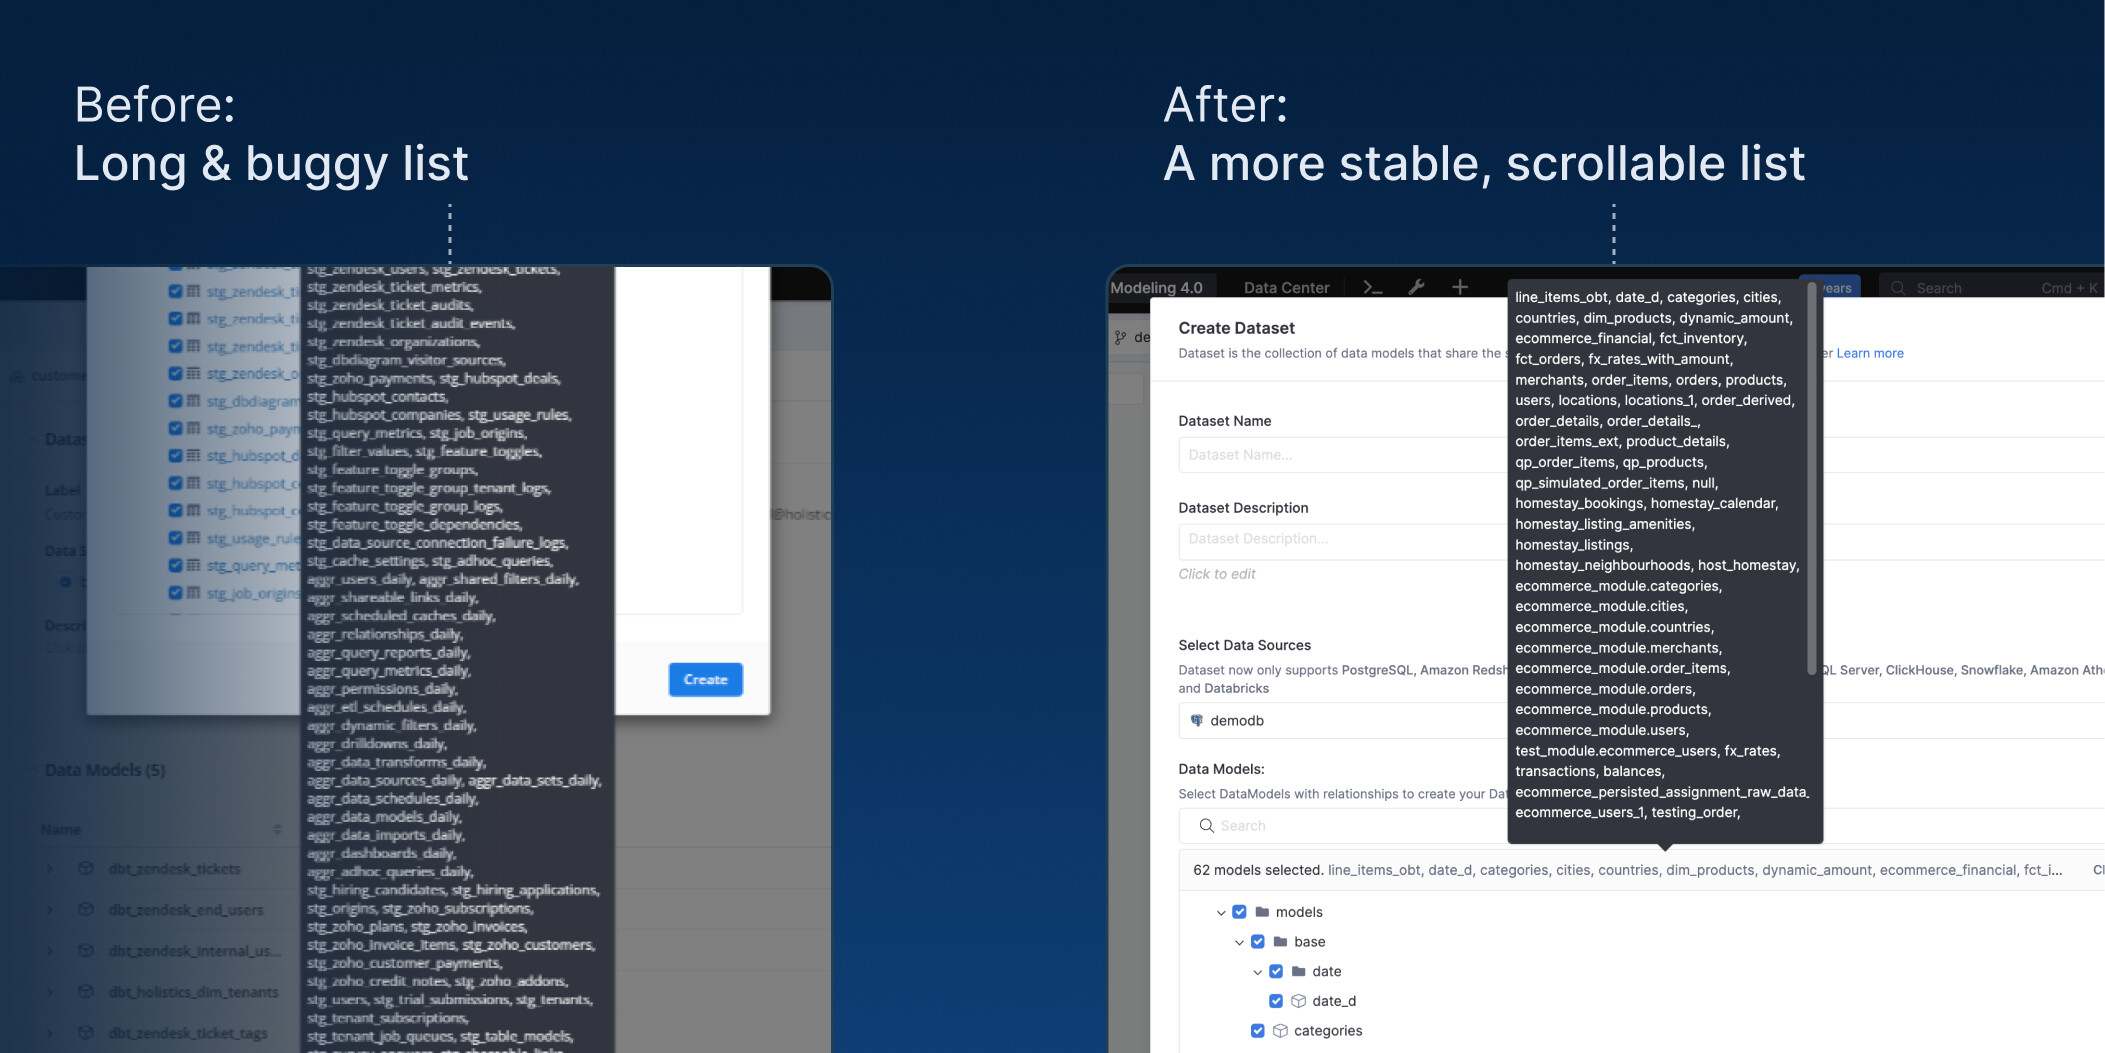
We improved this tooltip that shows selected Data Models when creating a new Dataset, making it less cluttered.
Check out our newest UX Update here: 2024 May UX Update.
Final words
That’s all for this month. If you’re curious about our upcoming direction, check out our Product Roadmap. If you’re interested in what we just released in the past few months, check out our Release Note.
I’ll see you again real soon!