January 23, 2026
Roughly ten years ago, on the night of November 9, 2016, my two co-founders and I were sitting frozen in a small Airbnb in San Francisco.
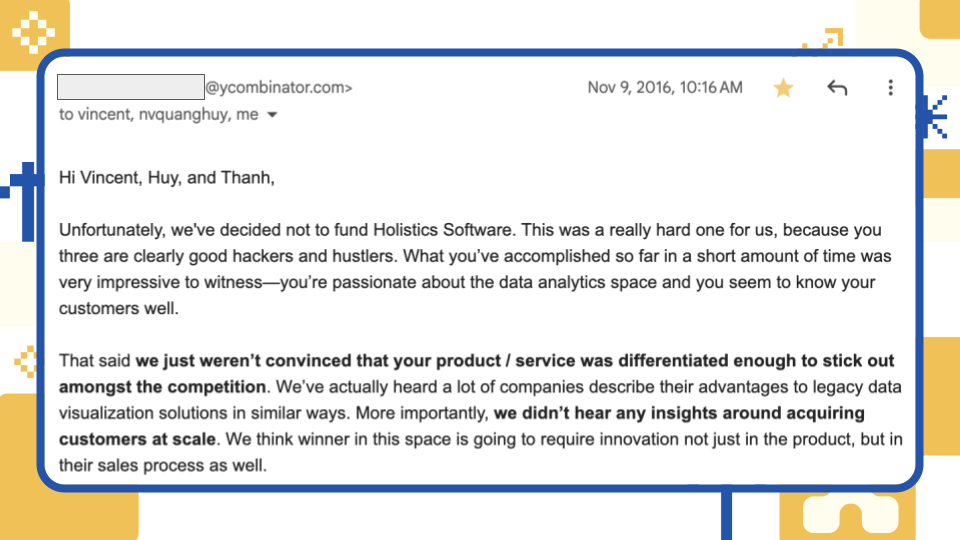
A few minutes earlier, an email had landed in our inboxes and completely redrawn the trajectory of our lives. We kept opening it, rereading it, closing it, opening it again, as if that could somehow make the words come out differently. Nobody had anything useful to say. The gooey silence clung to us and only let go when one of us looked up from his phone and said the 2016 election results were coming in. So we talked about politics, and nothing about the email. The next morning, we packed our bags and got on a plane home.
That email was a rejection from Y Combinator. I am leaving it here, in case you are curious.
We came to San Francisco earlier that year with unwavering confidence. We shipped fast. We knew our customers well. We were passionate. And at the time, we already had a handful of customers who were leading tech companies in Asia, namely Traveloka and Grab. We were convinced, in the way all young founders often are, that making it was inevitable. But the email was right about our acquisition strategy, and especially right about our differentiation at the time.
10 years went by in a blink.
We’re older now, and more confident in how Holistics differentiates. Staying bootstrapped has let us focus obsessively on customer outcomes. It’s also let us stay opinionated about what we believe self-serve analytics should be (now, what AI-native analytics should be). We’ve spent years building what we believe are the foundations, even when they weren’t fashionable: an intelligent semantic layer, an analytics-as-code workflow, and composable metrics –foundations that let us build what no one else can.
You might see that in this blog post, highlighting the best features we shipped in 2025. You might see some of it in this newsletter.
And if you don’t see it clearly enough, that’s on us, and we’re going to keep making the differentiation obvious, not just by saying it, but by shipping more of what we believe only Holistics can offer.
 Just Released
 Verify your AI answers
You’d ask a question and get a clean, confident number back. But something about it felt off. At that point, you had three options: trust it blindly, ask another analyst to confirm it, or go spelunking through tables and queries yourself until you could prove it. Every path burned time, and none of them made the answer any more explainable.
Now you can see exactly how AI arrived at its answer. With this feature, you can:
- See which tables and datasets the AI selected to answer your question, along with the reasoning for that selection
- Trace how the AI interpreted your question, what calculations it performed, and how it arrived at the final answer
- Review why specific data sources were chosen based on metadata, usage patterns, and admin endorsements
 Let your customers use AI to ask questions in natural language
Imagine that instead of waiting until the end of the year to see your Spotify Wrapped, you could just ask Spotify for your stats this week, or this month, and it instantly gives you a clean little bar chart showing your stress level, based entirely on the number of times you listened to Radiohead.
Now you can do the same thing for your product: Add an AI assistant inside your app, white-label it, and let customers get AI-powered answers to their questions using natural language, without leaving the workflow.
The AI only accesses the data each user is permitted to see, automatically respecting all row-level permissions you’ve configured.
See full demo here.
 Edit the same dashboard simultaneously without conflicts
Before, updating a dashboard together meant choreography: someone edits, someone waits, and everyone hopes they didn’t just overwrite an hour of work.
Now multiple people can work on the same dashboard at the same time. One person can update a chart while another adjusts the layout, and both changes are preserved automatically when you save.
See full demo here.
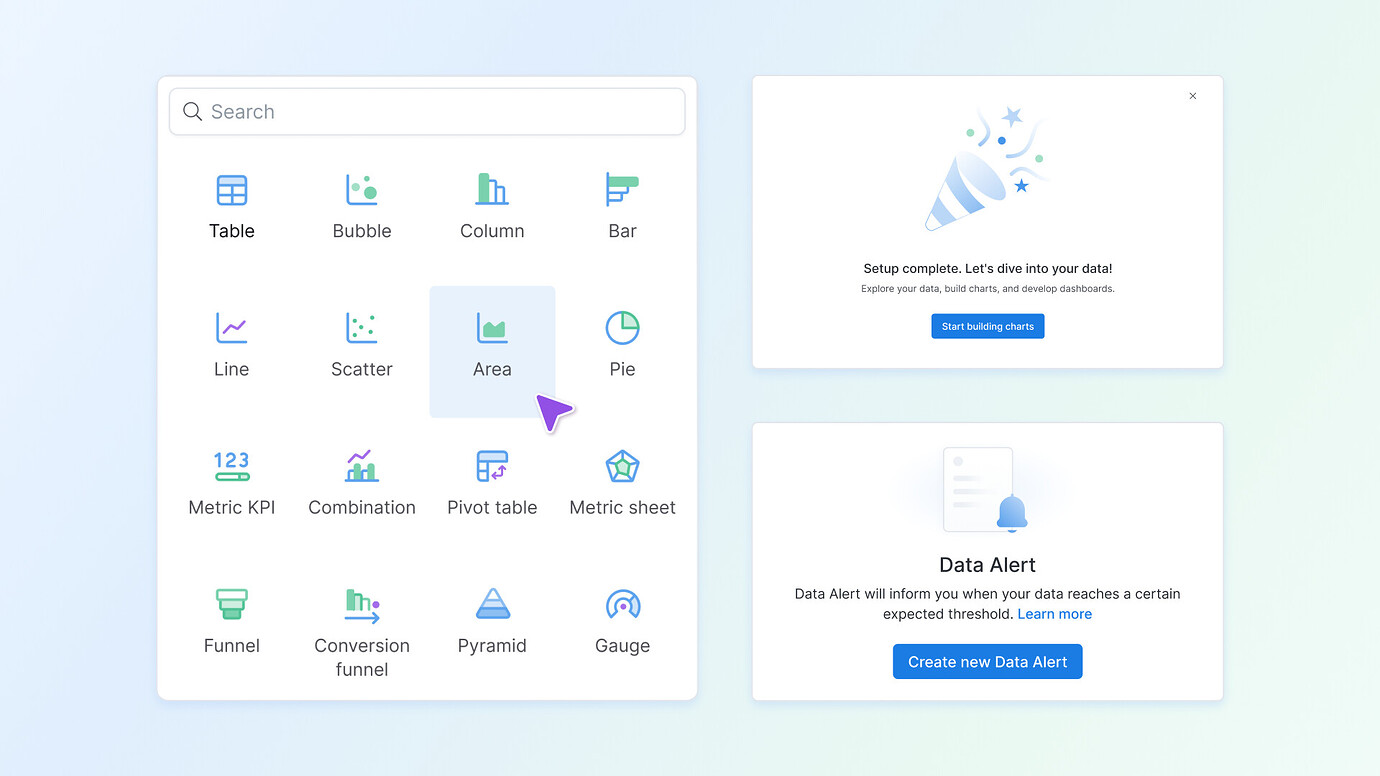
 Build charts faster with Auto Field Mapping
Drag-and-drop report builders (including Holistics) require you to go through a few steps: pick dimensions, pick measures, fill the right slots, and fix the chart when it breaks. You can quickly get used to it, but if you’re a first-time user, it’s pure cognitive tax. It’s like opening an IKEA box and being handed a hex key and a vague diagram before you’re allowed to sit down.
Auto Field Mapping removes that tax. Choose a visualization, click the fields you want, and Holistics automatically drops dimensions and metrics into the right places, so charts build themselves as fast as you can explore.
You can also swap data on the fly by clicking a new field to instantly replace an existing one when your chart is full.
See full demo here.
Quick Filtering
Data exploration should be as fast as your train of thought. With Quick Filtering, you can bypass the filter popover and right-click any element on your dashboard to instantly narrow your focus or remove distractions.
With this feature, you can:
- Easily include or exclude values: Right-click any dimension on an axis or legend to spotlight specific subsets or remove outliers that skew your results.
- Easily rank your data: Right-click a metric name to instantly apply Top N or Bottom N filters and see your highest or lowest performers.
- Easily benchmark against data points: Right-click any point on a chart to filter for values “greater than” or “less than” that specific result.
See full demo here.
 Reuse your best dashboard components across your entire workspace
The effort you put into one dashboard should benefit everyone. We’ve introduced a full operations suite for Canvas Dashboard, allowing you to move, duplicate, and sync your work across tabs and dashboards with total ease.
With this feature, you can:
- Copy and paste everything seamlessly across the same tab, between different tabs, or even across entirely different dashboards.
- Use familiar keyboard shortcuts like Cmd/Ctrl+C, V, X, and D to cut, copy, paste, and duplicate.
- Manage all objects at once, including individual blocks, groups of blocks, entire tabs, and full dashboards.
See full demo here.
Faster dashboard saving
Dashboard saving should never be a bottleneck that breaks your analytical flow. We’ve eliminated the lag and friction that used to follow heavy editing sessions.
With this feature, you can save complex changes instantly after deleting, resizing, or moving blocks across multiple tabs.
See full demo here.
Coming Soon
 Dynamic Content Blocks
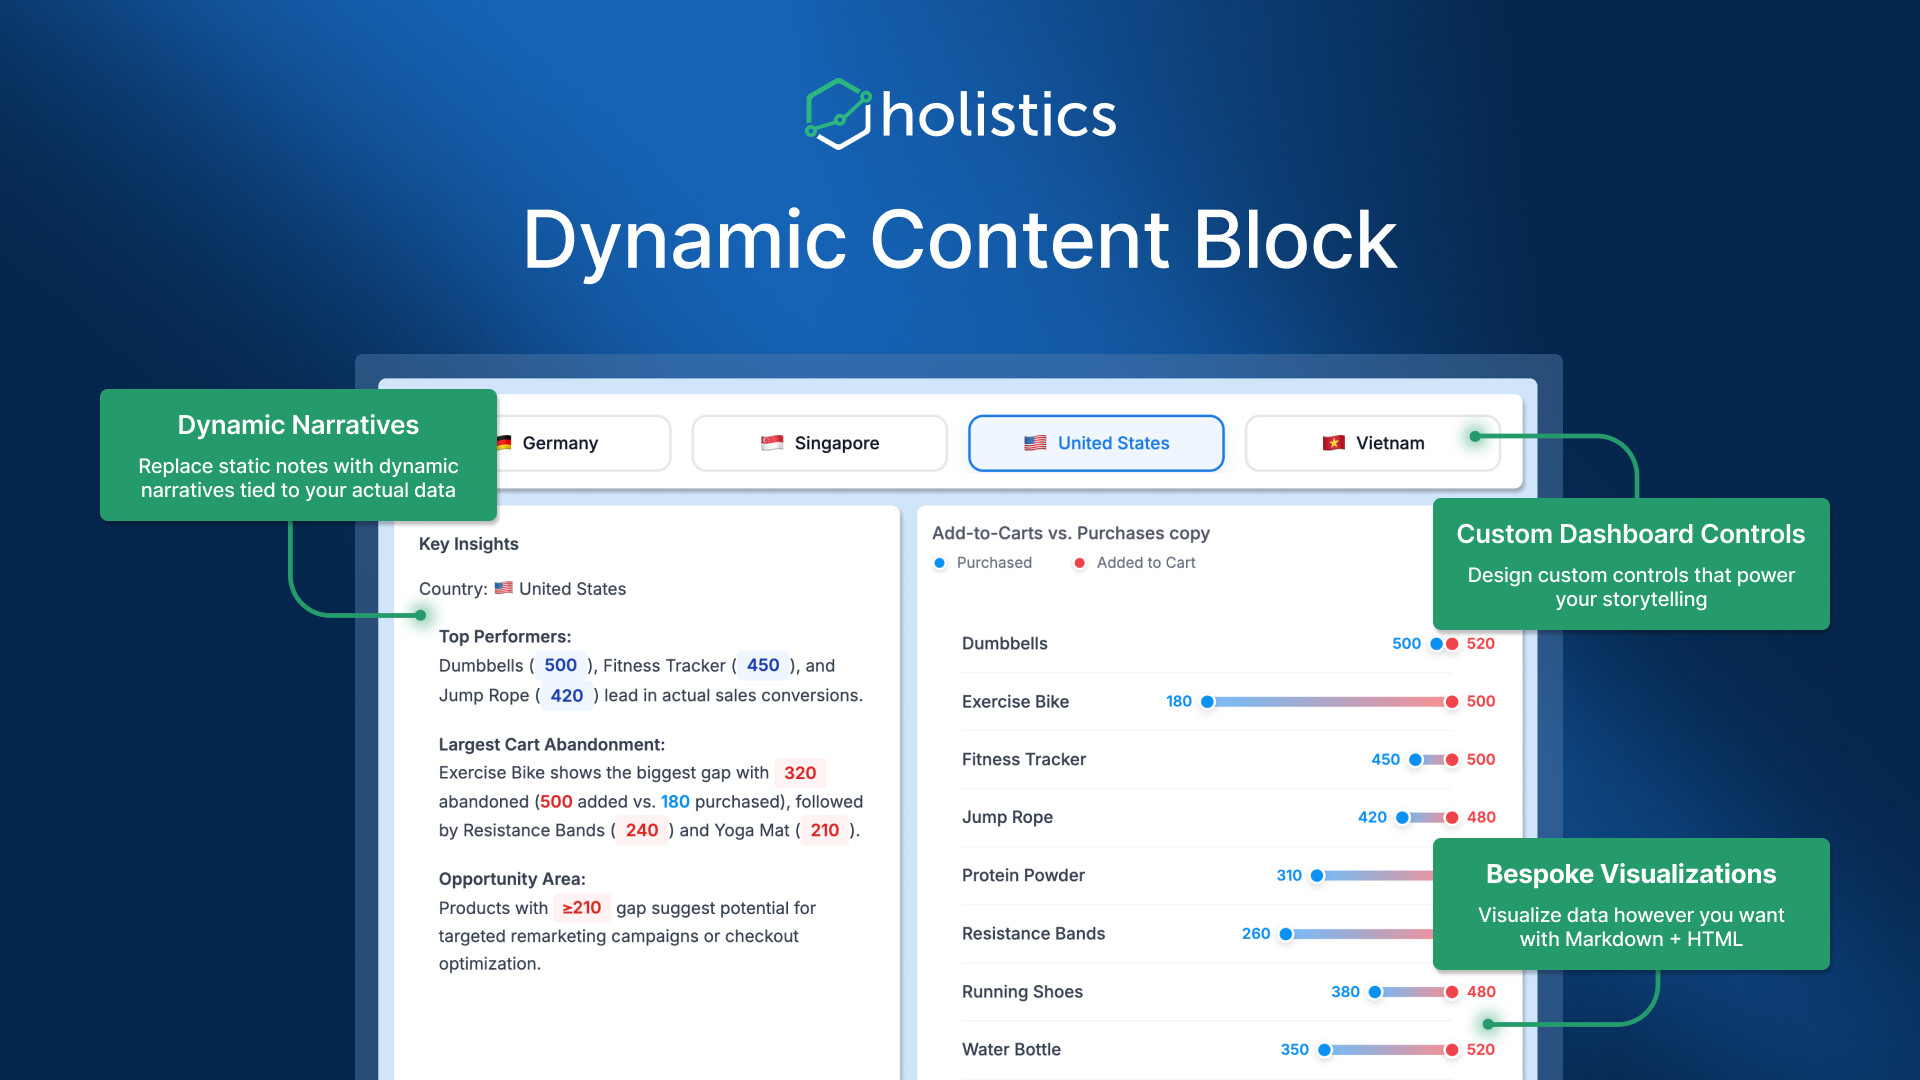
With the new Dynamic Content Block, you can combine HTML, CSS, and templating to build on-brand KPI callouts, executive briefs, or account cards where every value and label auto-refreshes with your data.
The cool thing about this feature is simple: you can drop these dynamic blocks directly into narrative reports, so the story updates itself. Instead of writing a weekly exec note and then manually replacing every number, you write it once and the values stay current (and extra fresh) as the data changes.
Read more about this feature here.
Holistics Referral Program: Share Holistics, Earn $500
Great tools are meant to be shared, and now you’ll get $500 when you do.
We’ve launched our referral program to reward customers who help spread the word about Holistics. If you know any friends who could benefit from a more intuitive analytics platform, send them our way. We’d be grateful for your recommendation. When someone you refer subscribes to Holistics, we’ll send you $500 as a token of our appreciation. ![]()
Learn more about our referral program.

January UX Updates (new year, new us  )
)
New icons and illustrations
You might notice Holistics looks a bit fresher. We’ve rolled out a new set of icons and illustrations across the app. This visual revamp gives the interface a more modern and cohesive look. The changes are subtle yet improve overall consistency and delight in the UI. Keep an eye out for the new graphics and let us know what you think!
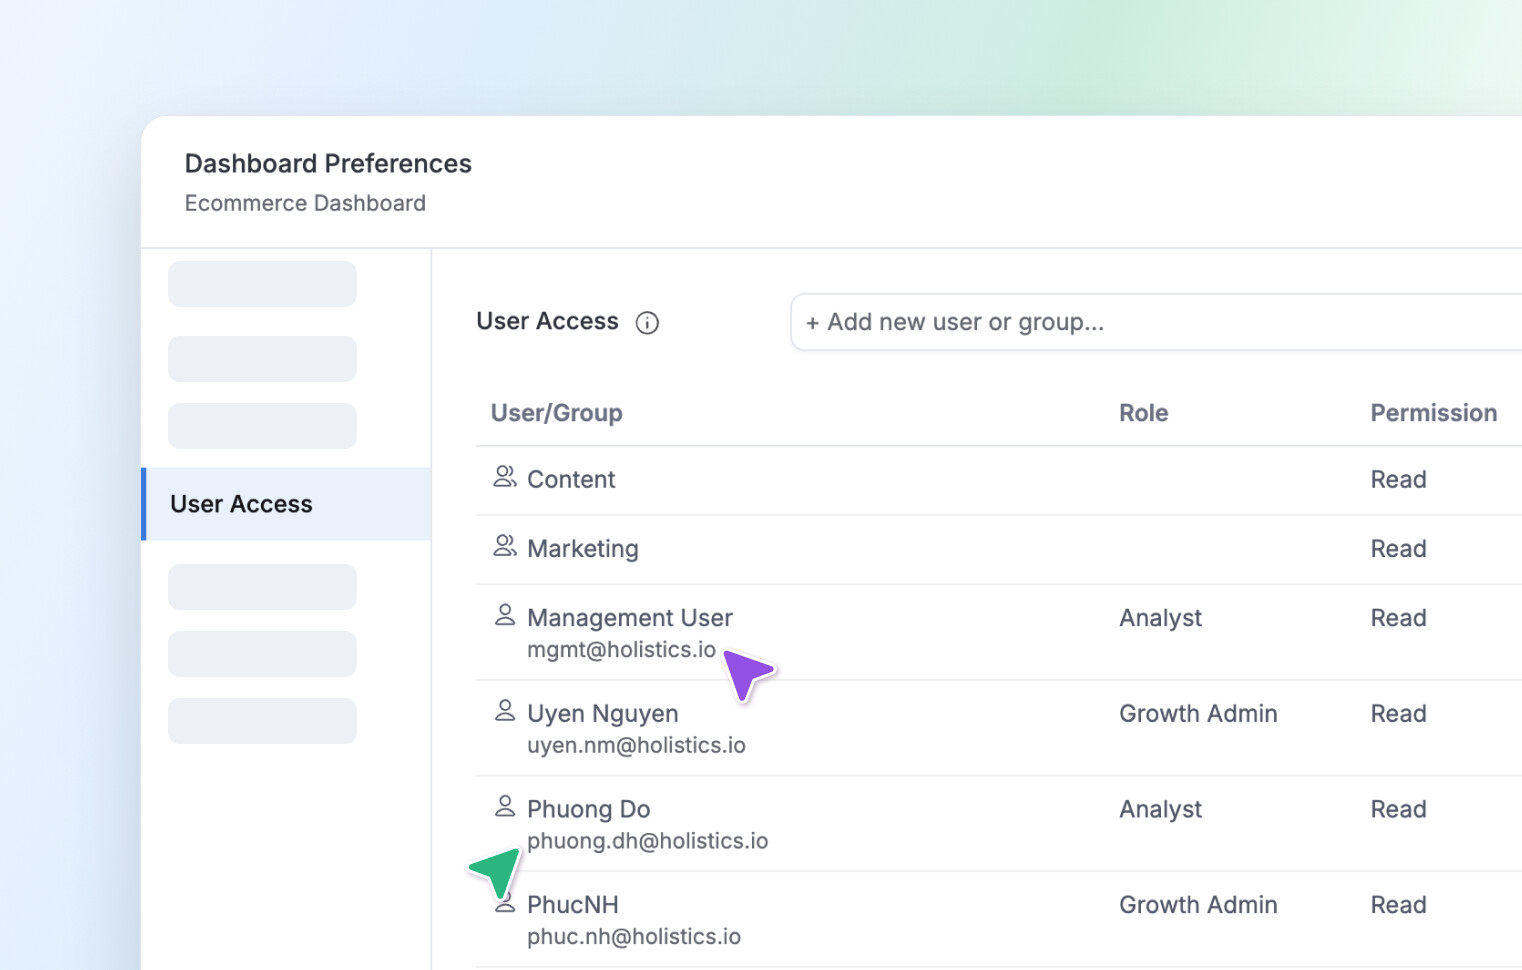
User Access modal
In the User Access modal, you will now see the user’s email displayed under their name. This helps you double-check you’re sharing with the correct person.
Development
- We fixed a minor UI issue where the context menu in the data model’s list view was misaligned.
- When a report contains a library block, we’ve added an indicator to explain that the library block can only be edited in Development mode & help you navigate more quickly.
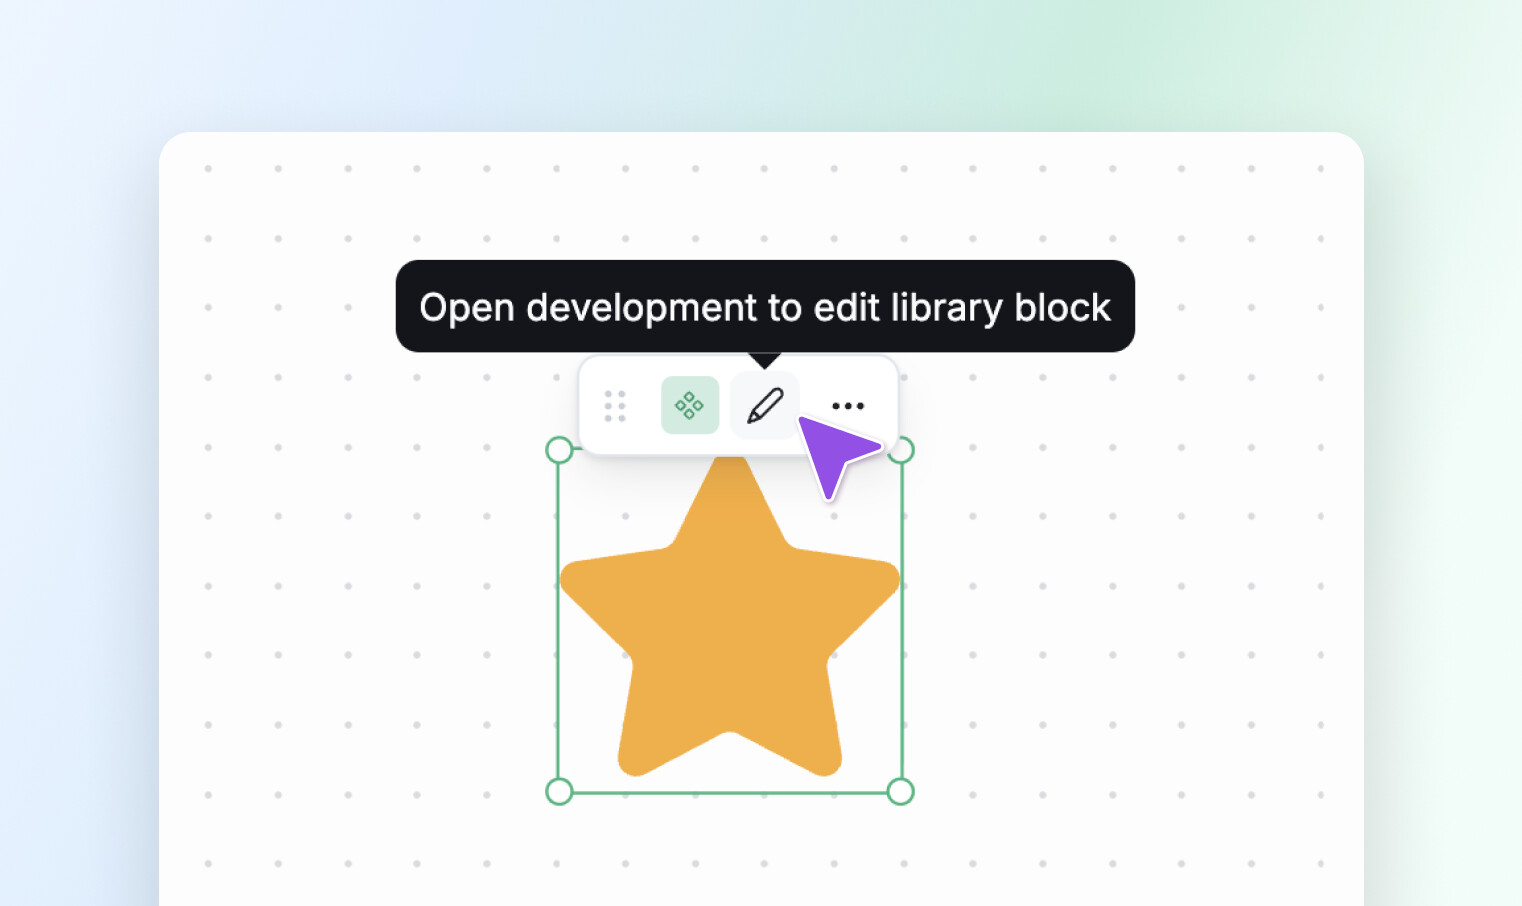
That’s it for this month! A few small changes, we hope, that make a lasting difference for good. Your feedback and suggestions keep us moving forward, so stay tuned as more updates and improvements are on the way!