We understand that things are getting tougher and tougher during this pandemic but we will not wave the white flag right now. We will keep moving forward and ship wonderful features to our beloved customers.
Just remember that we are always by your side and thank you so much for standing on ours too. We wish you all the best.
Now comes last month’s updates!
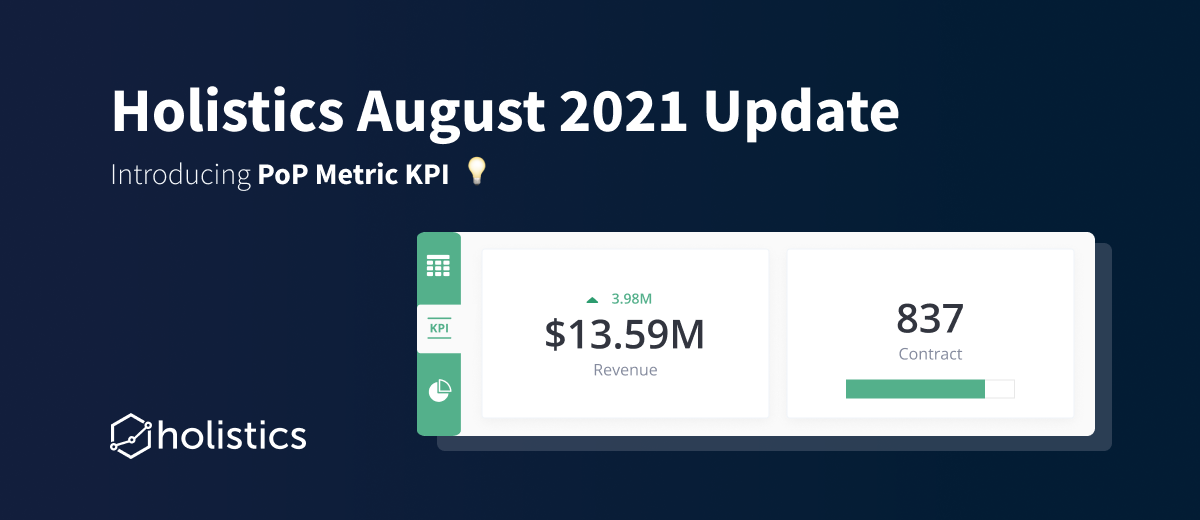
Period-over-Period Comparison for Metric KPI
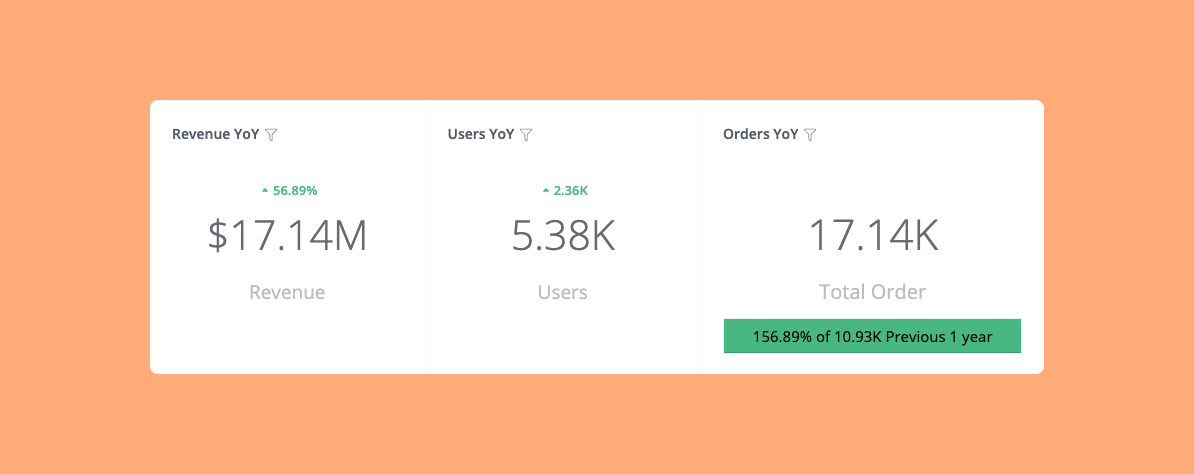
Now you can easily compare a Metric from two different time periods like comparing Revenue year-over-year. For more information about the Period-over-Period Comparison feature, please refer to this doc.
Deprecate importing data from non-SQL sources
A friendly reminder that we’ll stop providing technical support for importing data from Google Analytics , Facebook Ads , and Pipedrive from December 2021. It’s hard for us to make this decision but we want to focus our effort on delivering a better self-service BI experience for our users. What this means is:
- If you are NOT actively using Holistics to import data from Google Analytics, Facebook Ads, and Pipedrive, you will stop seeing these sources in Holistics. This change will not impact you.
- After December 2021, if you are still using this functionality, we’ll only help you fix bugs of the current connector. Upgrading the new version will be de-prioritized. Therefore, we highly recommend you switching to alternative solutions such as Fivetran, StitchData, or Airbyte before December 2021 to ensure your workflow is not impacted due to outdatedness.
Please refer to the official announcement for more information.
Upcoming
- Analytics As Code
- Git Integration
- dbt Integration
- Multiple sorting
- Date drill on the dashboard
Holistics tip: How to change time granularity on report
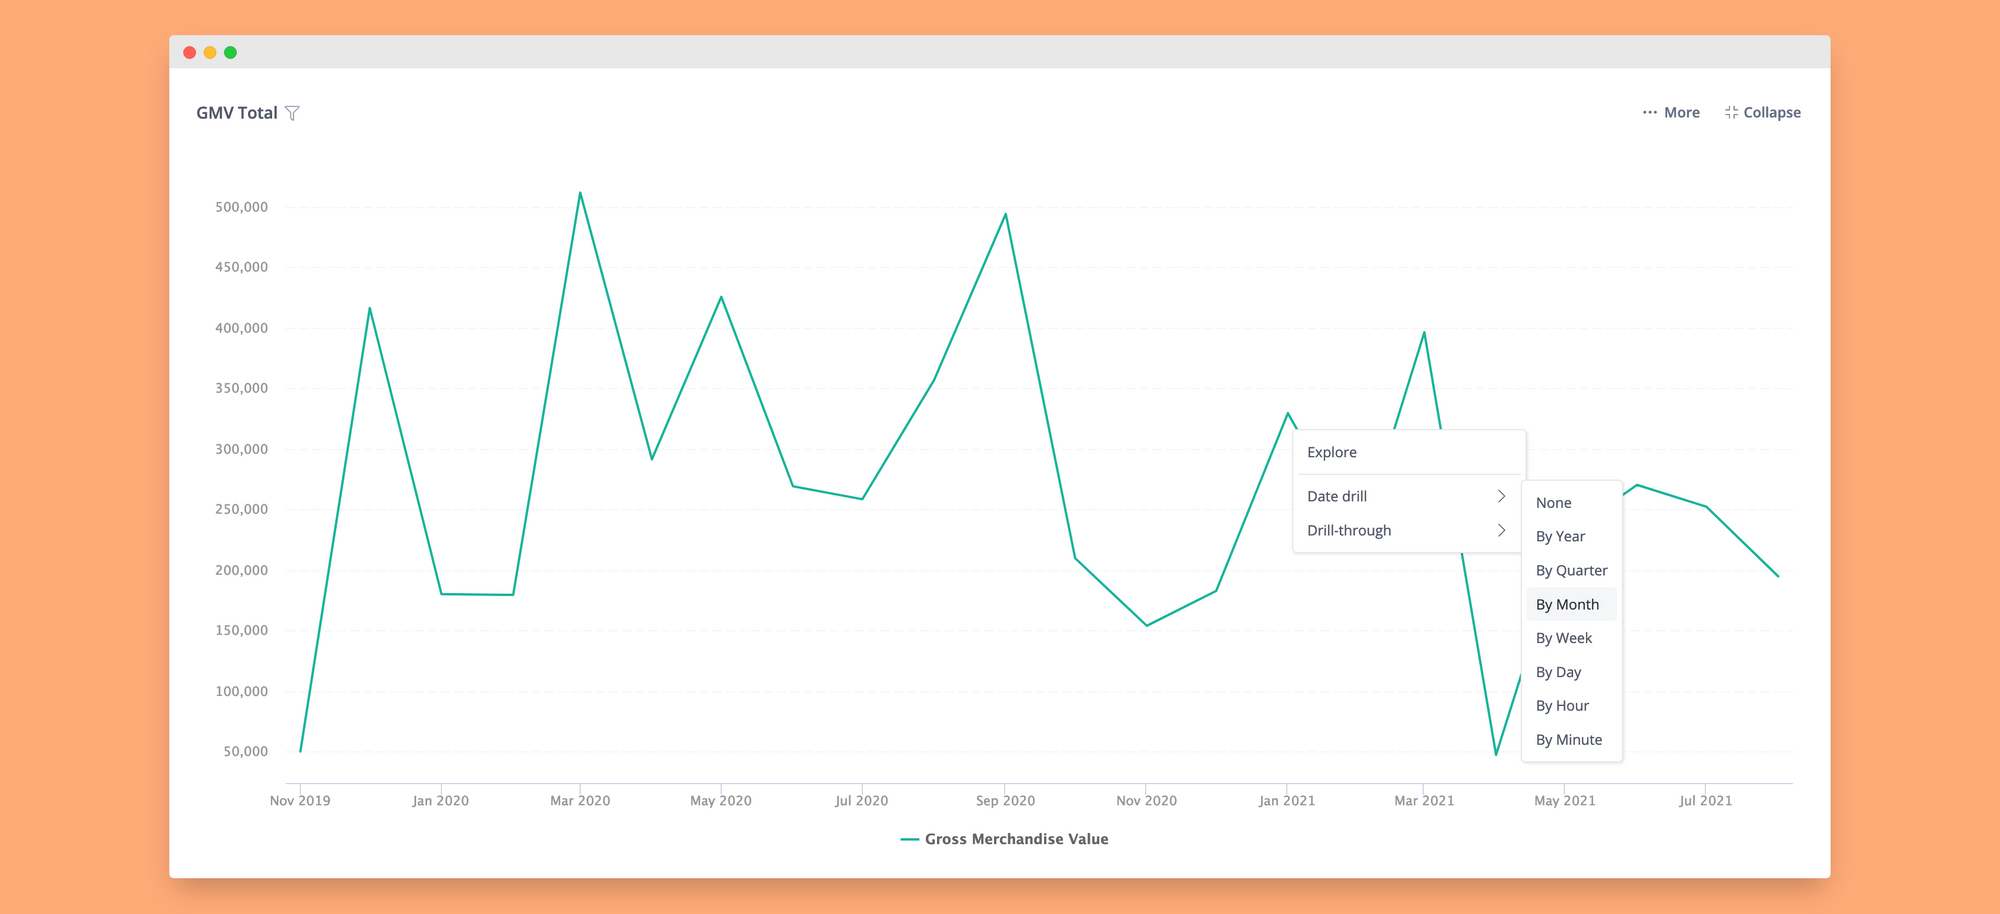
You prepared a revenue by quarter report for your boss, but he/she also wants to view the revenue change by day or by week. What should you do?
You can prepare two more reports, one for day and one for week. But a quicker solution would be to tell your boss to right-click on the chart and select Date drill > day/week.
Note: Date drill can only be used in line/bar/column chart.
Data joke
There are two kinds of people in the world:
- Those who can extrapolate from incomplete data sets.
That’s all for this month. Stay safe everyone, see you next month!