A number of my reports use the ‘Comparison Values’ feature and/or the Period-over-Period Comparison.
This works well, and shows up on my dashboard.
However, exporting this dashboard always strips out the comparatives. I’ve tried this with both Email PDF and Slack.
I’ve checked the documentation, and there’s no mention of this behaviour.
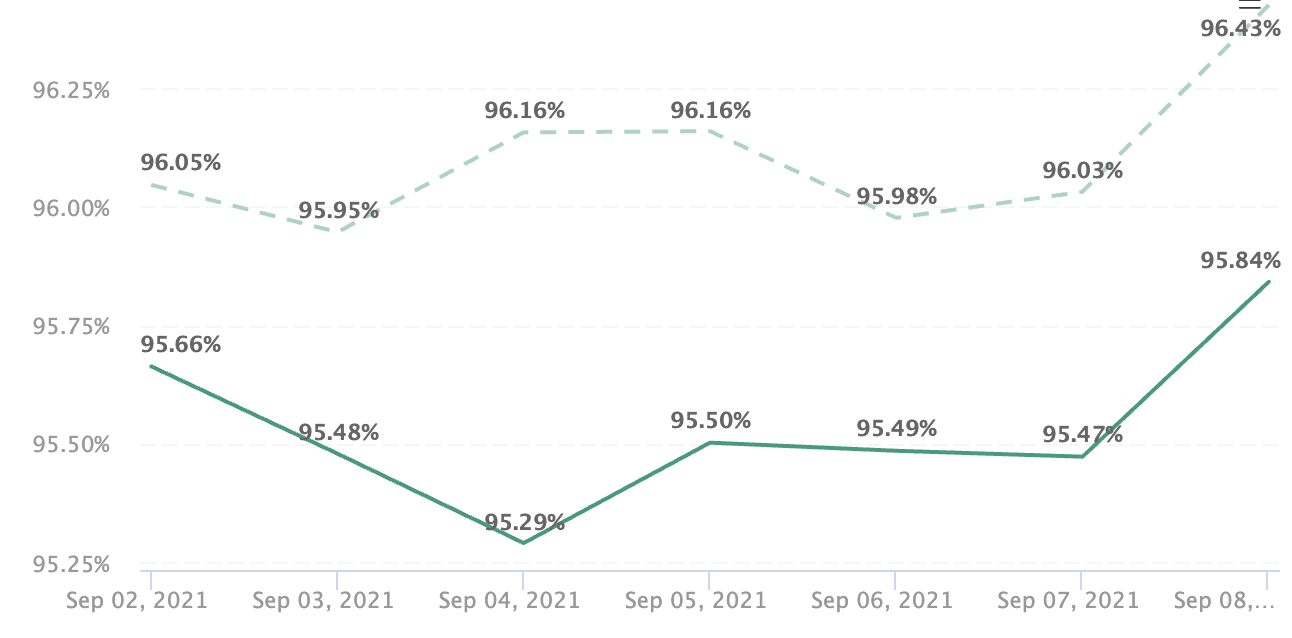
Web Dashboard Examples
Line Chart
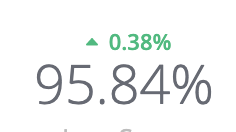
KPI
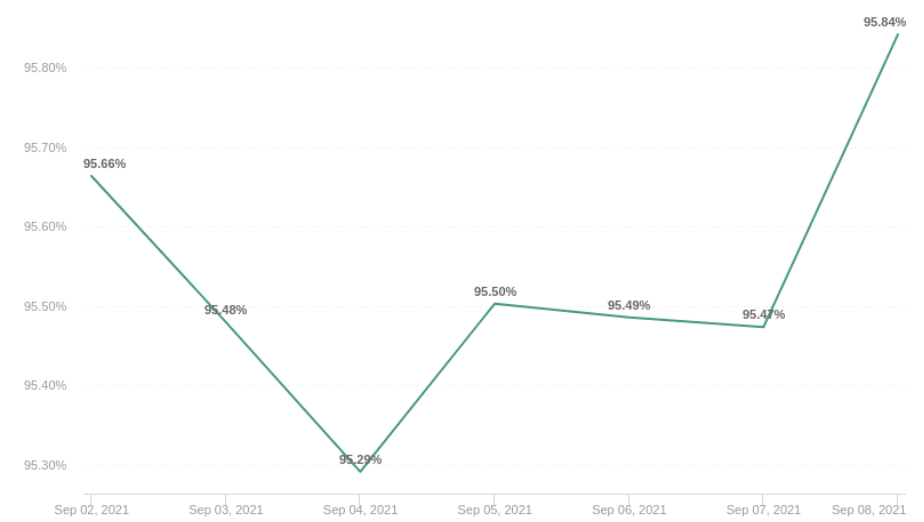
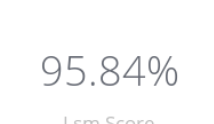
Slack/PDF Versions
Line Chart
KPI
Related Question
The documentation linked to above states that you can schedule Slack delivery on individual reports, rather than the full dashboard. But I can’t seem to find that option - am I looking correctly?