Currently, for Point Maps, it seems that the tooltips can only display the Legend value. It would be great if we could append other fields from the data into the tooltip, so that users can see more information about each point in the map when hovering over them.
Hi @DJ_SLeezy nice to e-meet you ![]()
To help us understand your case better, could you please provide us with additional details? For example:
- What does your current point map look like?
- Which field do you want to add to the tooltip?
Hello @di.hoang!
My Point Map currently has a Detection Category field that I have set in the Legend setting, so that each point shows the Detection Category when a user hovers over it:
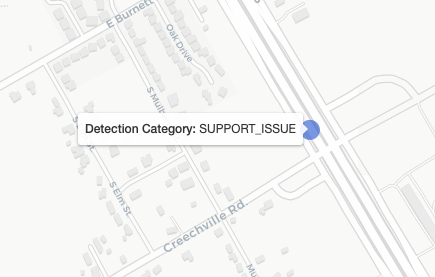
However, my Dataset has many more fields that I would be interested in showing the user for each point - the Date on which the Detection occurred, for example. Many of these fields are not numerical, so using the point size and color are not natural ways to help users explore their spatial patterns.
1 Like
Hi @DJ_SLeezy sorry for our late reply.
As far as I understand, you would like to customize the tooltip displayed to offer users more context. Please correct me if I misunderstood anything.
In this scenario, due to our current focus on delivering a full as-code product, this customization isn’t supported, and we may not have plans to support it this year. However, we understand that it would be a great feature, assisting users in their data exploration. Rest assured, we’ll add this request to our backlog for future implementation.
We really appreciate your patience and understanding during this time ![]()
1 Like
Thanks for the update!!
Hi @DJ_SLeezy
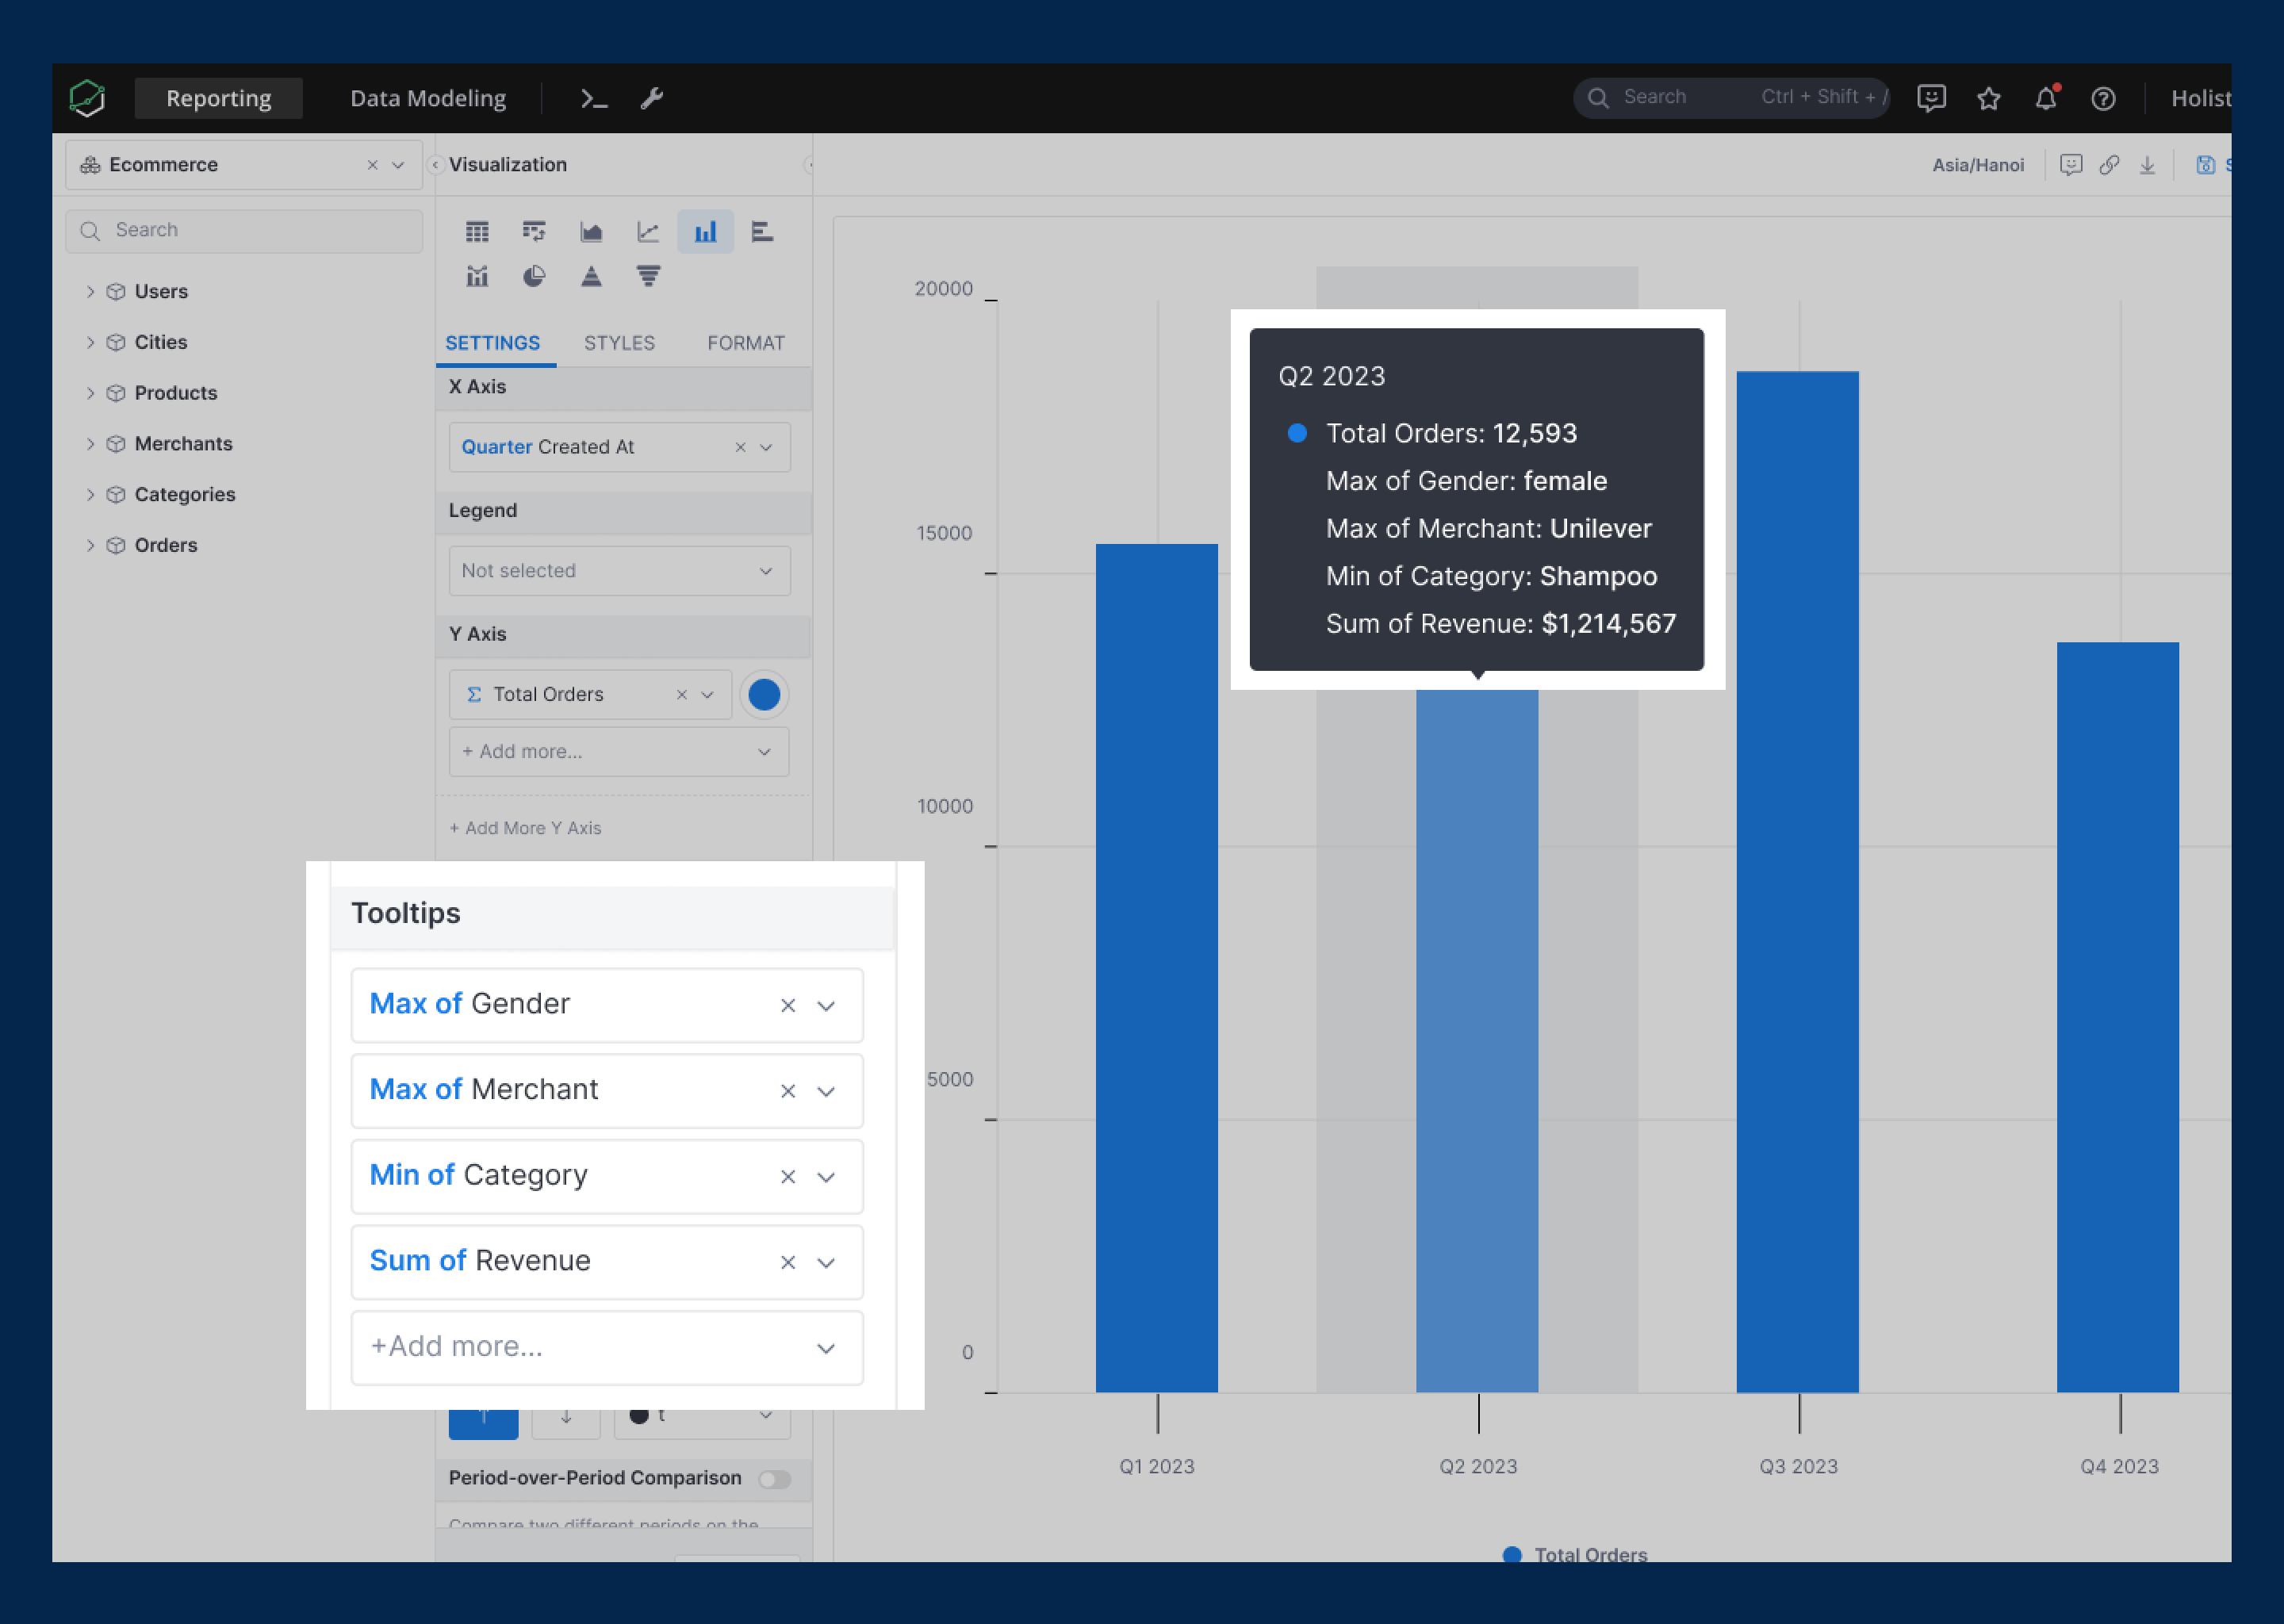
We are glad to share that our team is actively working on the Customizable Tooltip feature, and expect to release it in the next 2 weeks.
This function will allow you to add extra fields to tooltips, enhancing the information available to viewers. Additionally, we support the Min/Max aggregation for dimensions, enabling effective text value return.
Would you mind checking if it could address your issue? ![]()
Wow, this is great! Looking forward to trying this out in a couple weeks, thanks @di.hoang !
1 Like
Hi @DJ_SLeezy,
We’re glad to share that our Customizable Tooltips feature was released yesterday ![]() For more information, you could visit our public doc here: Customizing Chart’s Tooltips
For more information, you could visit our public doc here: Customizing Chart’s Tooltips
Please note that this feature is currently available for the following charts:
- Line, Column, Bar, and Area Chart
- Filled Map, Point Map
- Scatter, Bubble, Pie, Funnel, and Pyramid Chart (coming soon)
If you have any questions or need further assistance, feel free to let us know ![]()