Self-explanatory — sorting alphabetically basically is random noise. Would love to have more control over the ordering so that we can guide data viewers to the most important signals.
Hi @Jake_Powell,
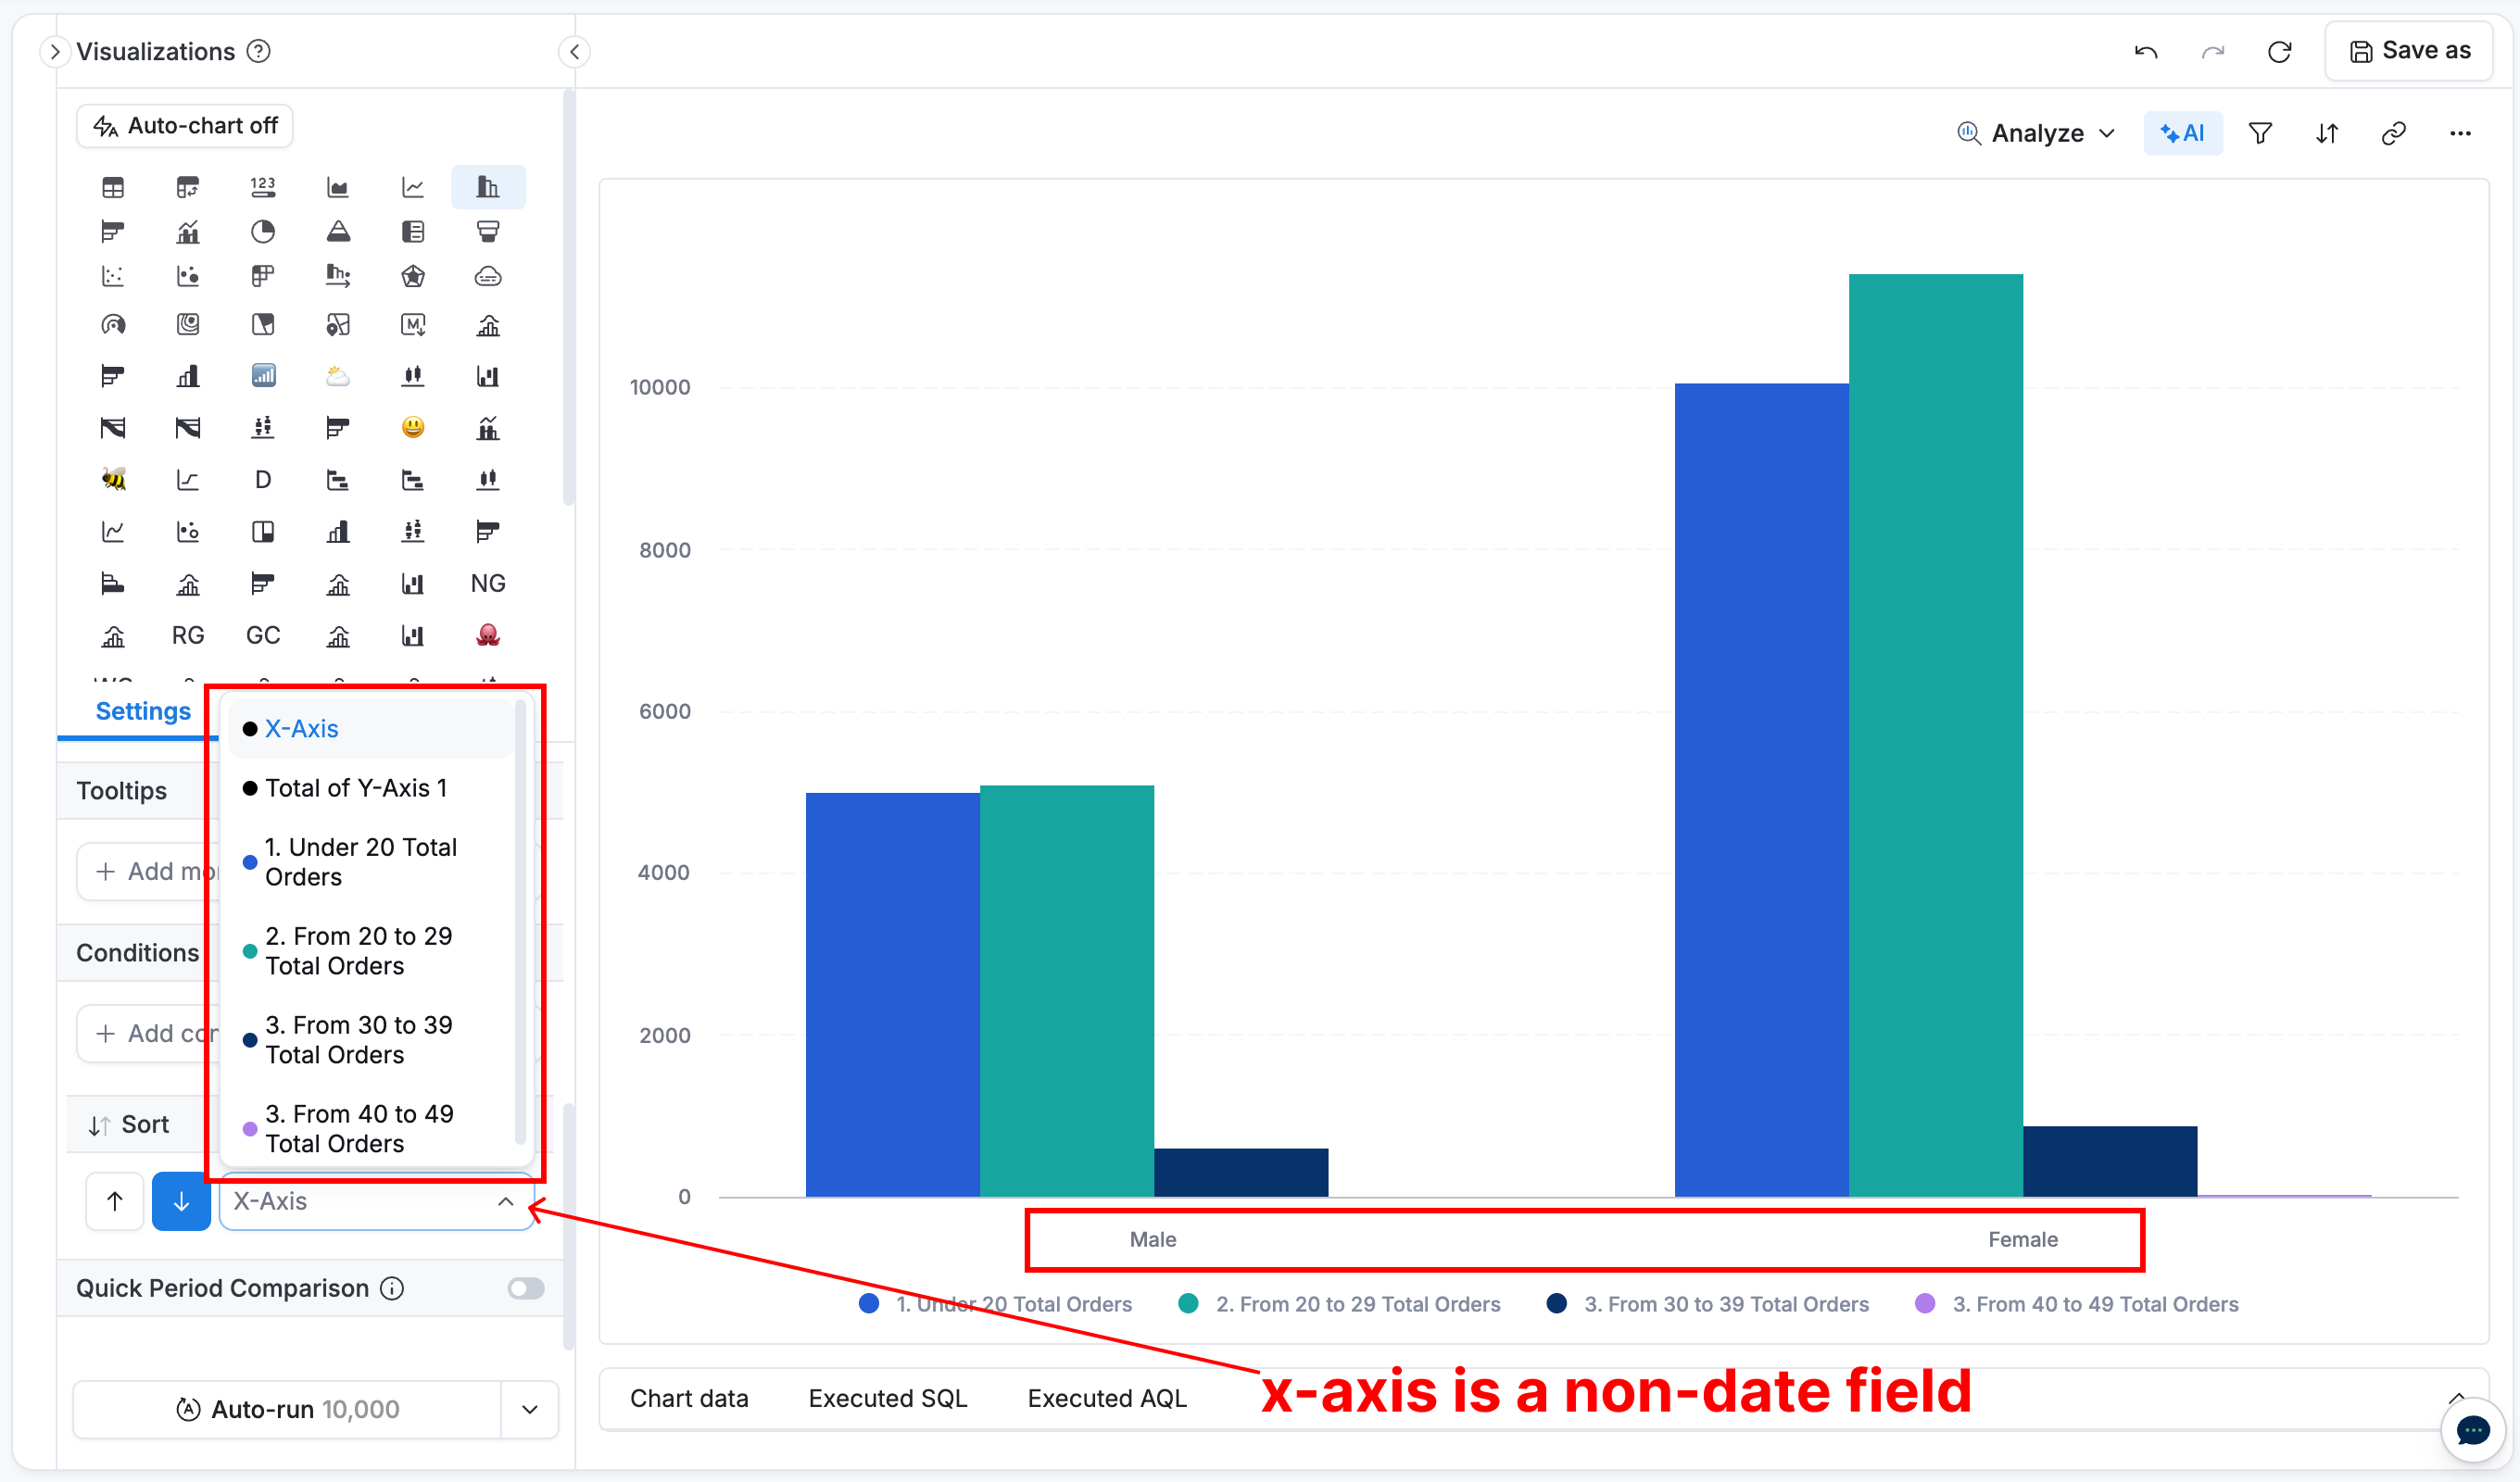
Let’s take a column chart as an example:
- X-axis: Gender
- Legend: Age demographic (age bucket)
- Y-axis: Total Orders
Currently, charts like this can be sorted by:
- X-axis values
- Y-axis / specific legend values (e.g., “Total Orders Under 20”, “Total Orders 20–29”, etc.)
- Overall Y-axis totals
Sorting behavior depends on the data type of the chosen dimension (number, text, etc.), and can be applied ascending or descending.
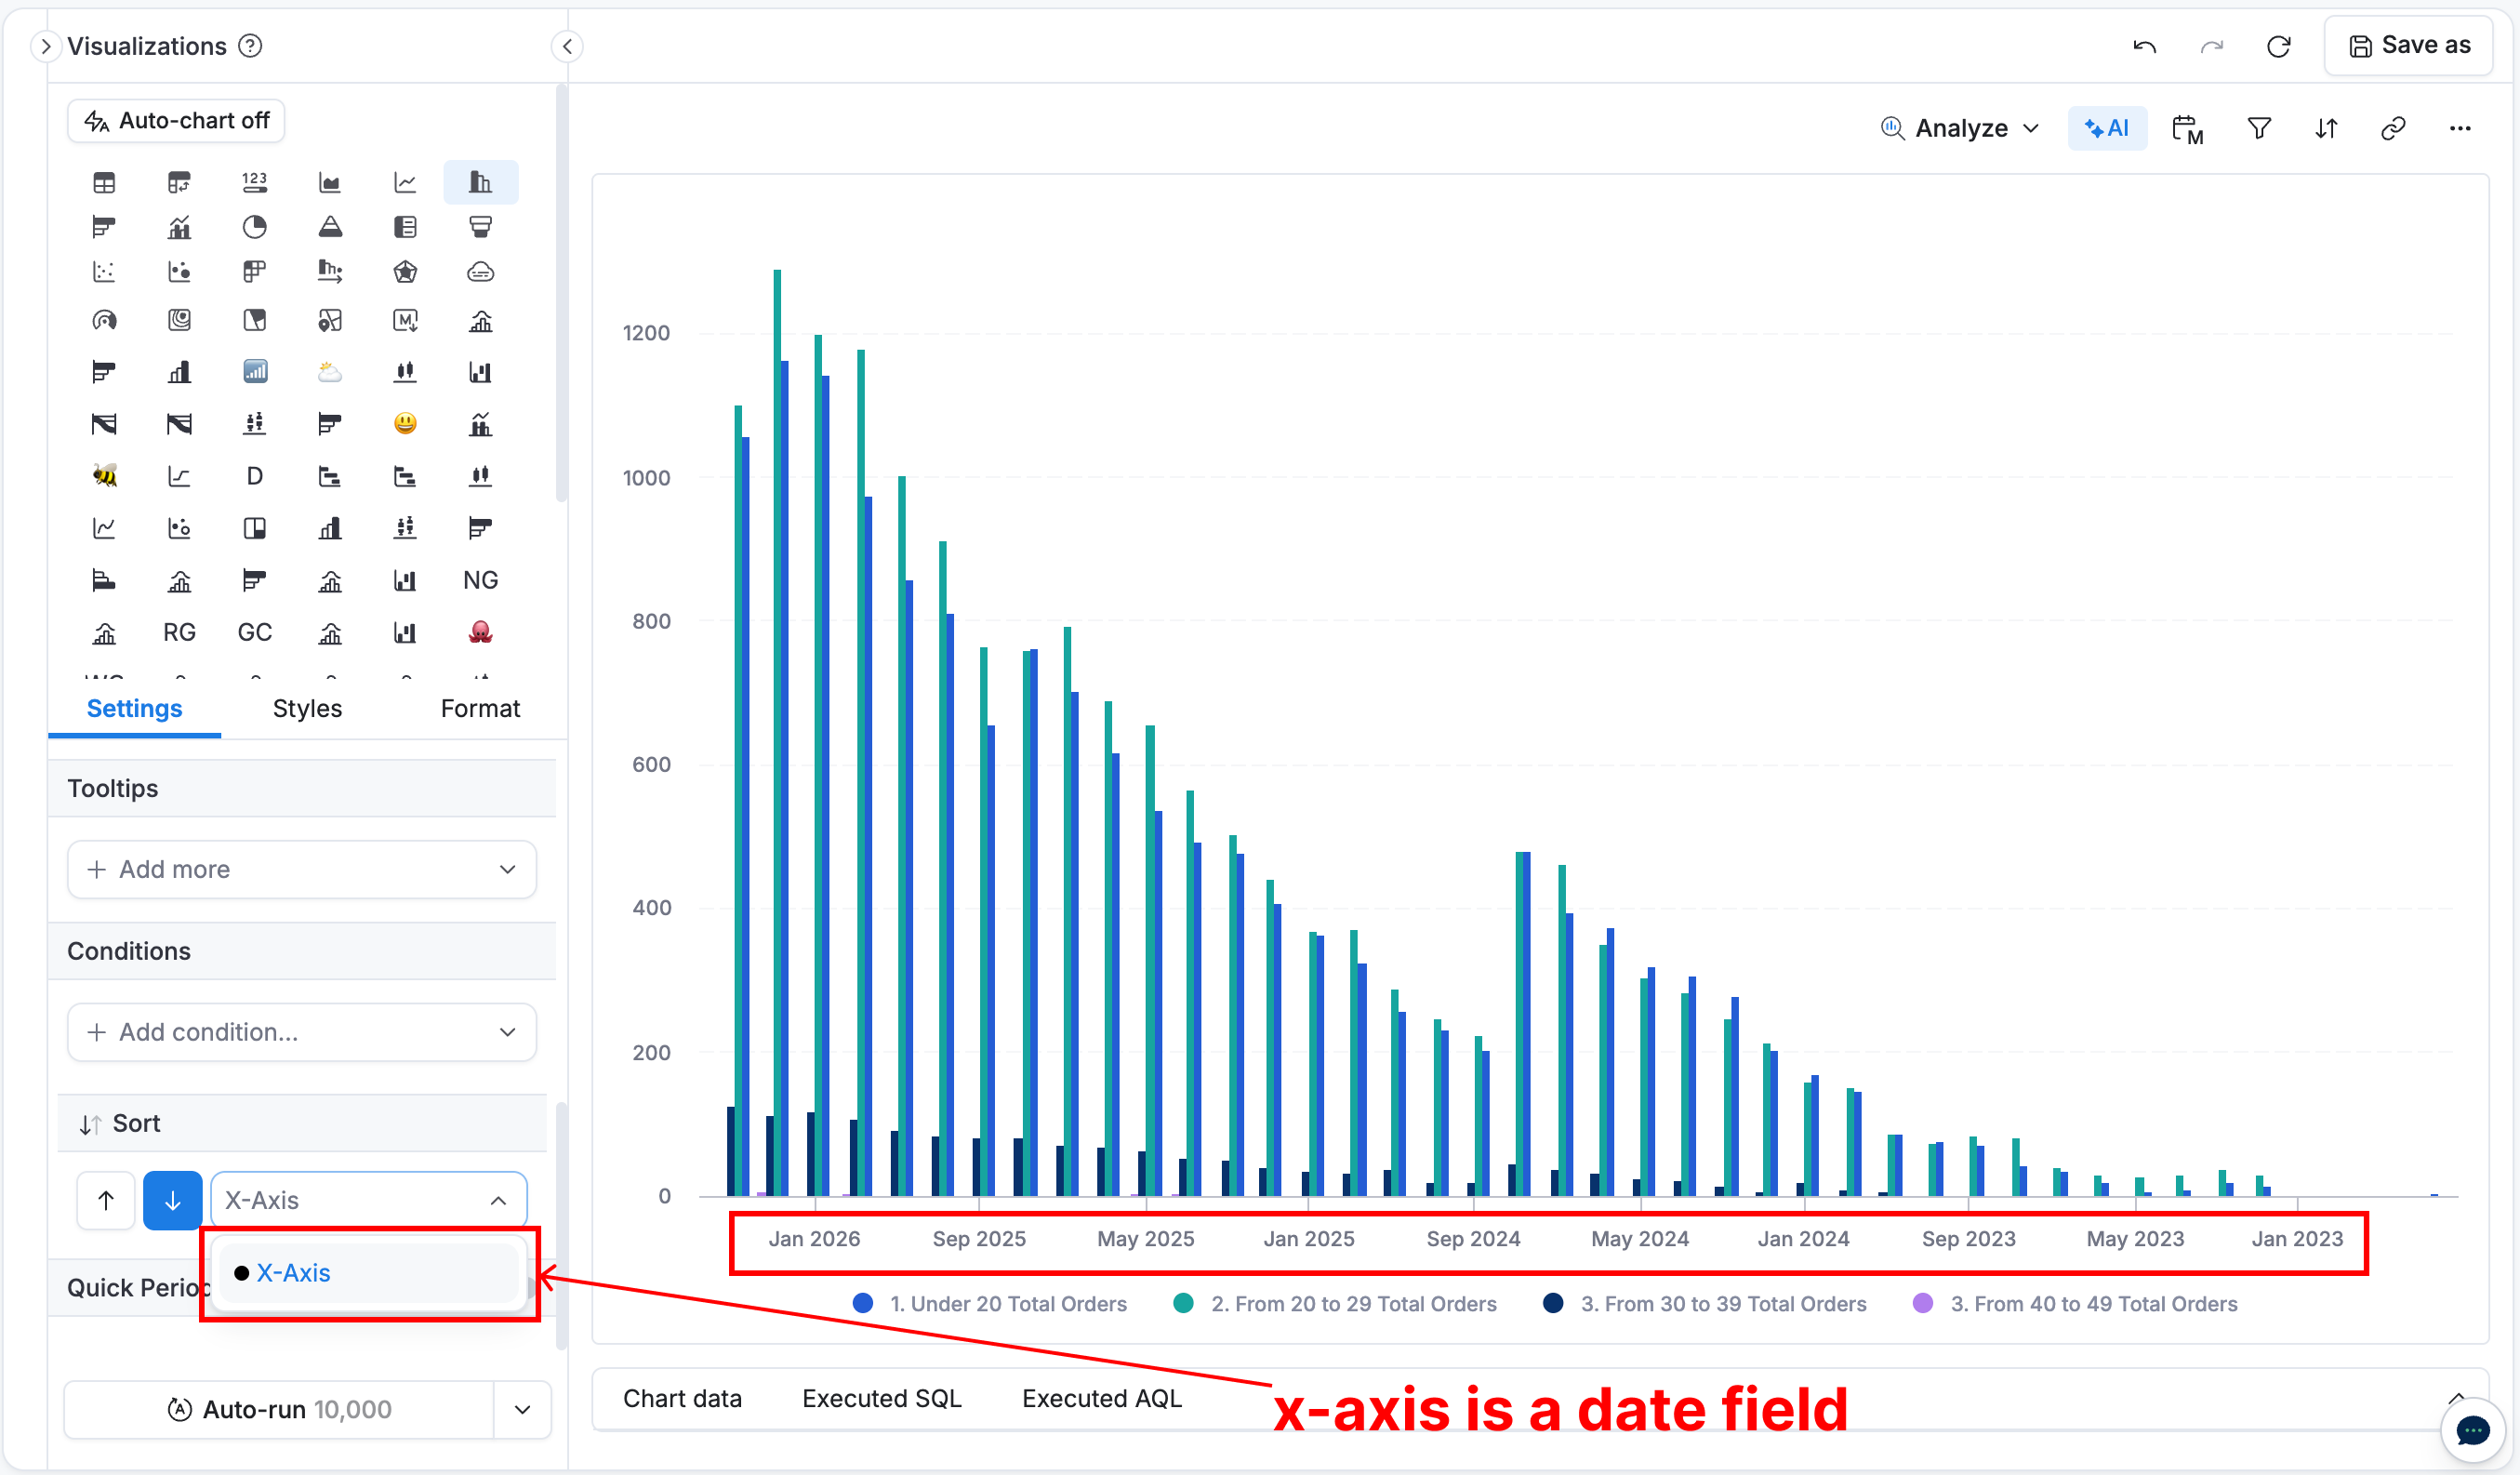
For date field on the X-axis (e.g., created_at), sorting is limited to the X-axis itself. Sorting by other dimensions would break the chronological order, making the chart harder to interpret.
If your case differs from the above, could you describe your scenario in more detail so I can assist further?
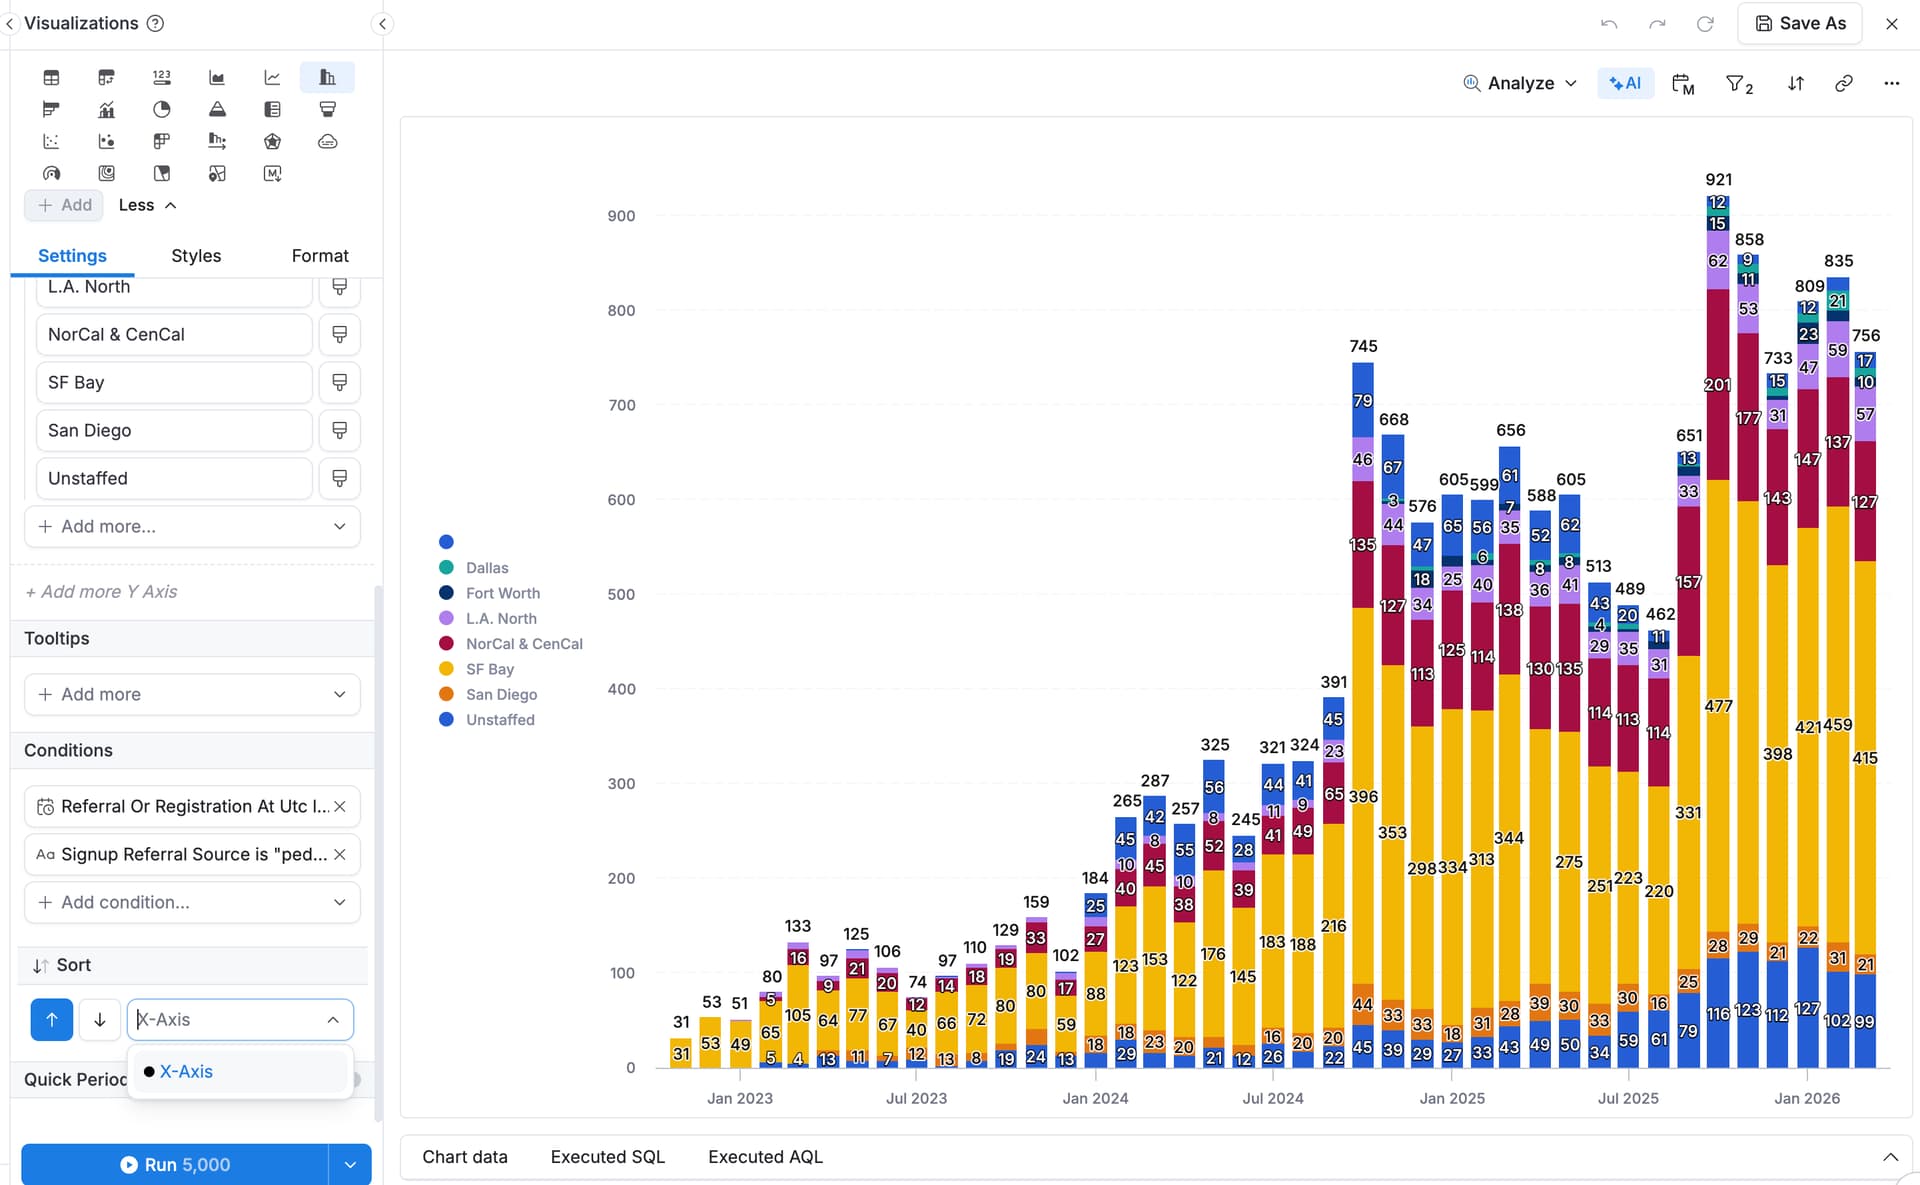
Interesting! I must be doing something wrong in that case. (see bottom left of screenshot) When I’m using a stacked bar chart, the only option for sorting is the x-axis. Is this because it’s stacked, or is there something else I’m missing?
In this case, I’d like to be able to force the yellow bars (the largest) to the top or bottom of the chart so that the eye goes from largest to smallest.
@Jake_Powell The main point of having the X‑axis as a date field is to preserve its chronological order. Sorting options are therefore limited to cases where this order can be maintained. Here are the scenarios:
- Sorting by X‑axis (date): Supported, as it maintains chronological order.
- Sorting by legend name (per column): Currently alphabetical. To customize the order, create a custom dimension using a
CASE WHENas in this post and add a prefix (e.g.,a,b,c...or1,2,3...) to enforce your desired sequence. - Sorting by total Y‑axis by legend values across the x‑axis (e.g., total Yellow vs. total Blue vs… across x-axis): Not supported natively. Workaround:
- Calculate total values for each legend across the time range.
- Similar to the 2nd case, create a custom dimension with a
CASE WHENand prefix to match the desired order.
Note: This is a fixed sort captured at chart build time. If legend values change later, the order may no longer be correct.
I’ll pass this feedback along to the team for review.
Let me know if the above matches your use case or if you’d like to discuss further.
Hi @tridvm — x-axis sorting makes sense to me.
For sorting by legend via case when, this is a great workaround. Thank you!
Let me know if/when y’all get to the ability to natively sort the Y-axis by ascending/descending, and much appreciated for the support, as always ![]()
2 Likes