Hi @Jake_Powell,
Let me confirm my understanding:
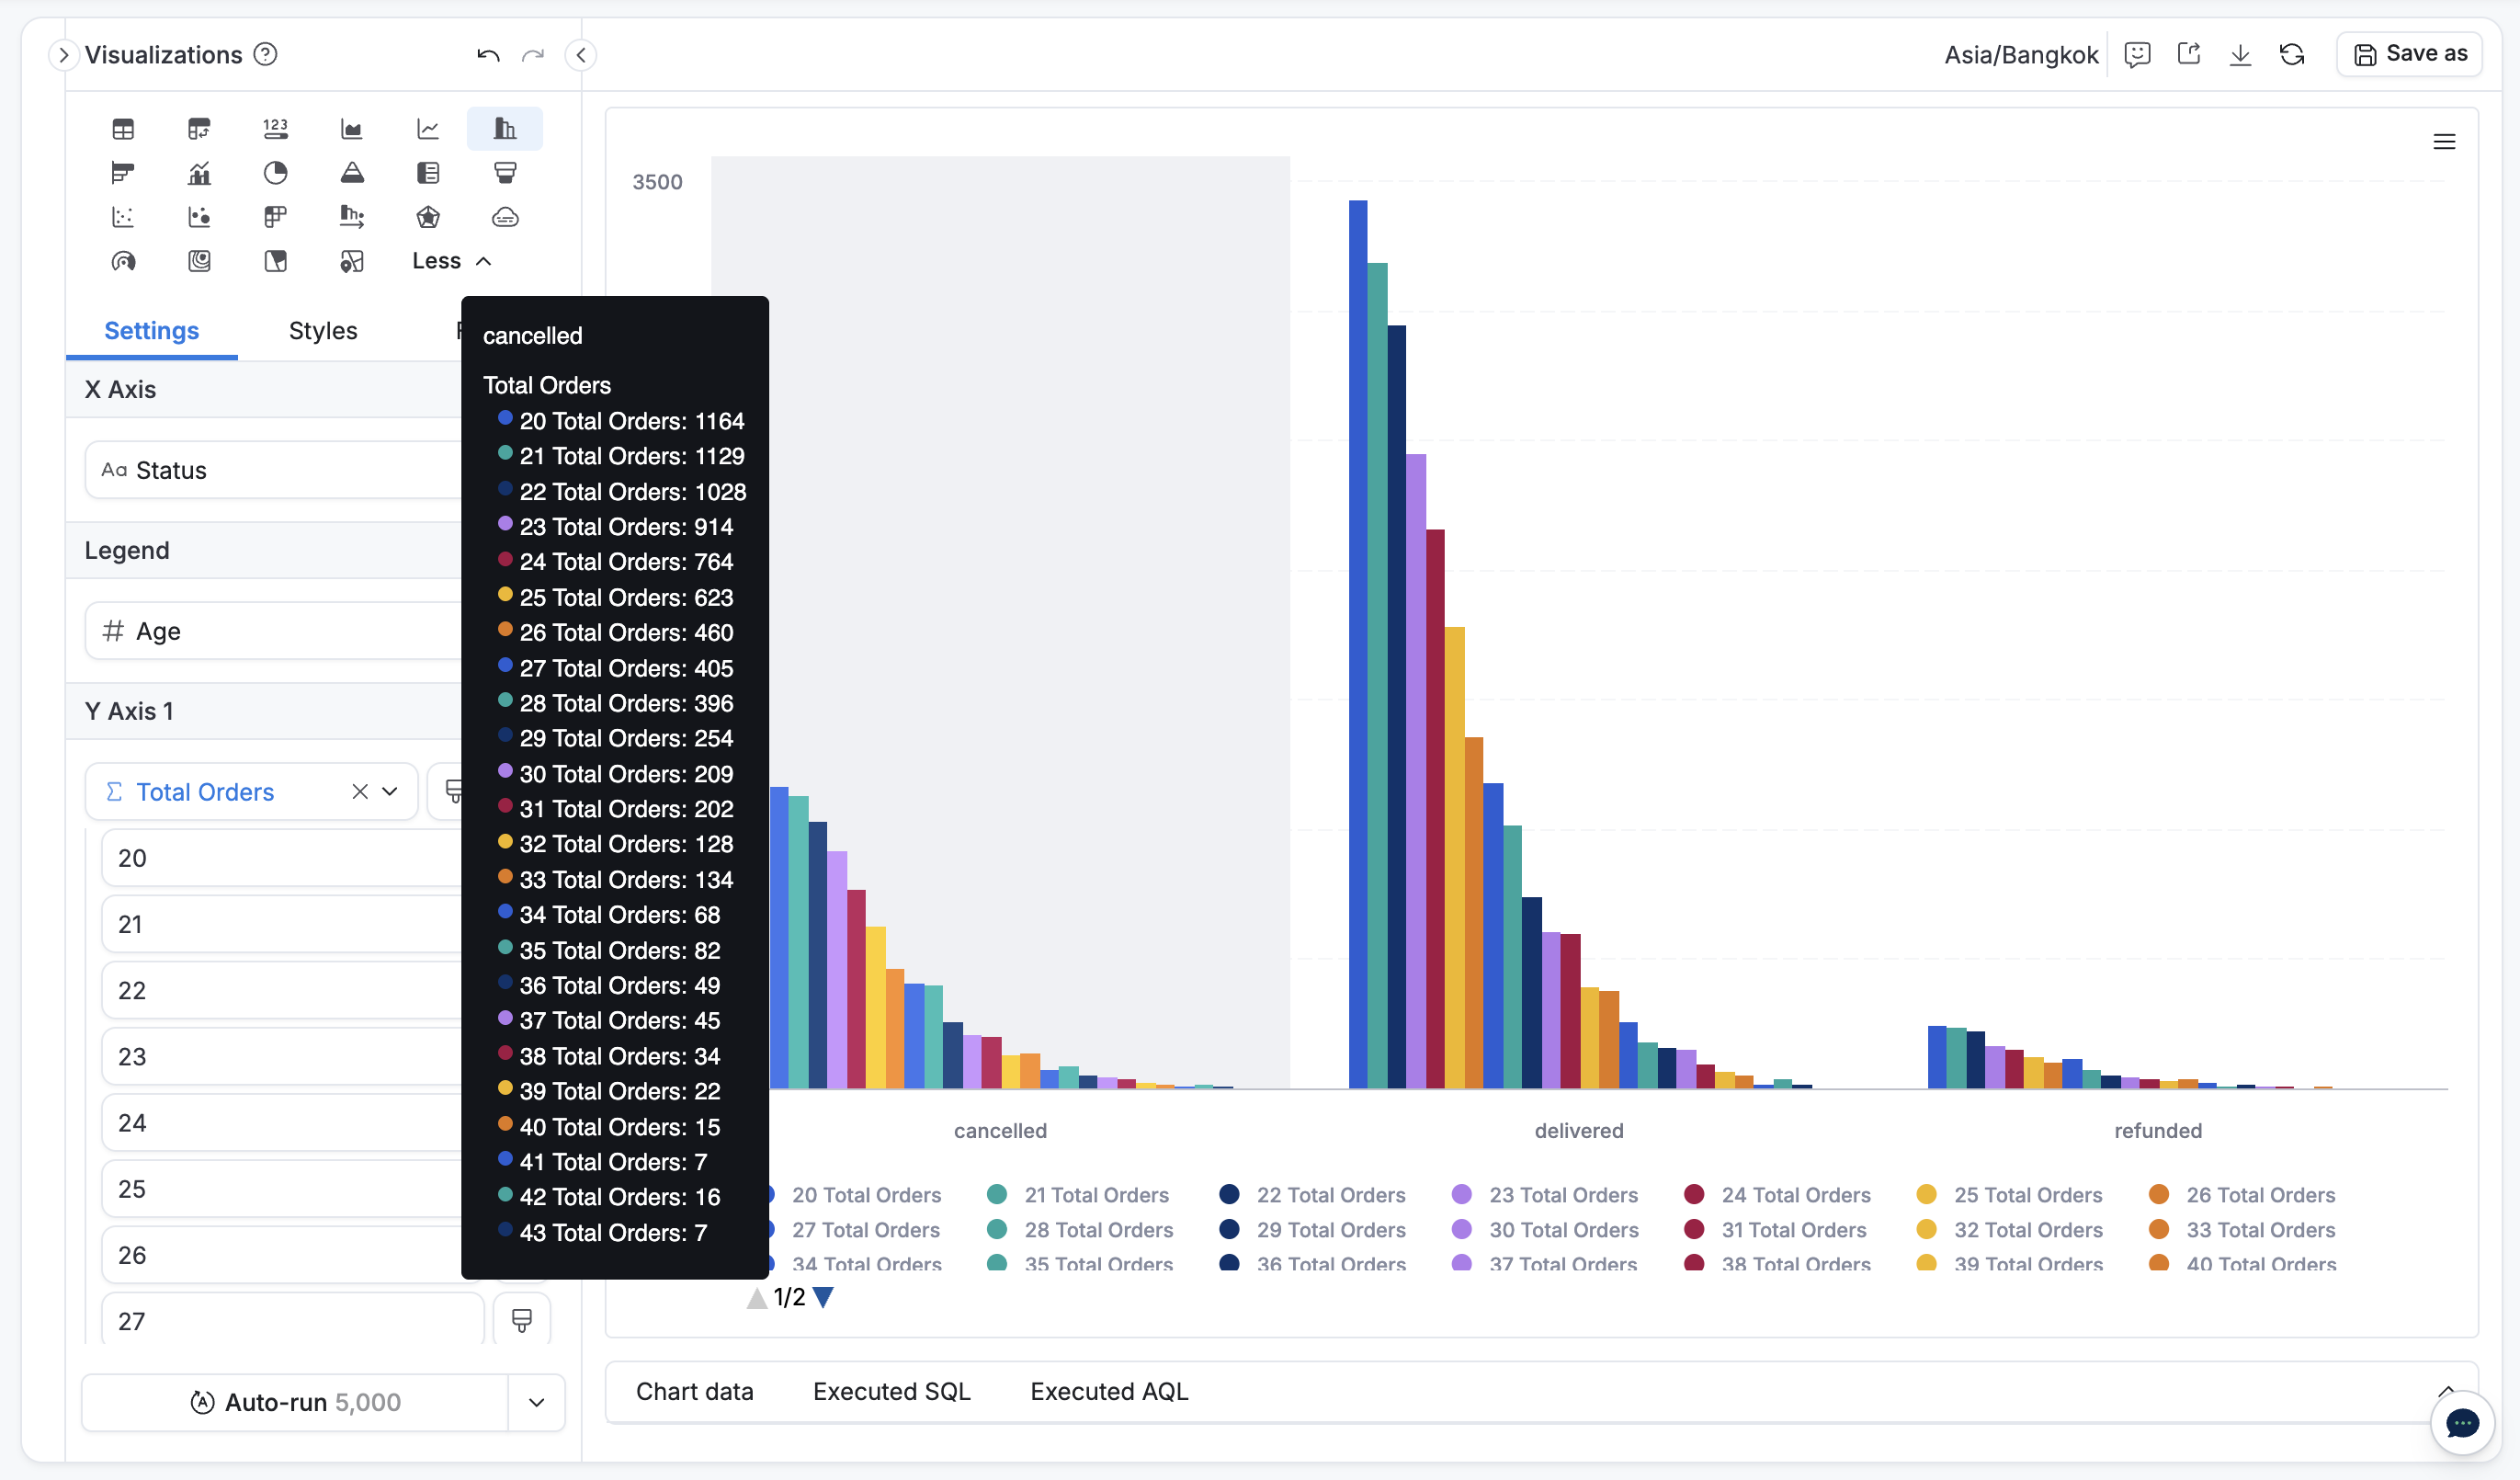
- Suppose you have a column chart:
- X-axis: Status
- Legend: Age
- Y-axis: Total orders
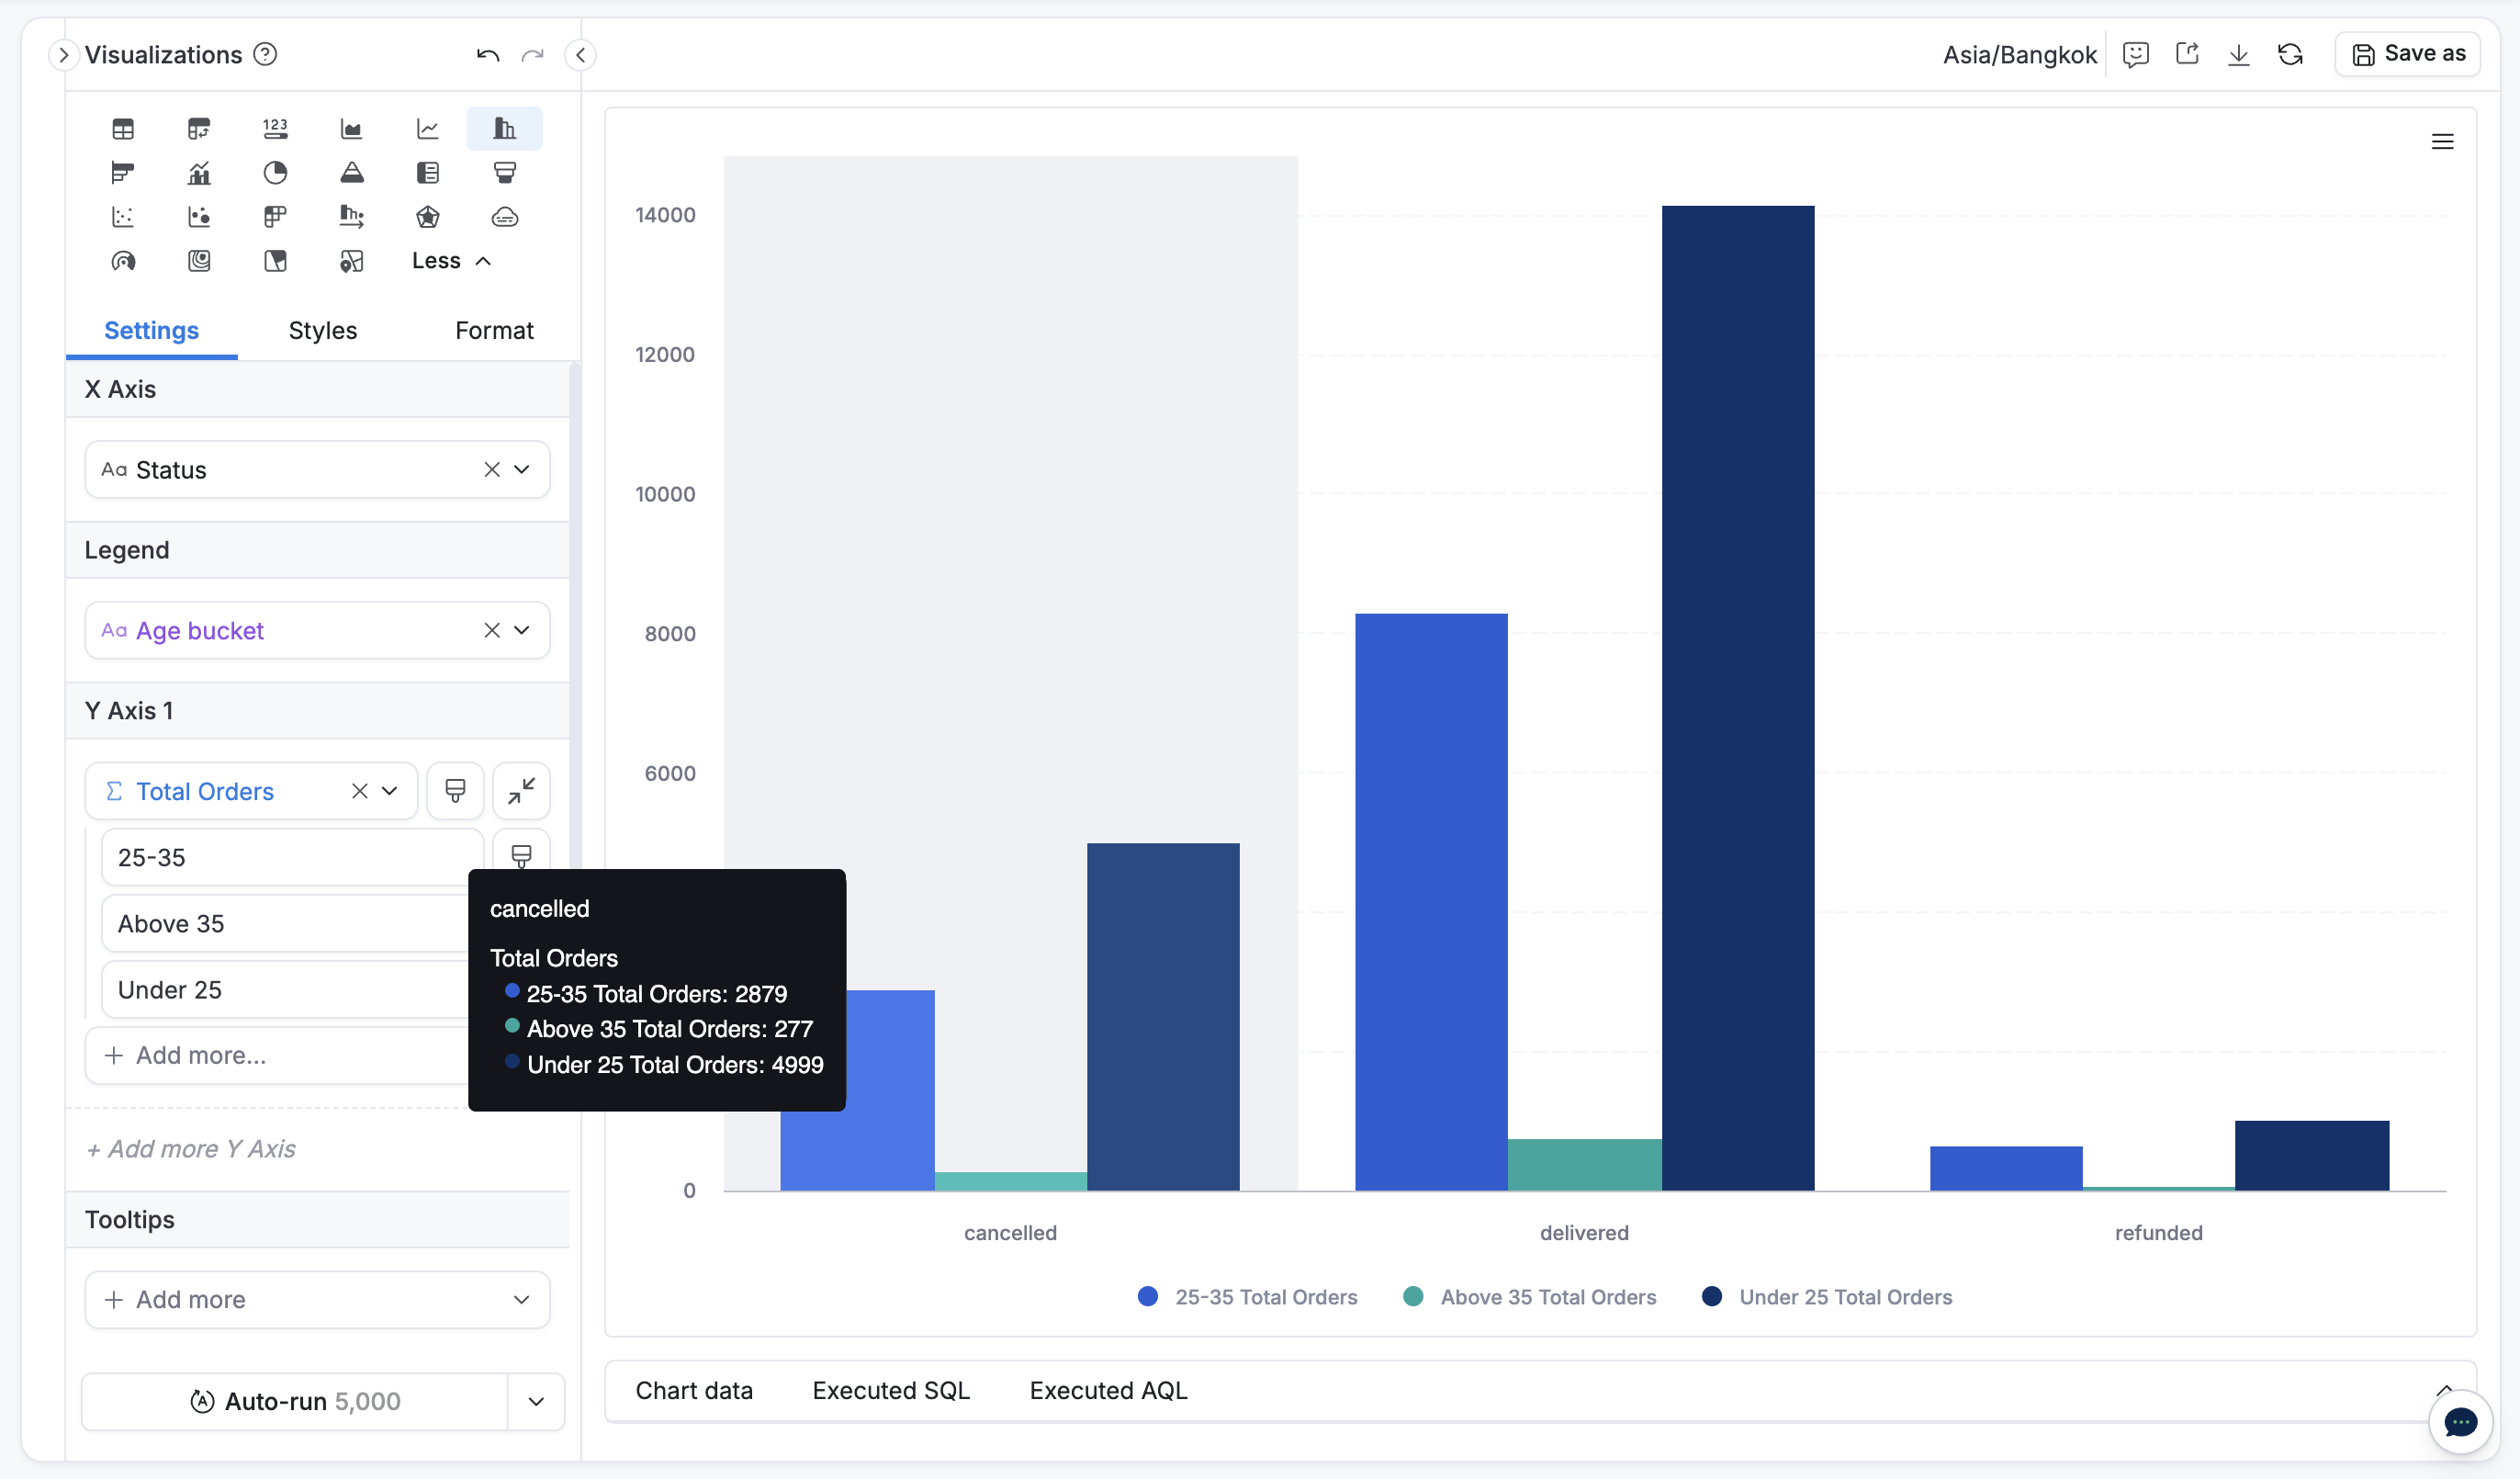
- You want to group these ages into defined age buckets, so:
- X-axis: Status
- Legend: Age buckets
- Y-axis: Total orders
Is this what you’re looking for?
If so, you just simply need to create a custom dimension with a Case-when using
- Calculation builder (GUI) or
- AQL
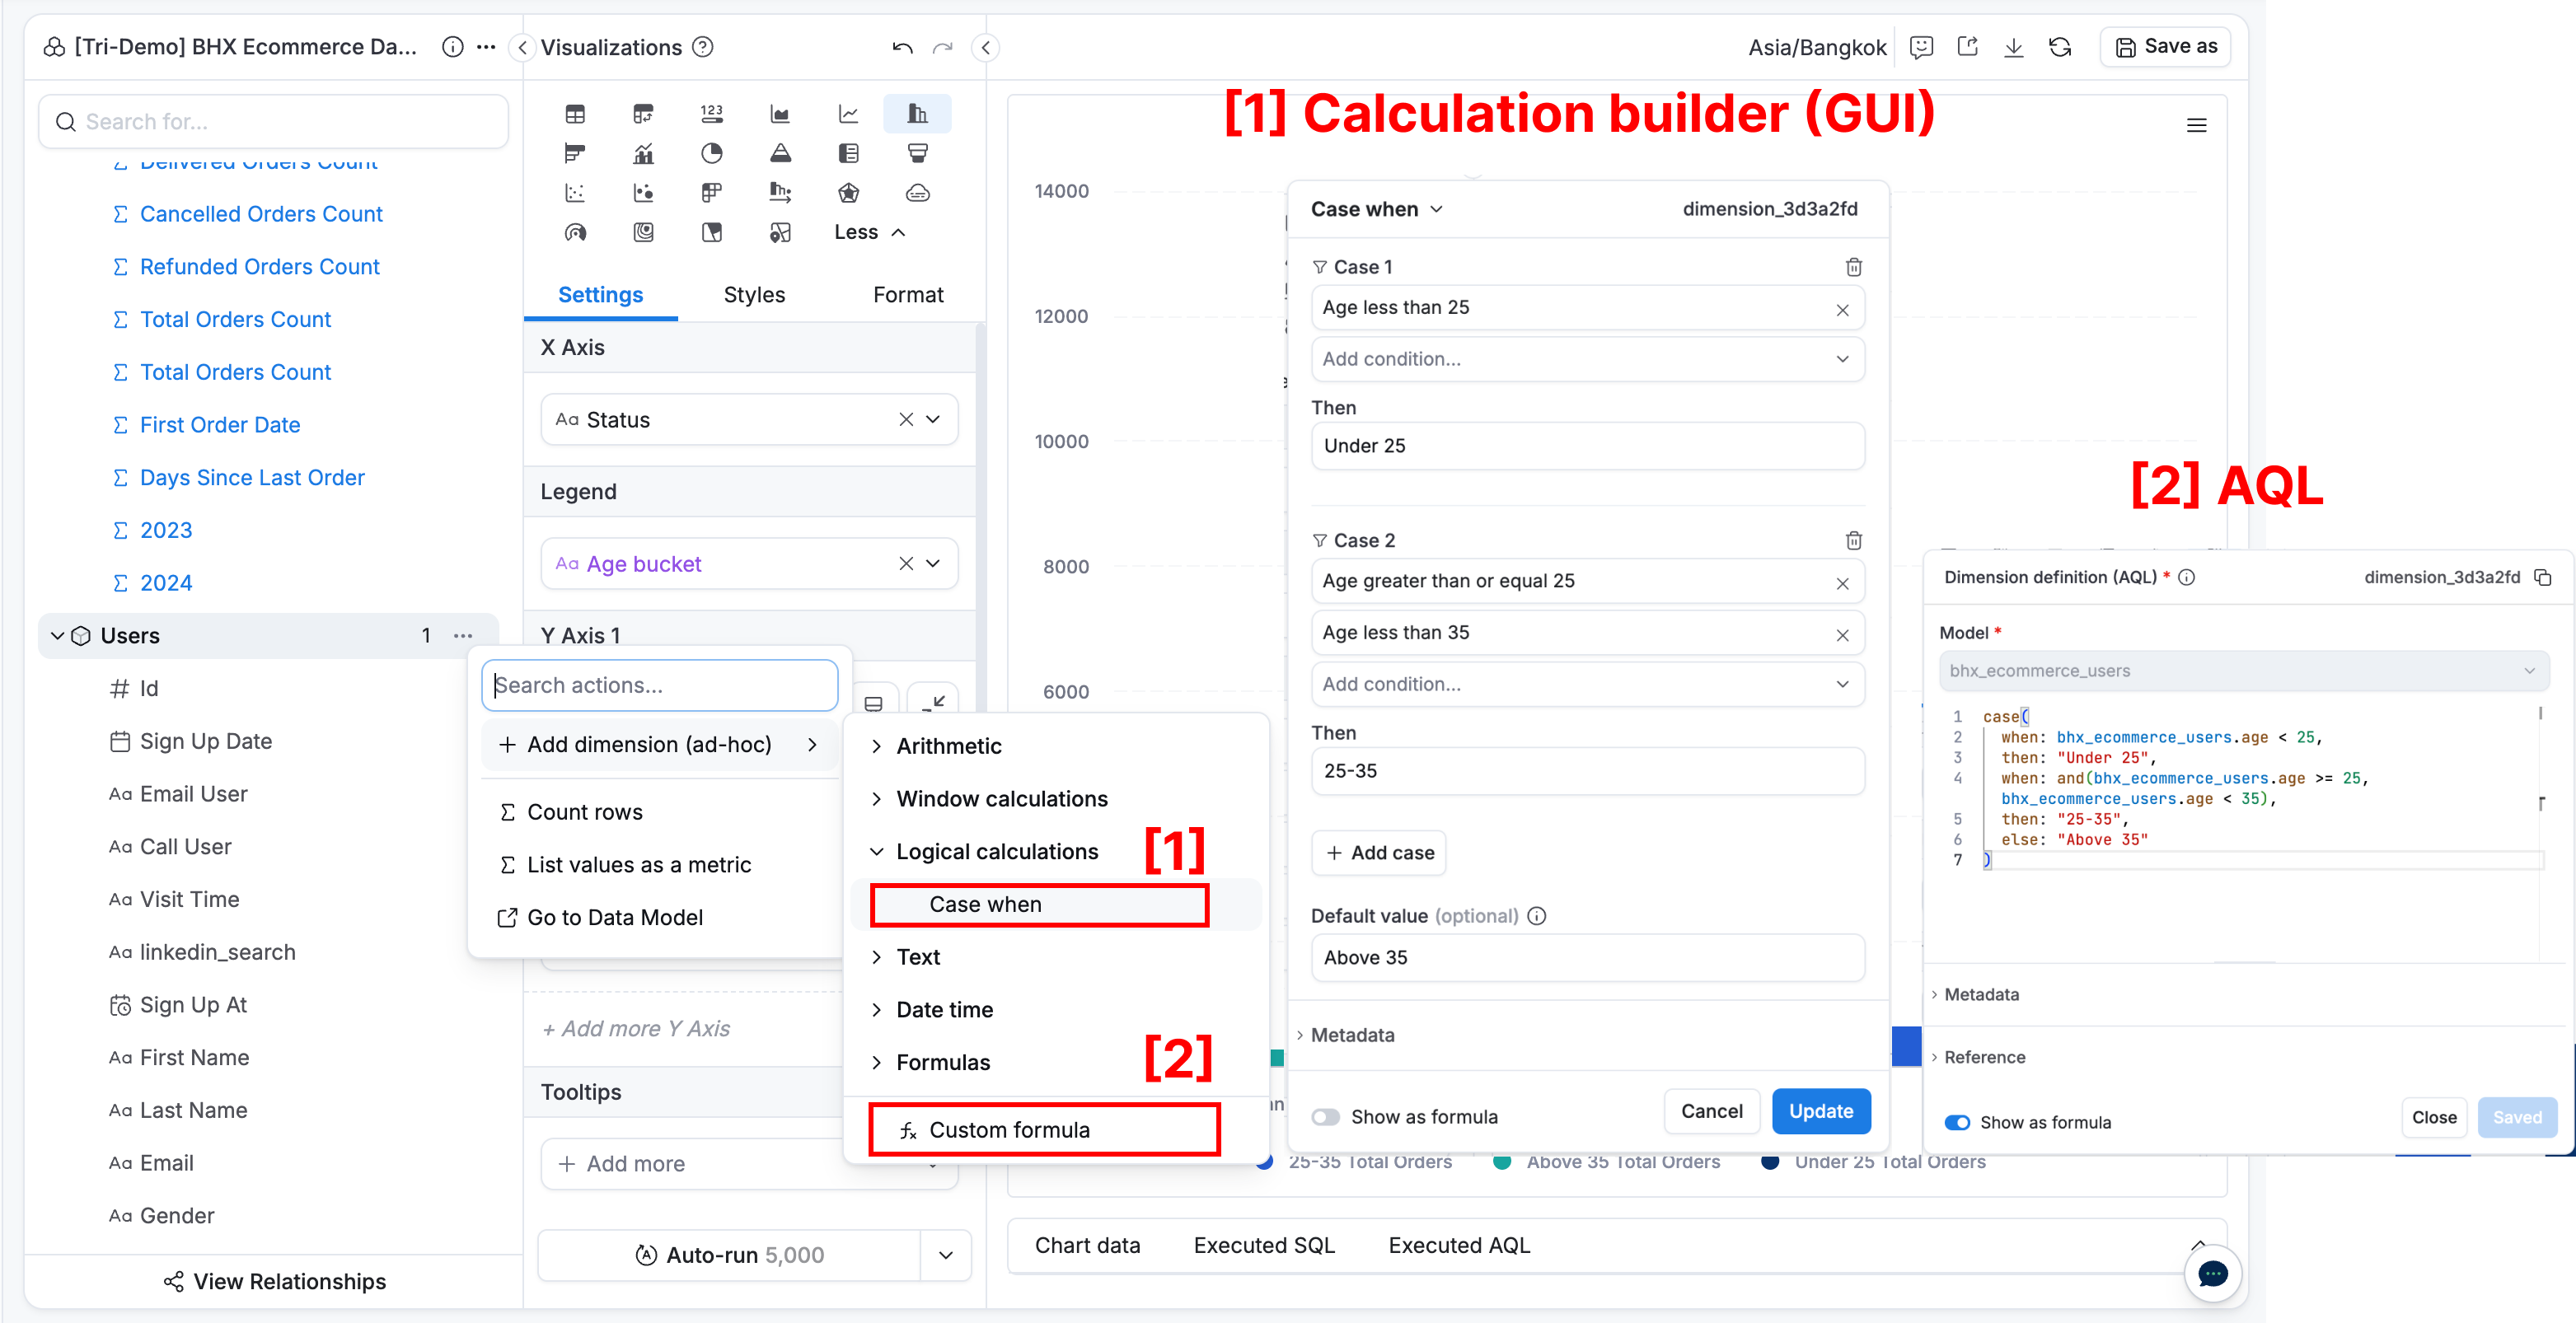
// AQL
age_bucket =
case(
  when: bhx_ecommerce_users.age < 25,
  then: "Under 25",
  when: and(bhx_ecommerce_users.age >= 25, bhx_ecommerce_users.age < 35),
  then: "25-35",
  else: "Above 35"
)
Let me know if this is your case or you need to clarify further.