On the Dashboard 3.0, the x-axis of charts would reset to min/max of the data in question. That’s not working on the canvas dashboards:
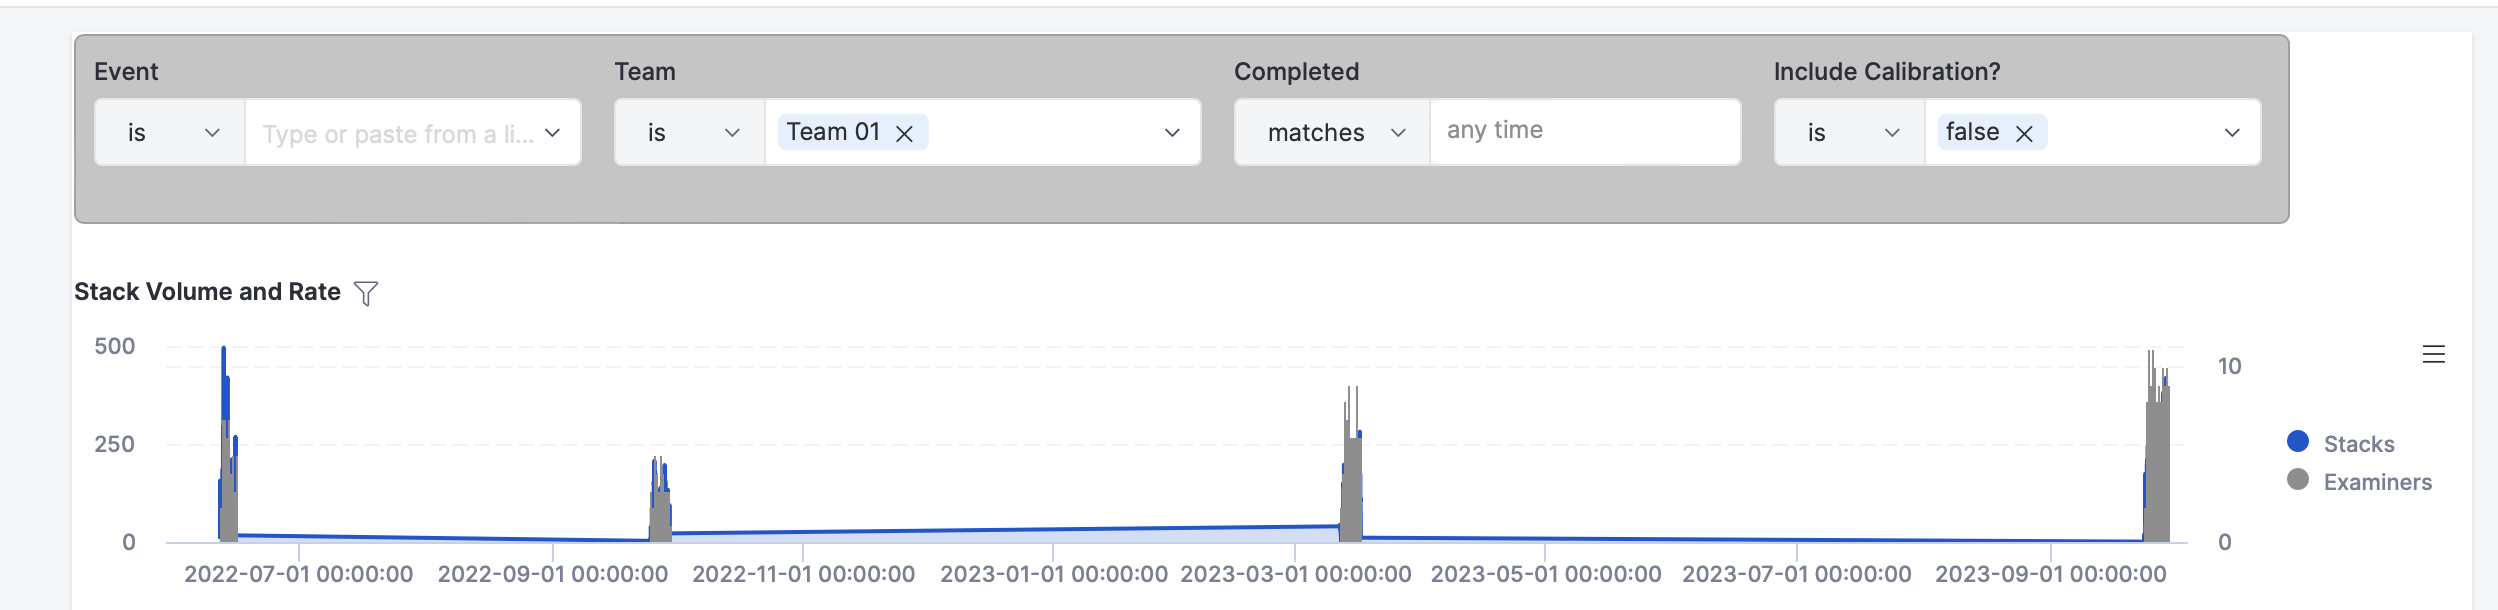
Before applying the event filter on the canvas
(events are 1 wk long, thus the empty space in the report):
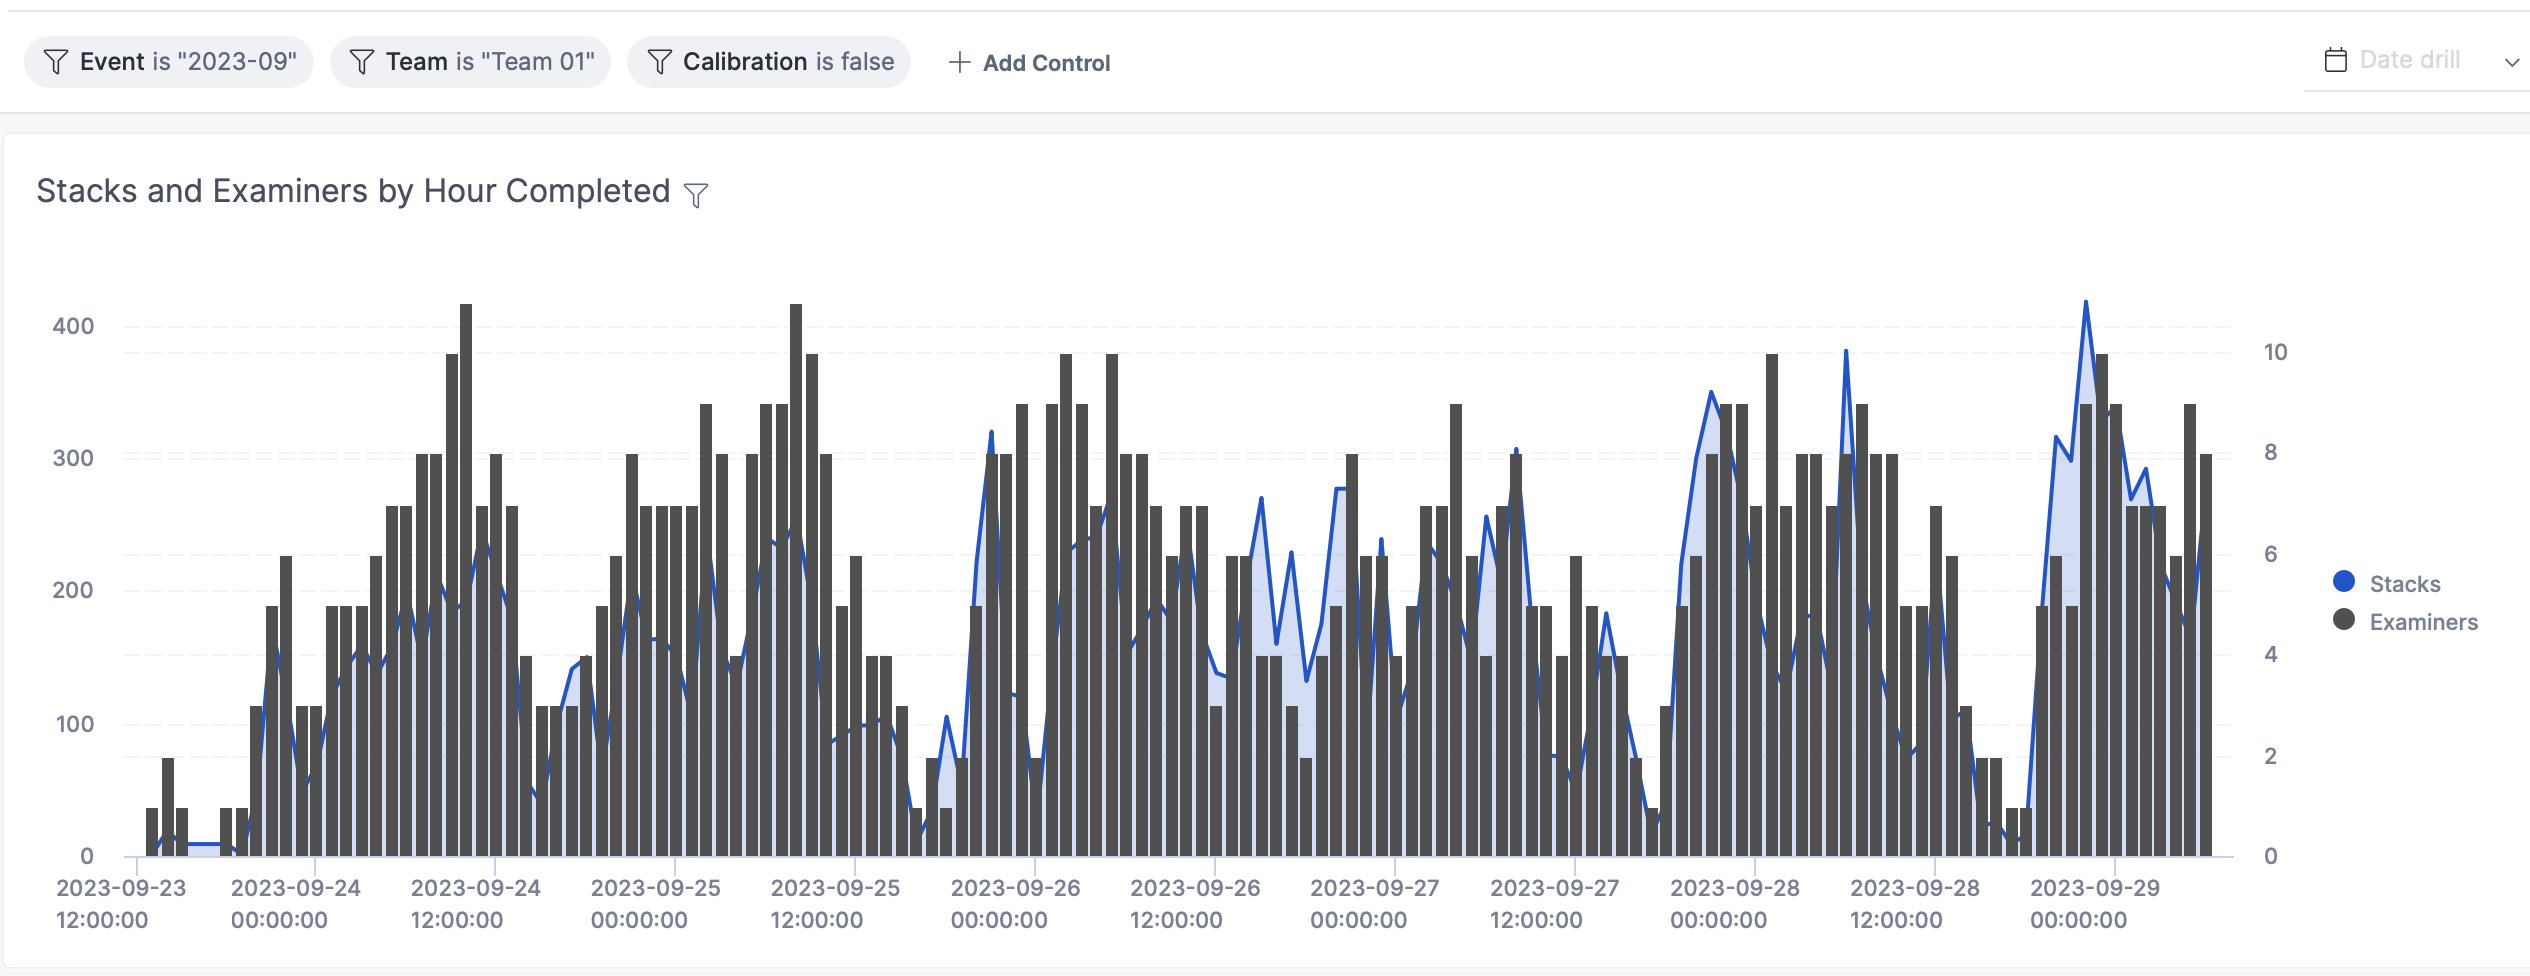
After applying the event filter on the canvas:

Same report on a 3.0 Dashboard with filters applied:
ps: should there be a keyword/tag for “canvas_dashboard”?
thanks,
.stone