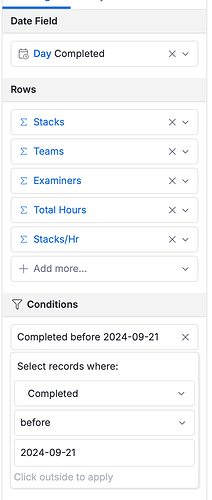
I’m using a metrics sheet to show data over the course of a 7d event using a date dimension called “completed”. After the 7th day, there is no more data collected, so day over day the metric sheet show “no activity” each day.
How do I show the last N columns since the “max completed date”. I tried to make an ad hoc filter on the report like:
where(stack_assignment_timing.completed < max(stack_assignment_timing.completed))
and
stack_assignment_timing
| where(stack_assignment_timing.completed < max(stack_assignment_timing.completed))
Neither worked to pin the last day of the metric sheet to the most recent date of data in the dataset.
This simple filter, where I pick an explicit date, works as designed for “this event”, but the explicit date isn’t appropriate for previous events.

