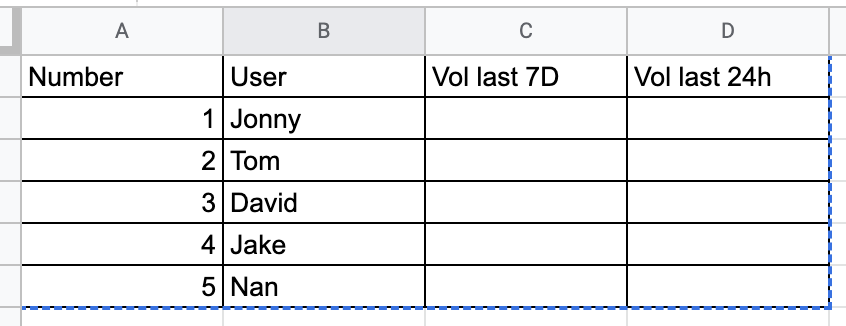
Hello, I have data of user’s transactions with timestamps, the transaction includes their trading volume, and user name, … I want to create a table chart of the top 50 users by trading volume last 7 days, but also in that table, it also shows that user trading volume last 24h. How can I do that with holistic
Something like this
Hi Quang,
I’m Hien from Holistics Data Team.
From your description, I assume that your model looks like this:
|  timestamp  |      user      | volume |
|-------------|----------------|--------|
| timestamp1  |  userA         | $1000  |
| timestamp2  |  userB         | $2000  |
| ...         |  ...           |   ...  |
In the model, I suggest creating 2 measures to calculate total volume of last 7 days and total volume of last 24 hours. In case you haven’t try creating a measure before, please kindly refer to our documentation here. Assuming that your database type is BigQuery:
- Vol last 7 days:
sum(case when {{#SOURCE.timestamp}} between timestamp_sub(current_timestamp, INTERVAL 7 DAY) and current_timestamp() then {{#SOURCE.volume}} else 0 end)
- Vol last 24 hours:
sum(case when {{#SOURCE.timestamp}} between timestamp_sub(current_timestamp, INTERVAL 24 HOUR) and current_timestamp() then {{#SOURCE.volume}} else 0 end)
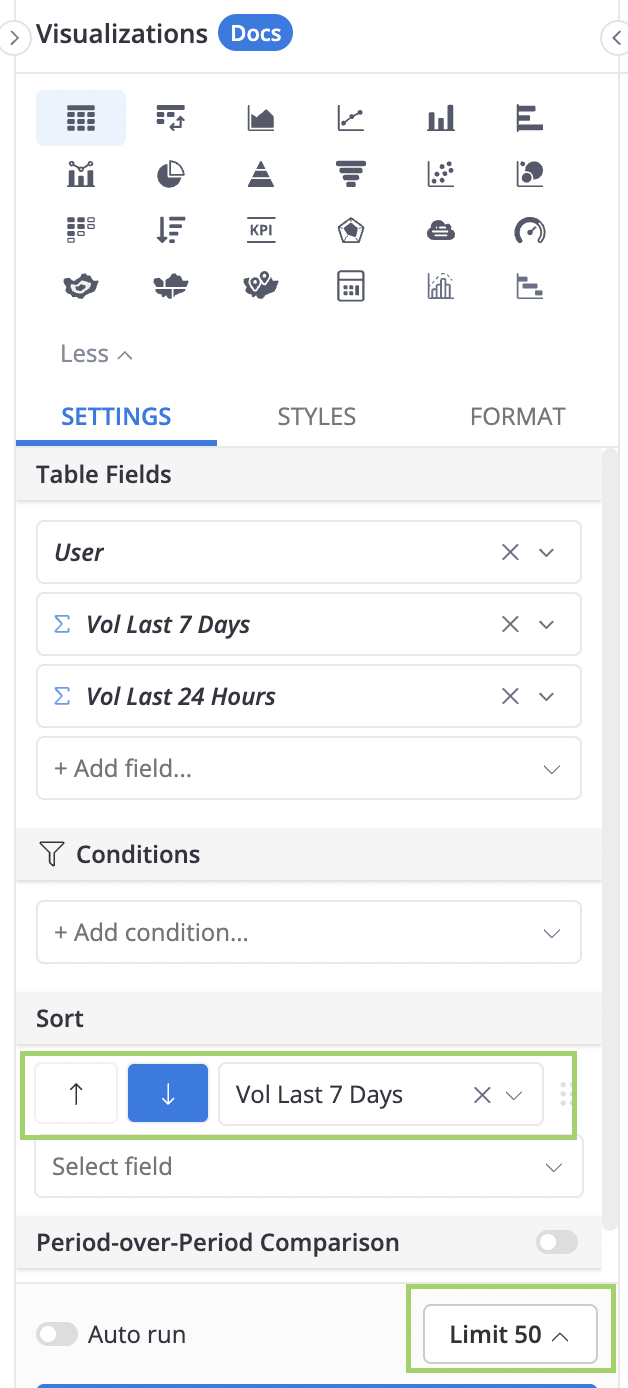
When creating the report, in order to show only top 50 users by trading volume in the last 7 days, you can try to sort by Vol last 7 days descending and limit number of rows to 50 as shown in the picture below:
I hope this helps and please feel free to let me know if you encounter any problem ![]() .
.
Hien
1 Like
It works perfectly, thank you so much. I totally forgot about the measure field feature.
1 Like