Hi!
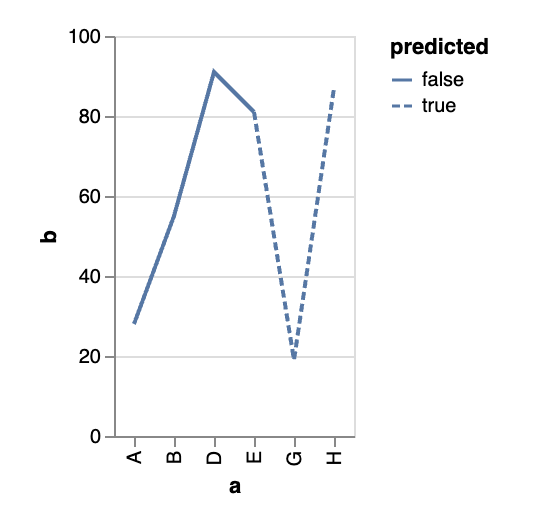
I’m trying to create to a custom chart with a dashed line like this.
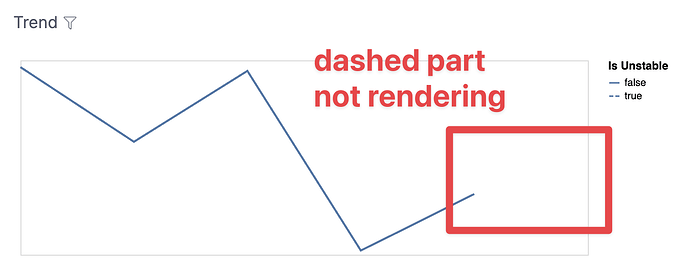
I believe my vega-lite code should be correct, Weirdly it seems to be unable to render any dashed lines and show null for my chart.
If I set the dashed field to all true or false it shows a solid line.
Here’s the custom chart code
CustomChart {
  fields {
    field x {
      type: "dimension"
    }
    field y {
      type: "measure"
    }
    field dashed {
      type: "dimension"
    }
  }
  options {
    // INSERT OPTION DEFINITION HERE
  }
  // INSERT VEGA-LITE JSON SPECIFICATIONS BELOW
  template: @vgl {
    "data": {
    "values": @{values}
    },
    "transform": [
    {
      "joinaggregate": [
        {"op": "max", "field": @{fields.y.name}, "as": "max"},
        {"op": "min", "field": @{fields.y.name}, "as": "min"}
      ]
    },
    {"calculate": "datum.max", "as": "max"},
    {"calculate": "datum.min", "as": "min"}
  ],
  "params": [
    {"name": "max", "expr": "data('data_0')[0]['max']"},
    {"name": "min", "expr": "data('data_0')[0]['min']"}
  ],
    "mark": "line",
    "encoding": {
      "x": {
        "field": @{fields.x.name},
        "type": "temporal",
        "axis": null
      },
      "y": {
        "field": @{fields.y.name},
        "type": "quantitative",
        "axis": null,
        "scale": {"domain": {"expr": "[min,max]"}}
        },
      "strokeDash": {"field": @{fields.dashed.name}, "type": "nominal"}
    }
  };;
}
Here’s what I get on my end. You can see it shows the dash in the legend.


