Hi,
I want to ask about Radar Chart, below is my cases:
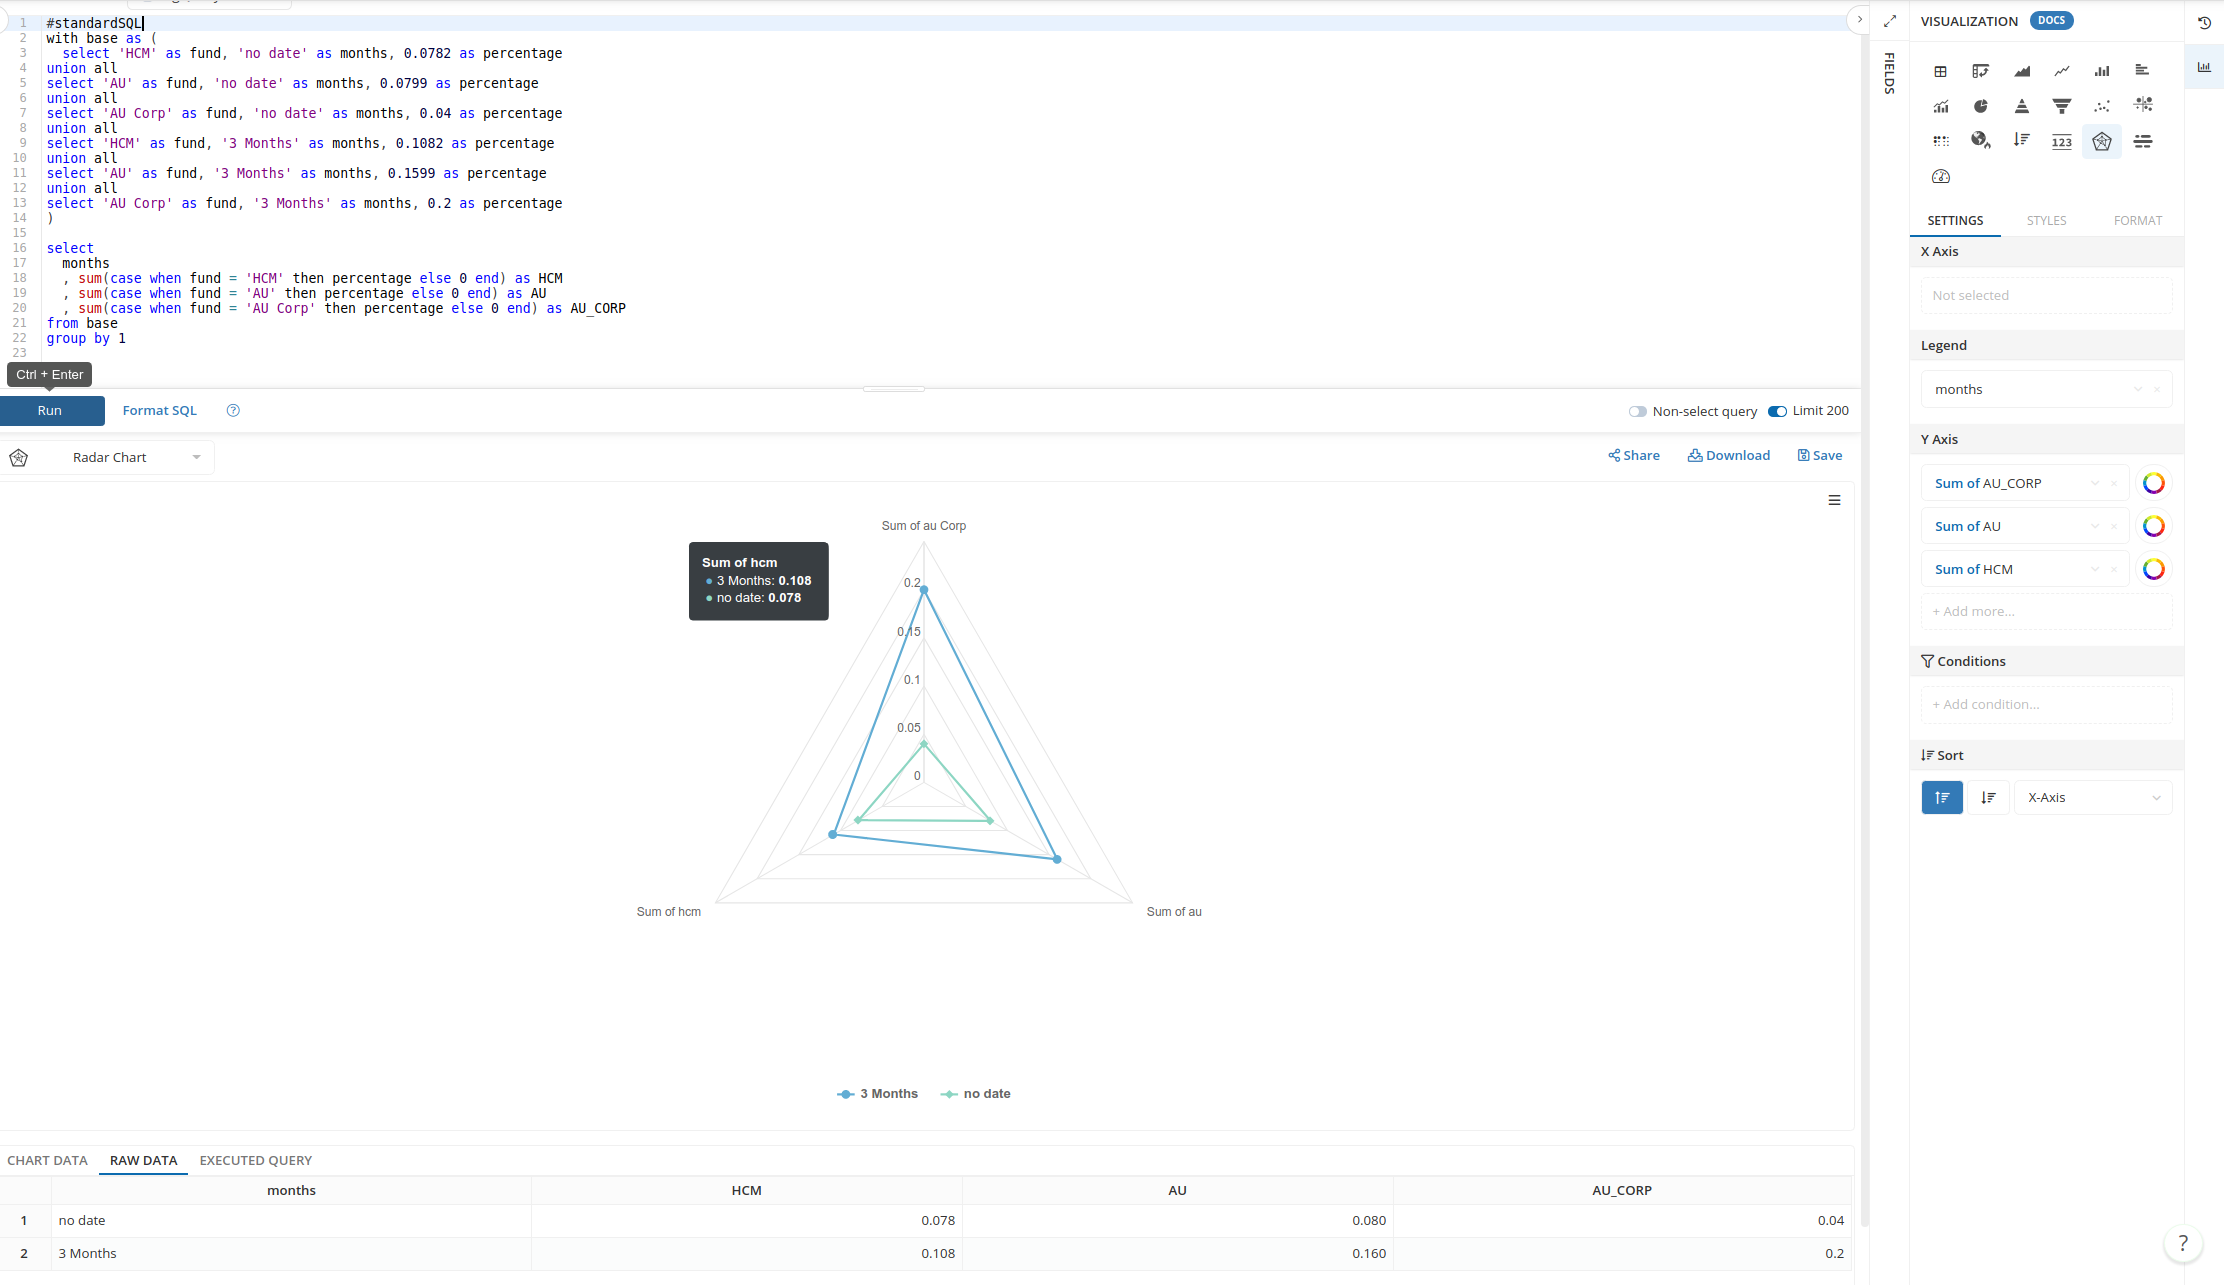
This is my Raw Data:
Fund – Months – Percentage
HCM – no date – 7.82%
AU – no date – 7.99%
AU Corp – no date – 4%
HCM – 3 Months – 10.82%
AU – 3 Months – 15.99%
AU Corp – 3 Months – 20%
I want to build a Radar Chart Like This:

I configure my viz setting:
X-axis → Months
Legend → Fund
Y-axis → Percentage
The Holistics give this error message:
“Just select X-axis or Legend field only.”
Is there something wrong on my Raw Data or Viz Settings? or Holistics not supported yet Categorical Radar Chart? Looking Forward on it.
Thanks