Hi, I have created current month, last month and same month last year metrics and I’m trying to show these metrics for every month of the current fiscal year but Holistics reacts in a strange way. Could you tell me what we did wrong ?
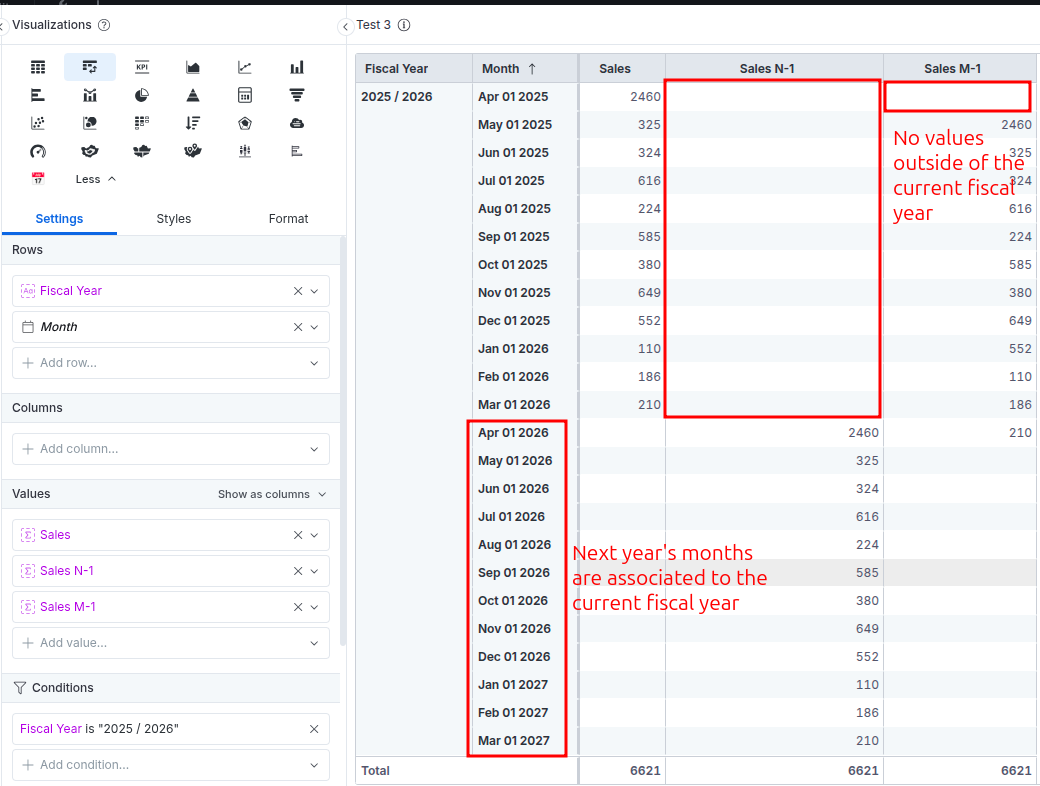
The metrics We use are described below. They work fine when no filter condition is set on the visualization :
  metric sales {
    label: "Sales"
    type: "number"
    definition: @aql sum(sales.amount);;
  }

  metric sales_n1 {
    label: "Sales N-1"
    type: "number"
    definition: @aql sales | relative_period(months.month_start_dt, interval(-1 year)) ;;
  }

  metric sales_m1 {
    label: "Sales M-1"
    type: "number"
    definition: @aql sales | relative_period(months.month_start_dt, interval(-1 month)) ;;
  }
The date field used in these metrics comes from a Months dimension table joined to the Sales table on sales.sales_month_dt == months.month_start_dt.
The Months dimension also contains the fiscal year column as below :
| month_start_dt | month_end_dt | fiscal_year |
|---|---|---|
| … | … | … |
| 2025-01-01 | 2025-01-31 | 2024 / 2025 |
| 2025-02-01 | 2025-02-28 | 2024 / 2025 |
| 2025-03-01 | 2025-03-31 | 2024 / 2025 |
| 2025-04-01 | 2025-04-30 | 2025 / 2026 |
| 2025-05-01 | 2025-05-31 | 2025 / 2026 |
| … | … | … |
Any idea ?