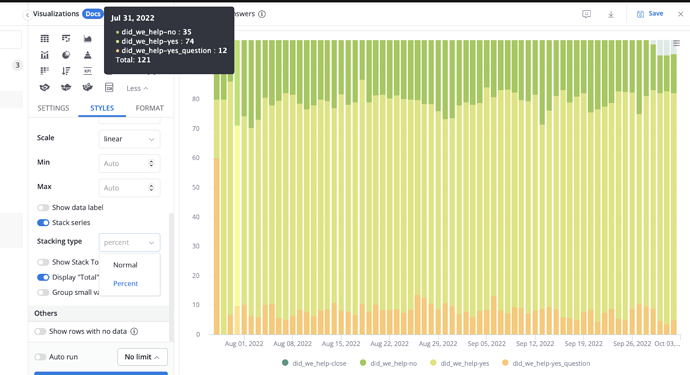
Hey! I do stack percent series in column chart but see absolute values in tooltips. But I want see
percentages in tooltips. How can I get this? Thanks
Hi @iapavlov96,
Unfortunately, we haven’t supported showing percent in tooltips for Stack percent series yet.
Let me raise it with the team & see if we can support this soon. Will come back with updates on this ![]()
P.s: I just switched this post to Feature suggestions category, since it might be helpful for other members with similar use cases. Hope that’s ok ![]() . Thanks, Ilya
. Thanks, Ilya
Hello @vu.duong - has this been implemented yet? This is a need my team has as well. Thank you.
Hi @iapavlov96 and @gwizard,
Thanks for following up on this. Unfortunately, we haven’t got around to support Percentages in tooltips as a built-in options.
That being said, in Holistics 4.0 you can definitely achieve this with our new feature called Customizable Tooltips, along with AQL.
To achieve this:
Go to your Visualization Settings → add a Customizable Tooltip → choose Add AQL Metric → use the field definition below:
count(x.dim) / (count(x.dim) | of_all(x.legend, keep_filters: true))
You can see this demo video for guidance:
Unfortunately, this is unachievable for Holistics 3.0 right now.
Even though Customizable Tooltips are also available in Holistics 3.0, this version lacks the power of AQL query language (more specifically, the Level-of-Detail capability to calculate the Total denominator).
Please let me know if you have any further questions.
Cheers!
That’s very helpful thank you.
