We’re excited to announce an exciting new feature coming to Canvas Dashboard: Tabs!
This highly-requested addition will transform how you organize and present data in Holistics.
What Are Dashboard Tabs?
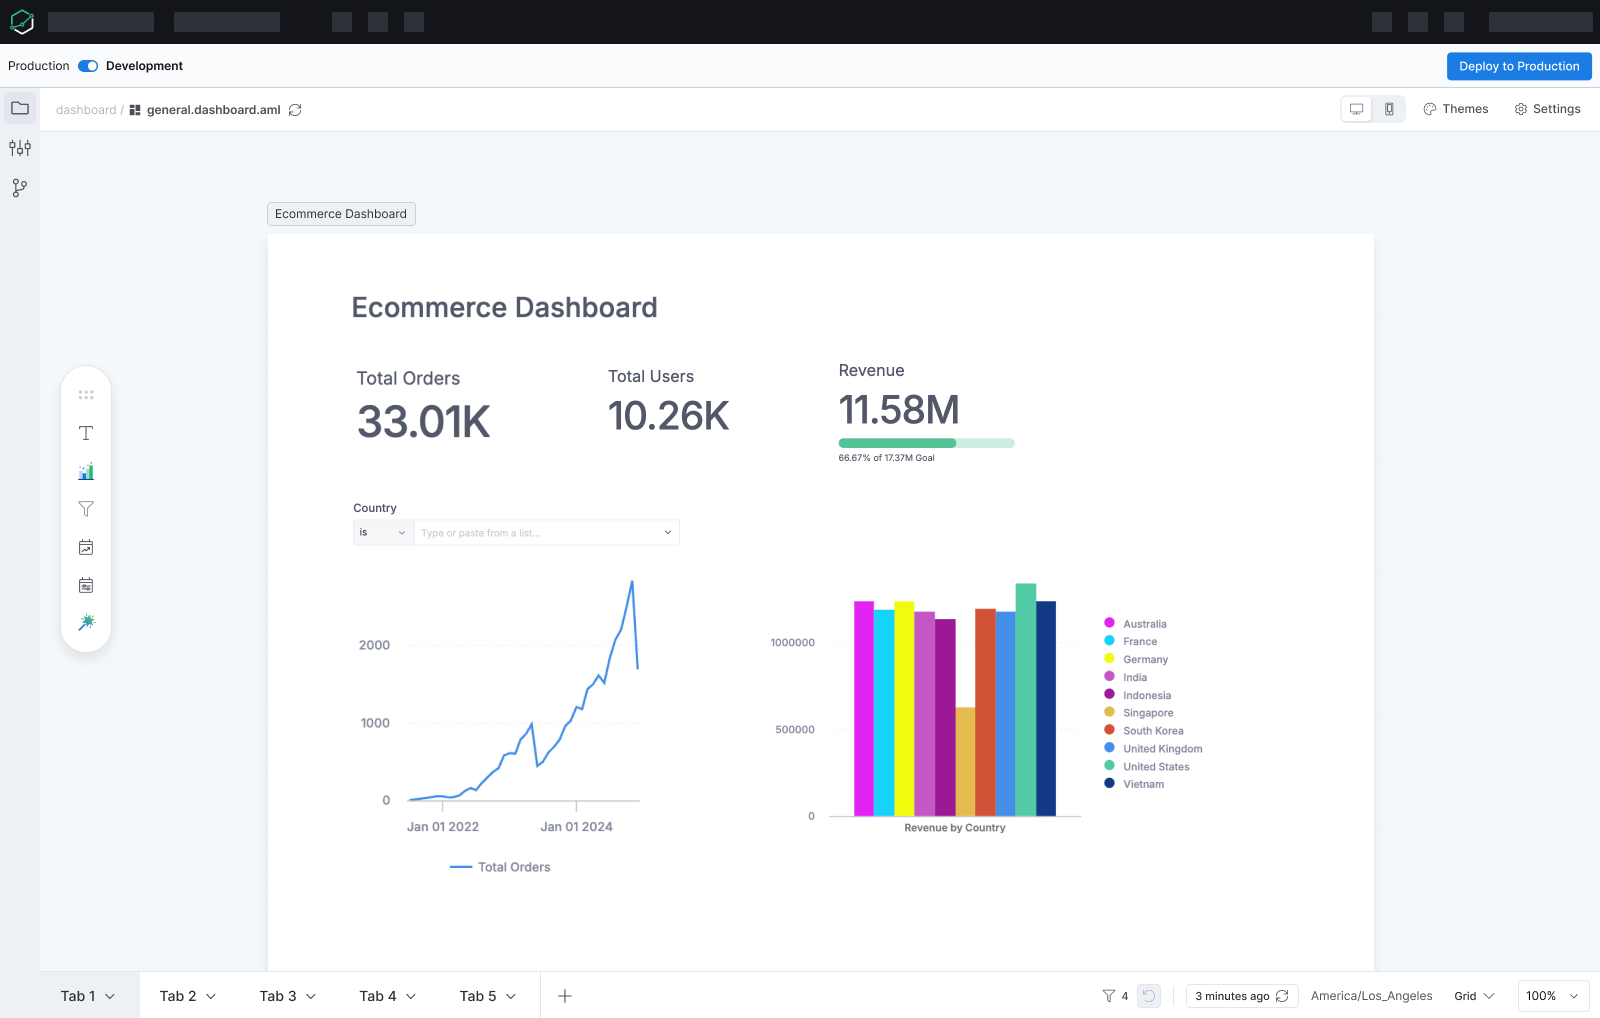
Tabs allow you to organize multiple views within a single dashboard, creating a seamless navigation experience for your users. Instead of scrolling through long dashboards or switching between separate ones, viewers can easily click between different sections of related content.
Simplifying lengthy, overwhelming Dashboards (that are currently divided by Text section breaks. Allow for each tab to address a more unique business question while still consolidating to a single theme and central place for seeing answers
Representing the exact same information but in terms of different unit of measure (think units per dollar versus units per pound. (In this example it would be neat if a change to one tab was made in other tabs. Ideally this use case is addressed in a different feature!)
In tabs, will each tab have its own filters or will there be the option of an overarching Dashboard control that applies to all tabs?
Hi @Theodore !
Really exciting to see this new method of report organization in beta form this week. I poked around a bit and found an odd bit of workflow when setting up a report for multiple tabs. When getting started, there is an option to create a second tab at the top. If you get started like normal, rename the tab you are on (previously the report visible title), and start adding charts, everything works as expected.
When I later decide to add a second tab to the report, a couple of odd things happen in the current version:
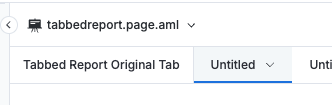
The charts on the initial tab are moved to a new tab in the report (Untitled Tab). A second Untitled Tab is created next to it.
The first ‘tab’ name is retained and appears to be its own tab. Clicking on that section does not take you anywhere.
I don’t think this is a breaking issue, but it does introduce a bit of an odd workflow. Perhaps shifting the initial ‘tab name’ section up next to the file name will help to enforce that this is not a tab name, but a report name similar to how Canvas Dashboards normally work.
Overall, the ability to organize data stories in this method is really valuable. I also found tabs not currently viewed don’t load all of their charts and incur costs when filters are adjusted. This could be a really great method to limit costs on complex data stories by only running charts relevant to the user at the moment, rather than running jobs for each chart every time (even if the user is just scrolling past!)
And to @Victoria_Rehkugler 's question above, filters and cross-filters appear to work well across different tabs. I tried out a couple of workflows, but your mention of an overarching dashboard control (maybe on its own tab) does work in beta.
Hi @Victoria_Rehkugler, thank you for sharing your use cases. Tabs is now available in Beta.
In tabs, you can selectively apply filters to charts in all tabs or within a particular tab. To control this, go to Edit Filters > Update Visualizations and select the charts you want to apply filters to.
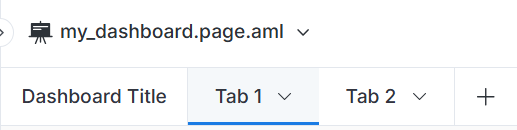
I understand the confusion. The initial slot is actually designated as the title for the entire Dashboard. When a new tab is added, the original content shifts to the first tab, labeled Untitled, and you are directed to a new Untitled tab.
We can definitely explore ways to improve this and eliminate any confusion.
Hi data nerds! We’re excited to announce that Dashboard Tabs is now available in open beta. This highly requested feature has been rolled out to all users a few weeks ago, and we can’t wait to see how you’ll use it to create more organized and performant dashboards.
What is Dashboard Tabs?
Dashboard Tabs allows you to organize your dashboard content into separate tabs, creating a more structured experience for your viewers. With this feature, you can:
Divide your content into consumable sections: Break down complex dashboards into logical groupings that are easier to navigate and understand
Optimize dashboard performance: Content on each tab is lazy-loaded, meaning elements only load when a tab is viewed
Synchronize content across tabs: Create sync copies of visualizations, filters, and other elements across multiple tabs
Share Your Feedback
We’re continuously improving Dashboard Tabs. Please share your experiences, suggestions, and any issues you encounter in this thread or by contacting support.
Happy dashboarding!
Note: Dashboard Tabs is currently in open beta. While fully functional, we may make adjustments based on user feedback before the final release.