A histogram is really useful when you have many discrete dimension values that you need to bring together in a chart. Without a histogram, in these cases you need to hard code the value ranges as custom dimensions.
Hey Alex, good idea! I guess with a native histogram feature, you need the flexibility to define the number of buckets and their size?
Yes, it’s common to define a histogram in one of two ways;
- Bin Size/Width
- Number of Bins
But you would usually also get an underflow / overflow option to handle long tails of data.
I would suggest there is some ‘auto’ logic which tries to give best fit, but also allow the analyst to define the values.
Examples:
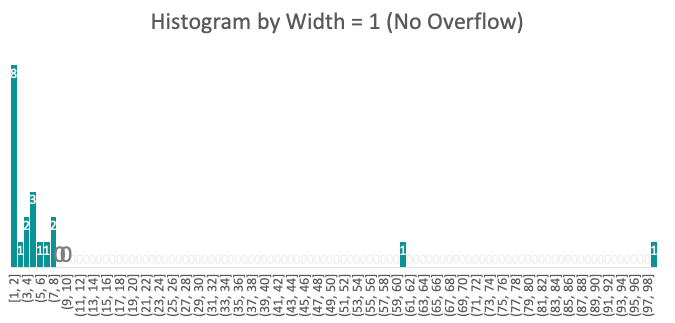
I have a range of integer values, most within 1-10 range, but a few outlier…
1,3,4,1,2,8,1,2,6,5,4,7,2,5,99,5,1,8,1,61
Imagine it’s the ages of people in a classroom perhaps ![]()
Here, I’ve created a histogram using fixed bin width of ‘1’, but this isn’t that useful, as the outliers are skewing by chart
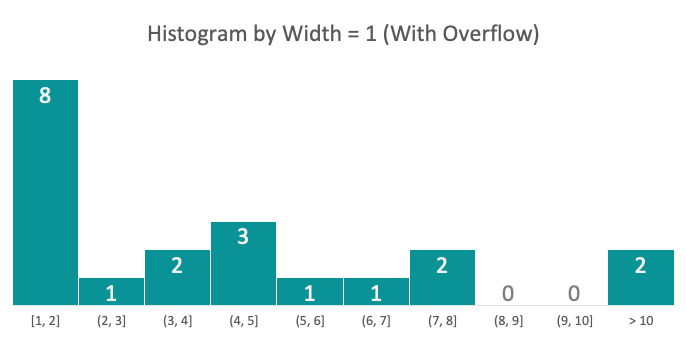
This time, I keep a bin width = 1, but set an overflow =10, so anything over 10 gets bundled together.
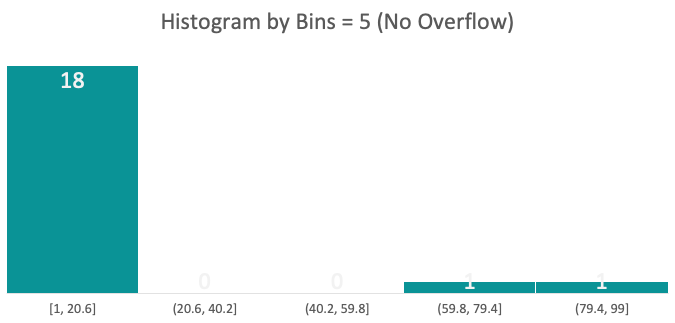
The other type is setting the number of bins.
Here, I want to bin my data into 5 bins. Because I have a few outliers, my bin size becomes pretty large, and the distribution loses meaning.
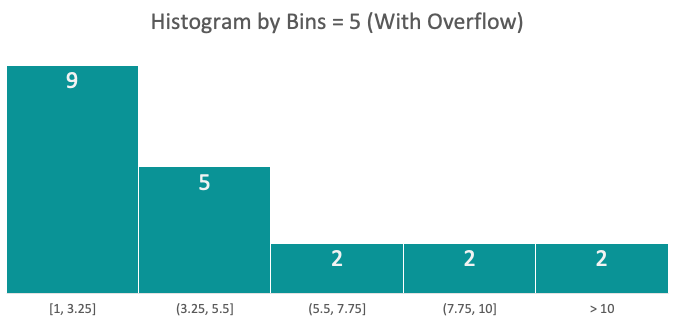
Still using fixed number of bins, but setting an overflow again
4 Likes
Incidentally, I’d also include ‘box & whisker’ / ‘box plot’ visualisation types, as that’s the other common chart for data distribution.
1 Like
Thanks David for the examples, they helped me out at the underflow/overflow part!
We have a plan to support Custom charts in Holistics very soon. Let me see if it can cover the histogram as well.
2 Likes