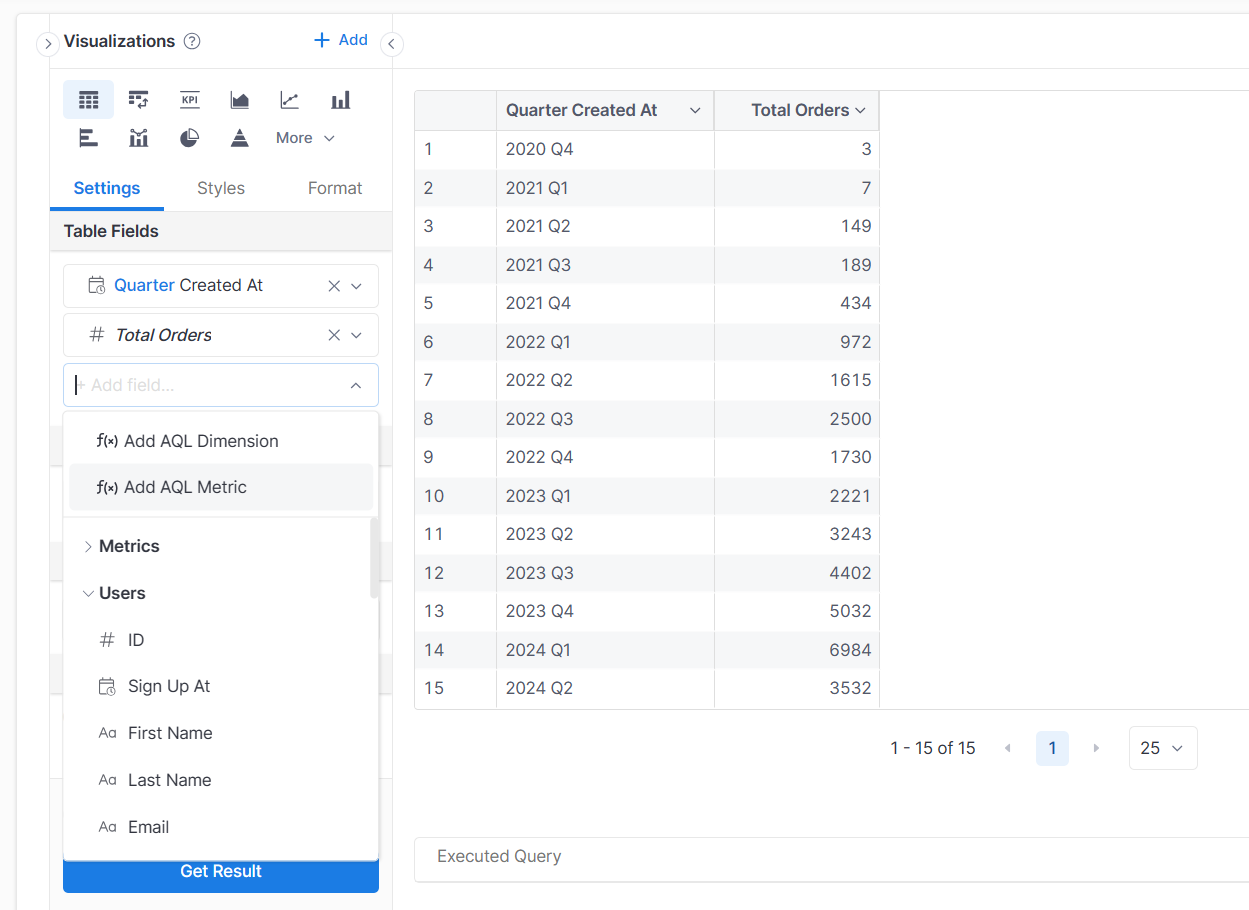
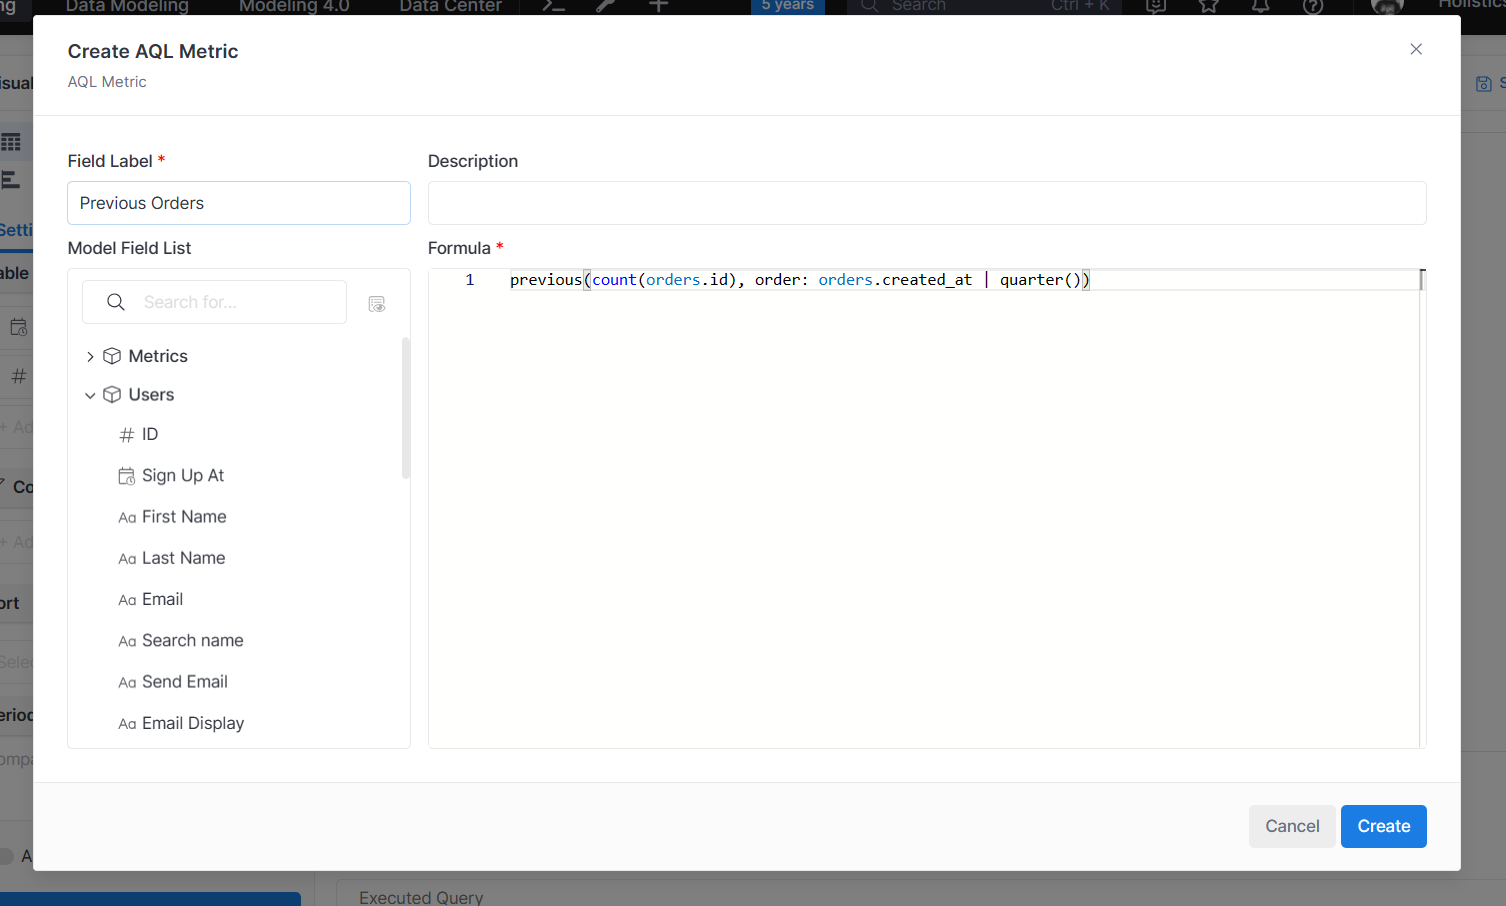
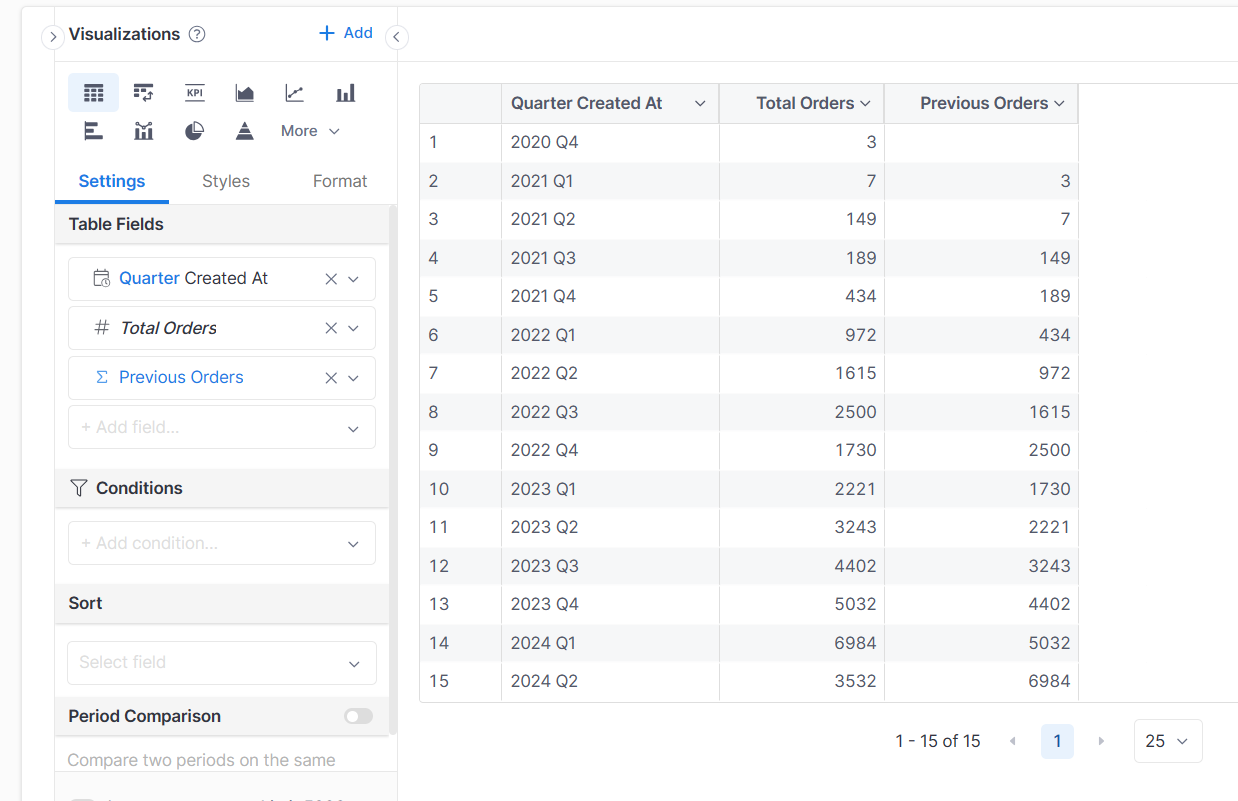
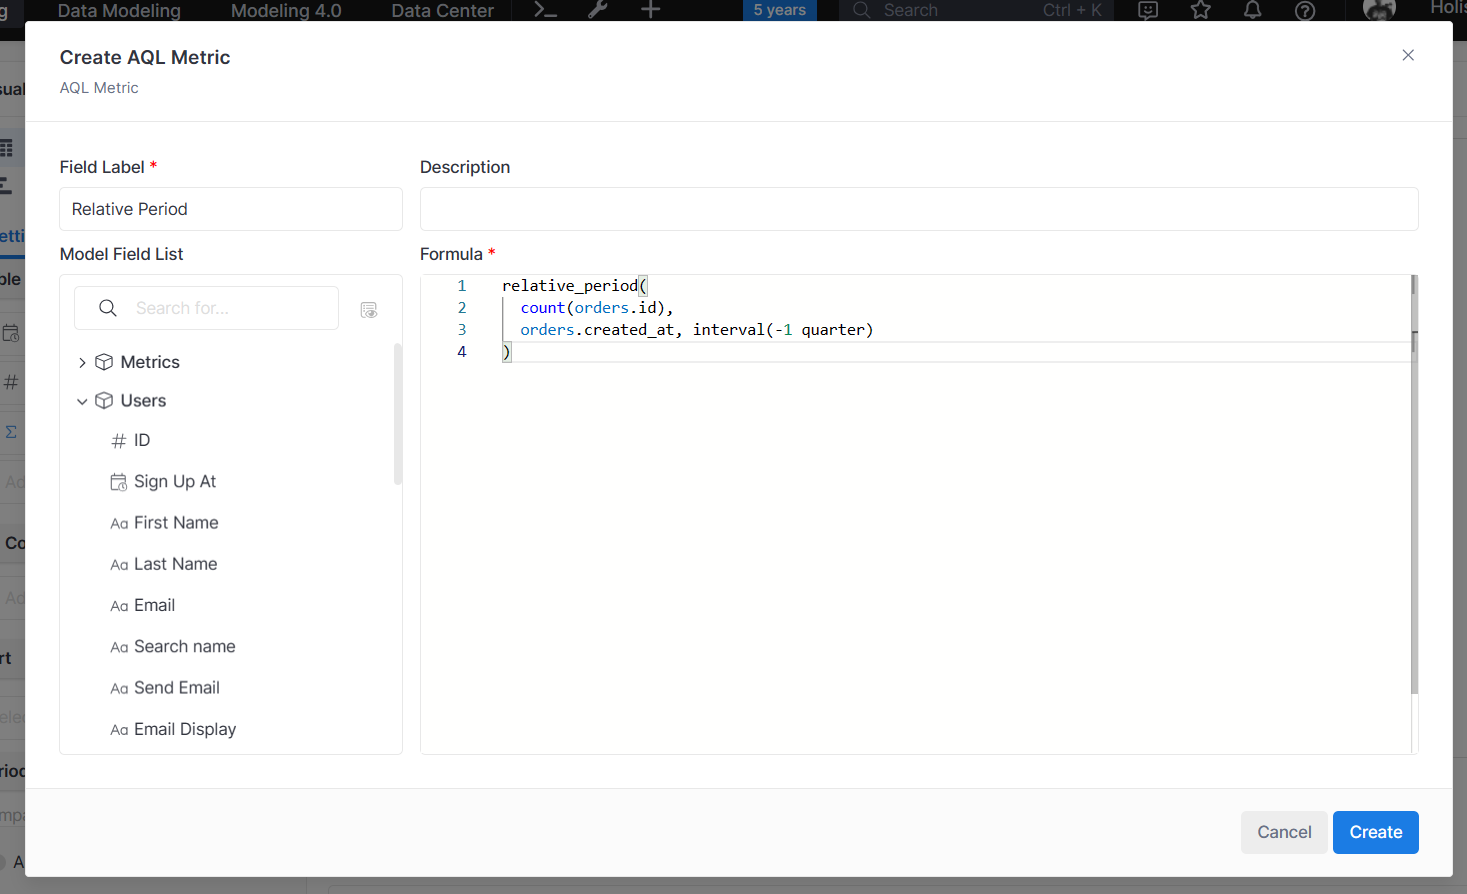
Hey Guys, Im evaluating Holistics over Looker. Im trying to understand how i would code a measure that allows me to have % change in my chart, in looker this is easy to do in built in table calculations . In SQL this would use a lag function. Im trying the below, defining a sum measure of units, then using a window function to get the percentage change from a time dimension. However, when i run it im getting an error that transaction date isn’t grouped or aggregated. any help would be appreciated!
select
  transaction_date,
  sum(transaction_units) as transaction_units,
  ((sum(transaction_units) - LAG(sum(transaction_units)) OVER (ORDER BY transaction_date)) / LAG(sum(transaction_units)) OVER (ORDER BY transaction_date)) * 100 AS percentage_change
from fct_combined_retail_transactions`
group by 1
Thanks Khai, i really appreciate you making this so clear for me. I think i need to spend some time going over your docs so i can understand the different modelling layers. The problem i have right now is that i don’t have much time for an evaluation and need to get to the point of understanding how much transitioning from Looker is going to cost, in terms of team time.
Hi @Chris_Wood, if you are coming from Looker, Holistics’ AML should be largely similar conceptually as both has a declarative, code-based semantic layer with support for SQL-based measure/metric definition. Here are the main differences when it comes to modeling between the 2 tools:
LookML’s explore uses explicit join type from a specific LookML view while Holistics’s dataset uses relationship typewithout a specific starting table/model (and compiles to appropriate join type at runtime). As a result, Holistics is more flexible as the join can be dynamically chosen to fit the use case. On the other hand, Looker gives more explicit control over the join type of the generated SQL but this control is only static (which has its own downside). The consequence is that Holistics and Looker handle fan-out problem differently. Holistics chooses the right join type to avoid the problem while Looker uses symmetric aggregates.
Looker only supports SQL to define metrics while Holistics supports both SQL and AQL to define metrics. Holistics AQL metrics are more robust than SQL ones and can support more use cases natively instead of depending on dimensional modeling (building derived tables) with SQL. For example, calculate cumulative sum in Looker requires a derived table while it is a one-line of code in AQL using running_total or window_sum/window_avg function. Another example is nested aggregation in Looker vs Holistics. The downside of Holistics is that there is a learning curve associated with using AQL.
AQL also acts as a more powerful/robust replacement for Looker’s table calculation as it can work on both the underlying SQL as well as the visible table results. The disadvantage, again, is the learning curve.
You can say that from high level perspective, Holistics’ semantic layer is more abstract than Looker’s (due to being further from SQL) while Looker’s gives you more control over the generated SQL query.
We are considering writing a script to generate AMQL code from a LookML project but the conceptual/product differences above are still worth considering during the migration. How much effort your team will need to spend will depend mainly on the differences above.