Hello Team,
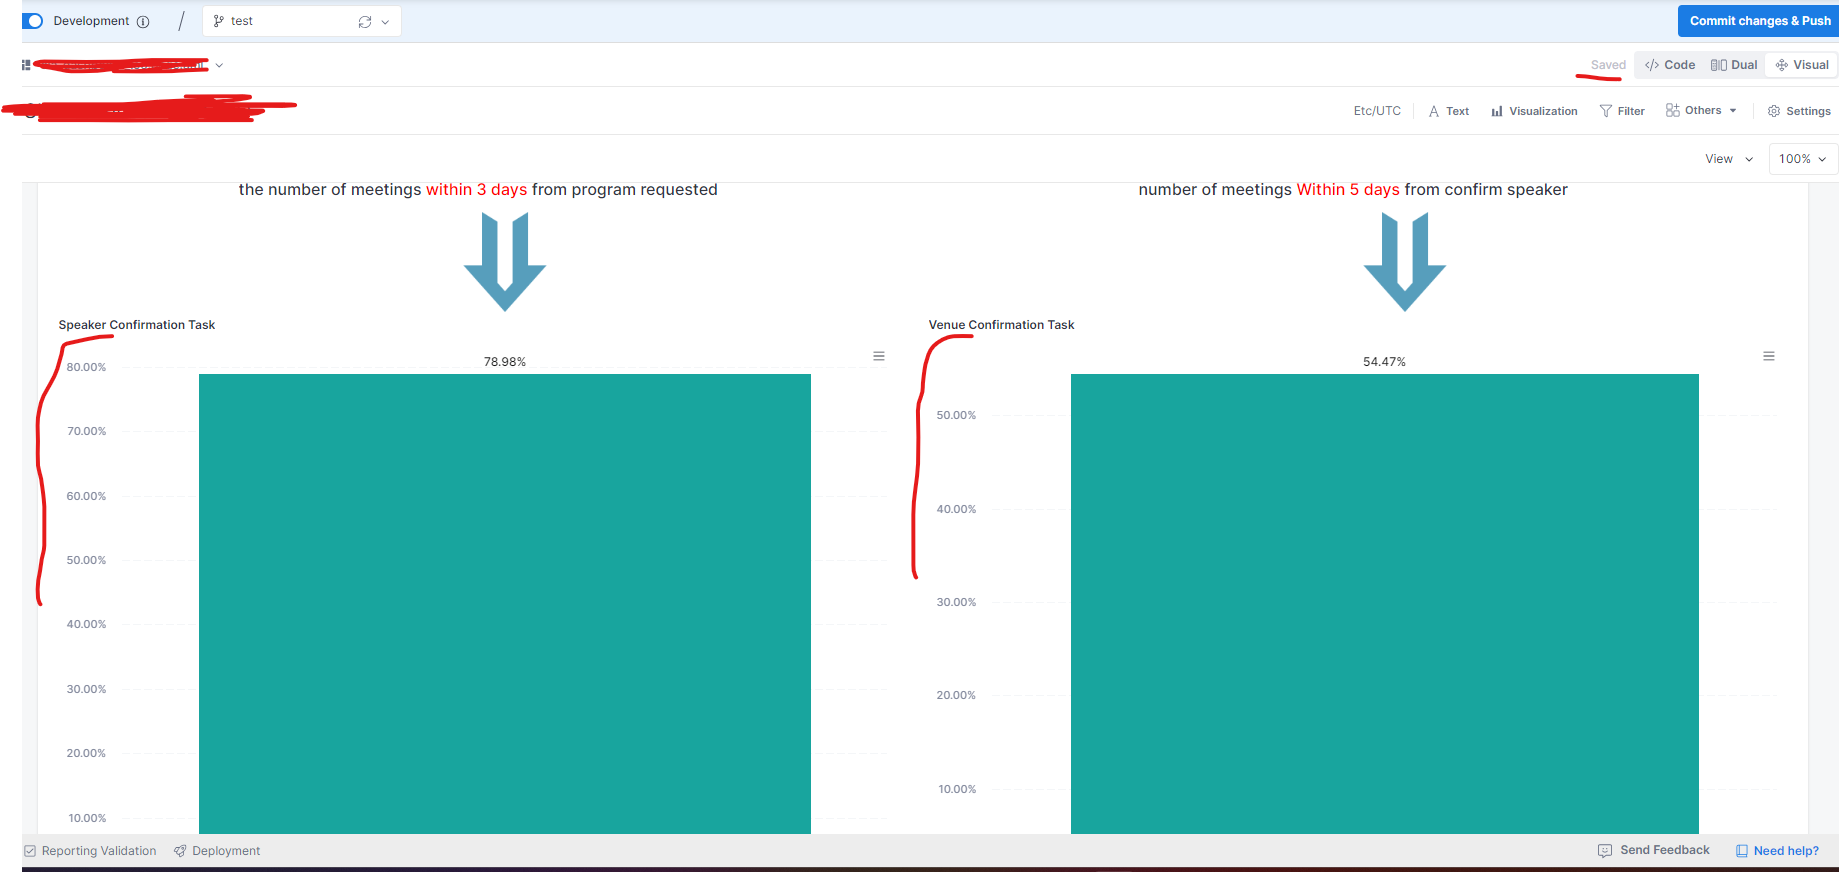
The problem is when I click on Save Changes button the Max values in the left changed!! … See below after I clicked on the Save button
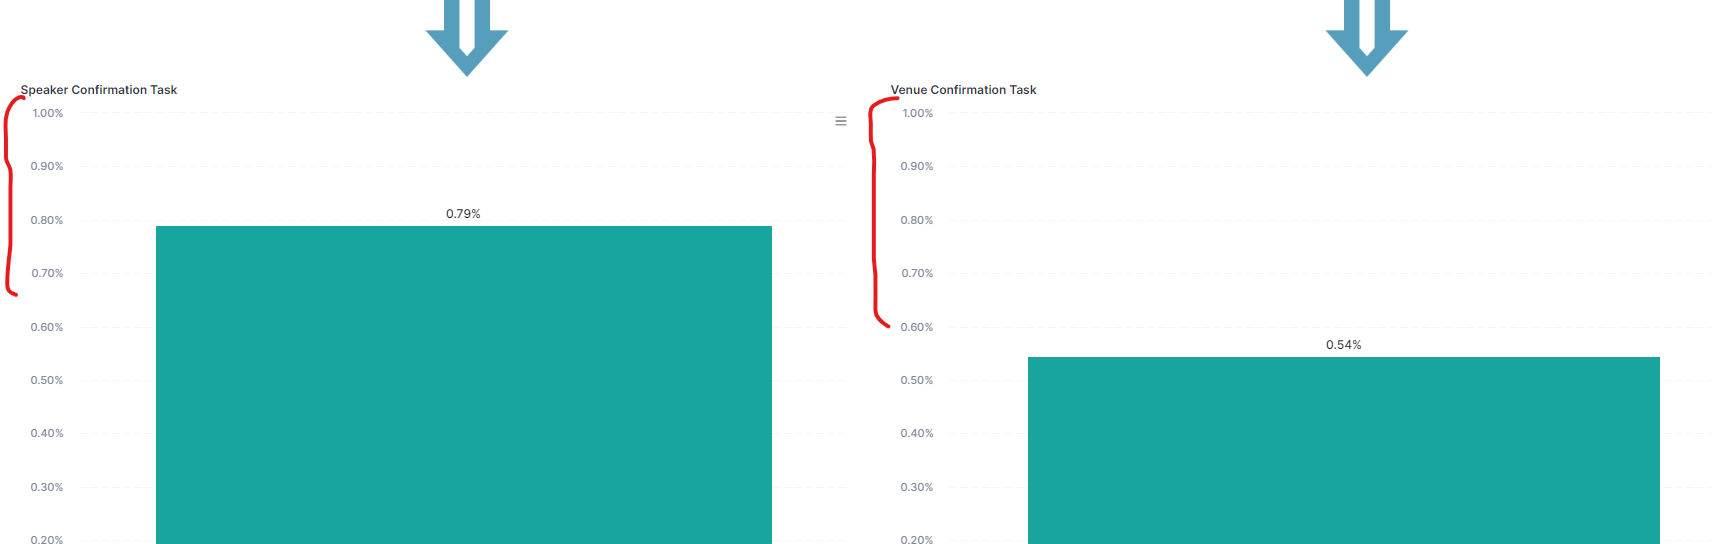
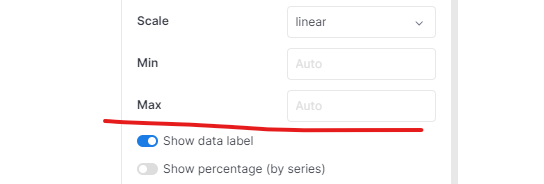
Why that happened after I saved the changes … When I go back to the settings to see the Max option it was empty … See below
Is this something we can’t save it or use it for example
Please advise
1 Like
kaid
March 4, 2024, 3:12am
2
Hi @Hamza_rashed ,
Thanks for reporting this issue! After checking we found this is a bug in canvas dashboard.
Best regards,
kaid
March 4, 2024, 3:22am
3
While waiting for the fix, as a workaround, you can manually edit the dashboard code to set max limit for your chart.
While editing the dashboard:
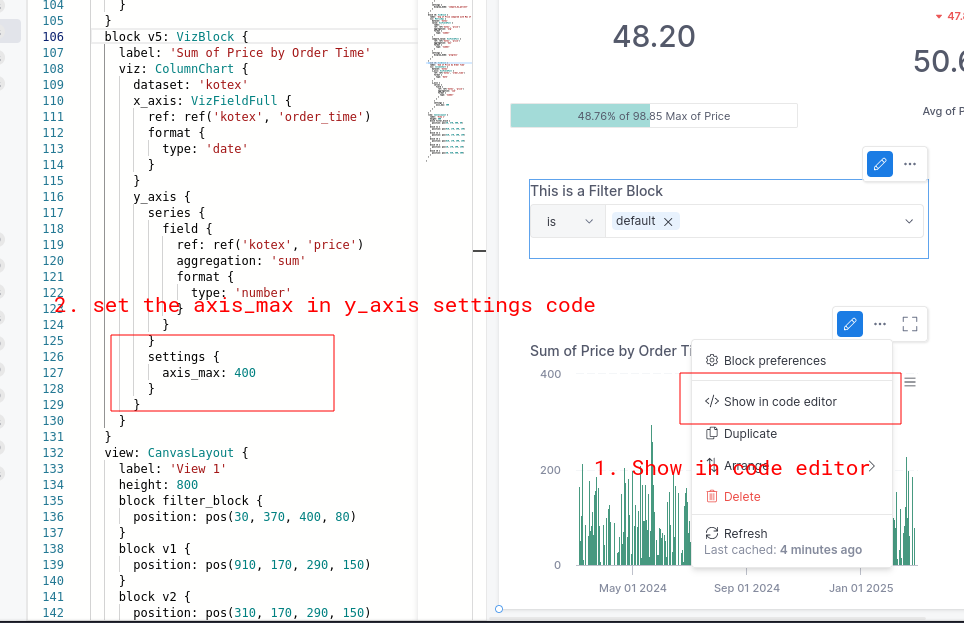
Click on the viz block’s action menu, then click on Show in code editor to view the code of your viz block
find the y_xis code, and add the settings block with the content similar to the screenshot below
Save/preview again
Bao_Le
March 12, 2024, 8:50am
4
Hi @Hamza_rashed ,
1 Like