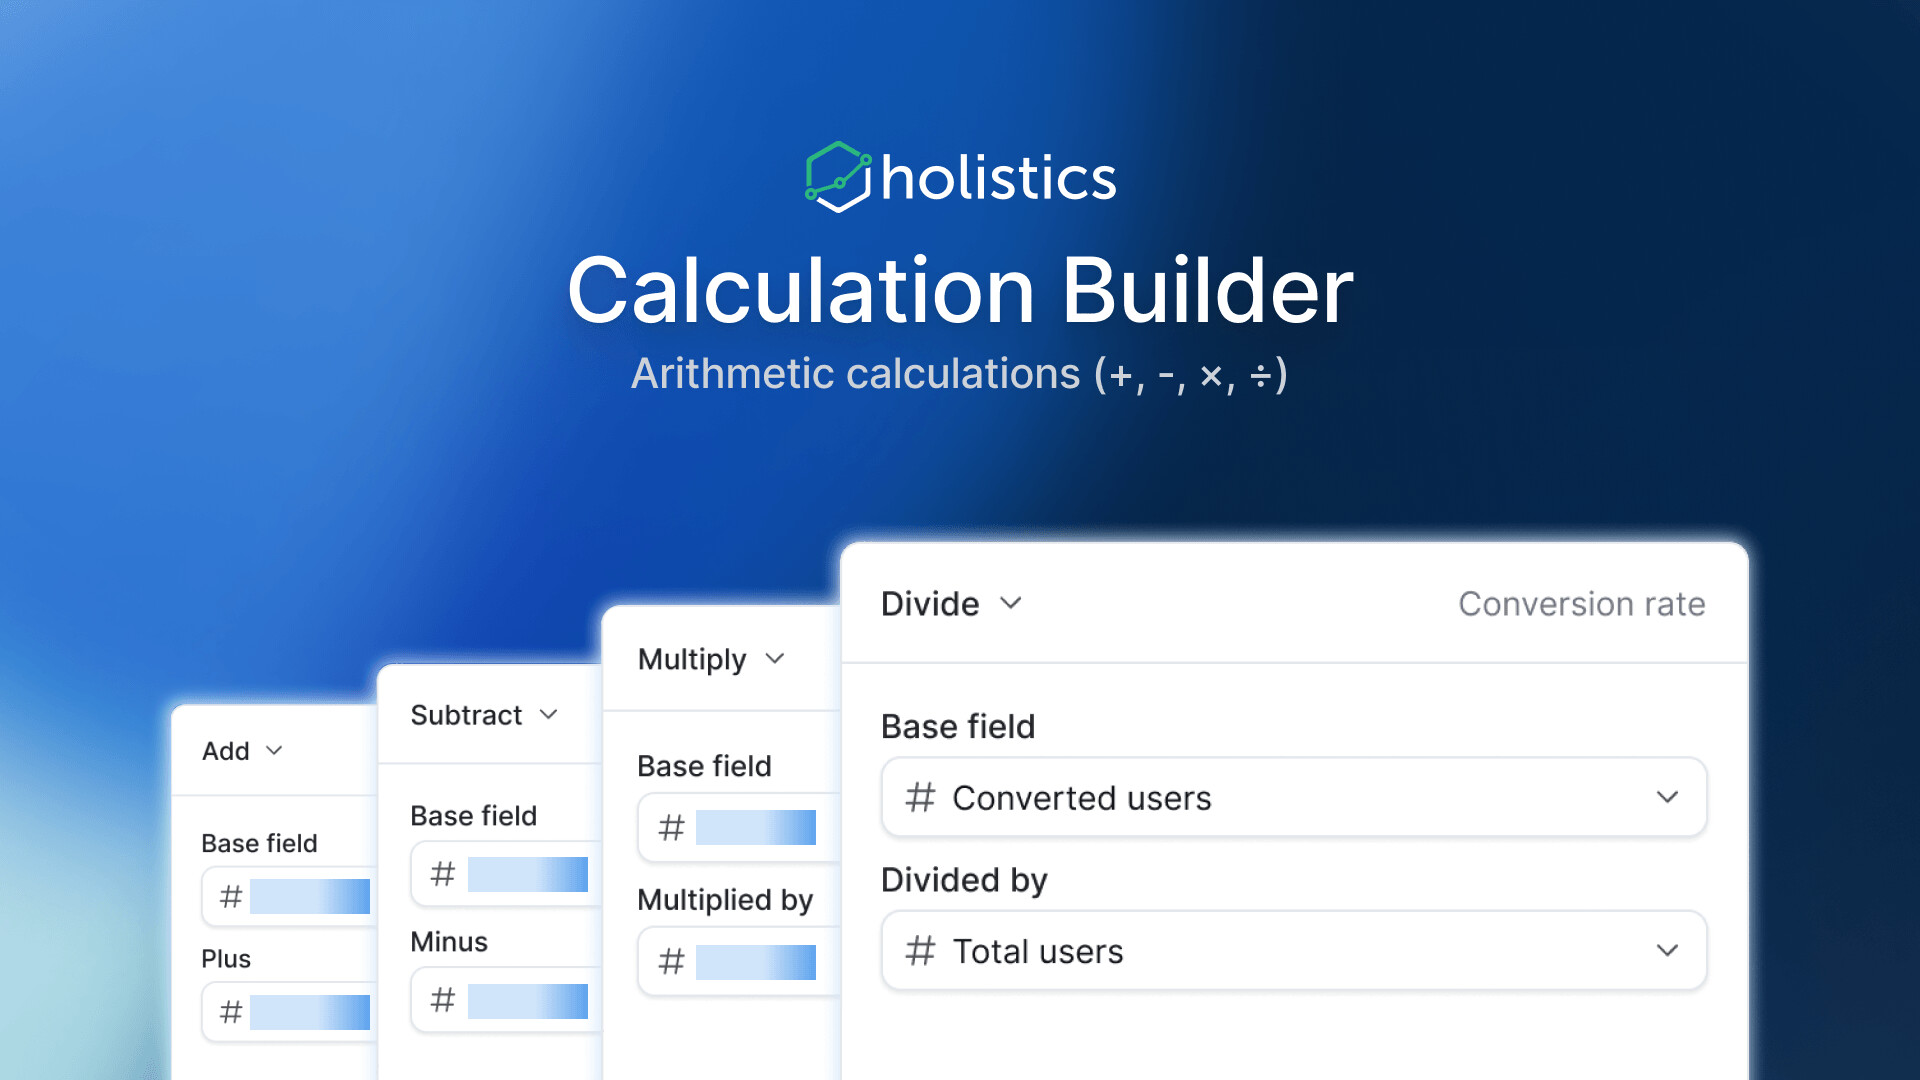
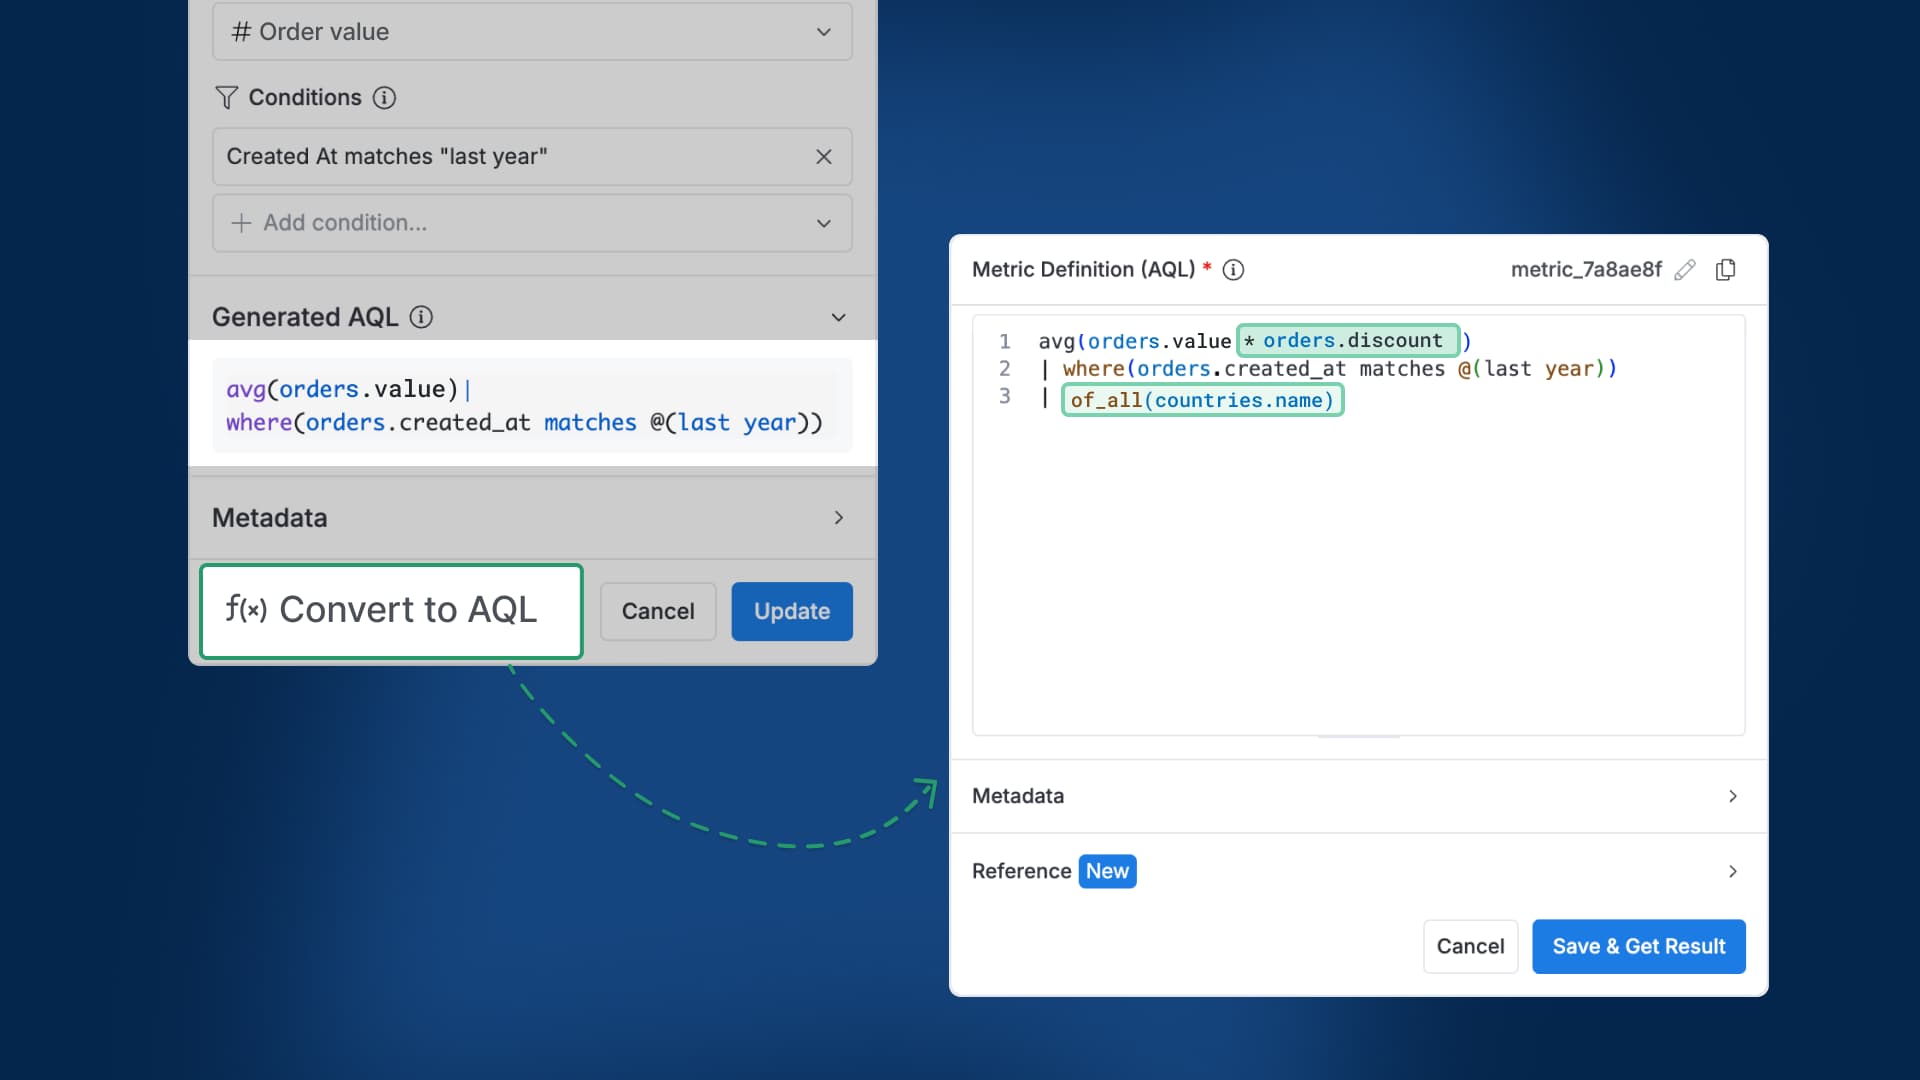
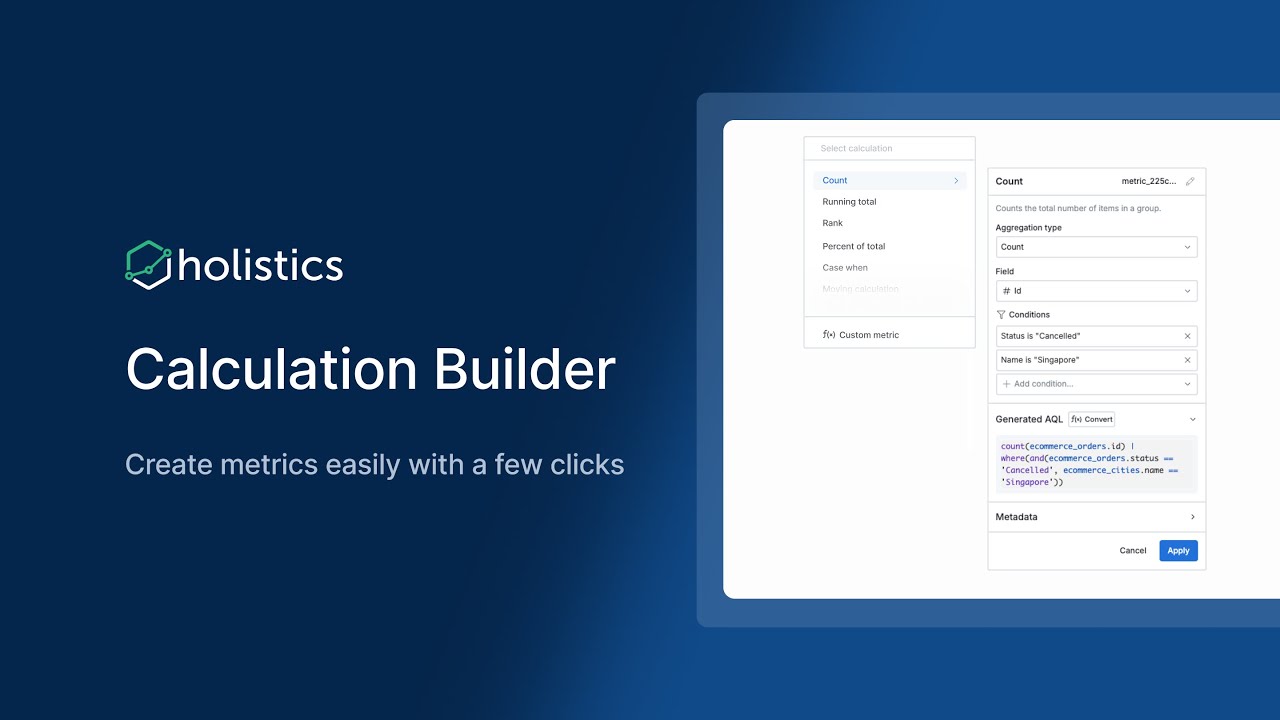
AQL lets analysts build complex metrics much more easily, but learning it takes time. And we know not everyone has that luxury. That’s why we’re building Calculation Builder to let you tap into the full flexibility of AQL, through a point-and-click experience anyone can use.
Why you’ll love it
Zero coding required: Create, customize, compose metrics with just a few clicks.
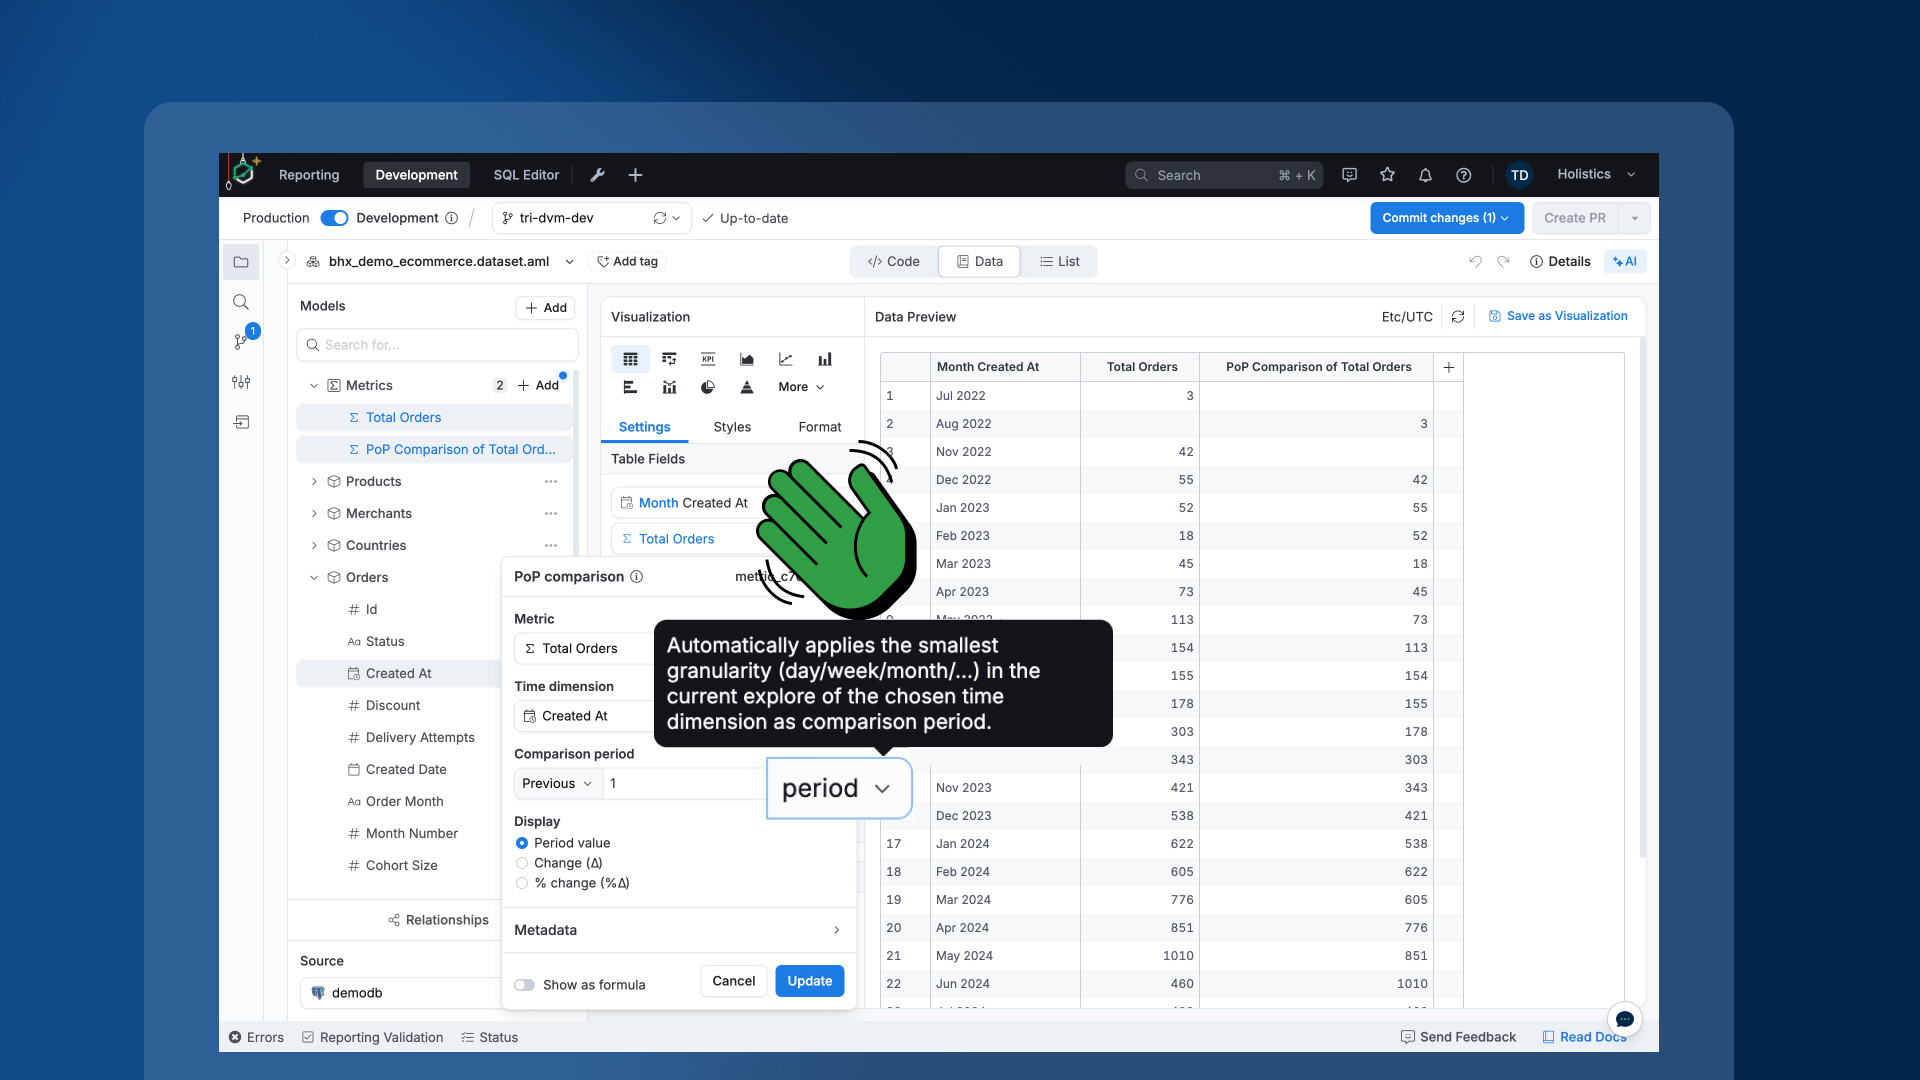
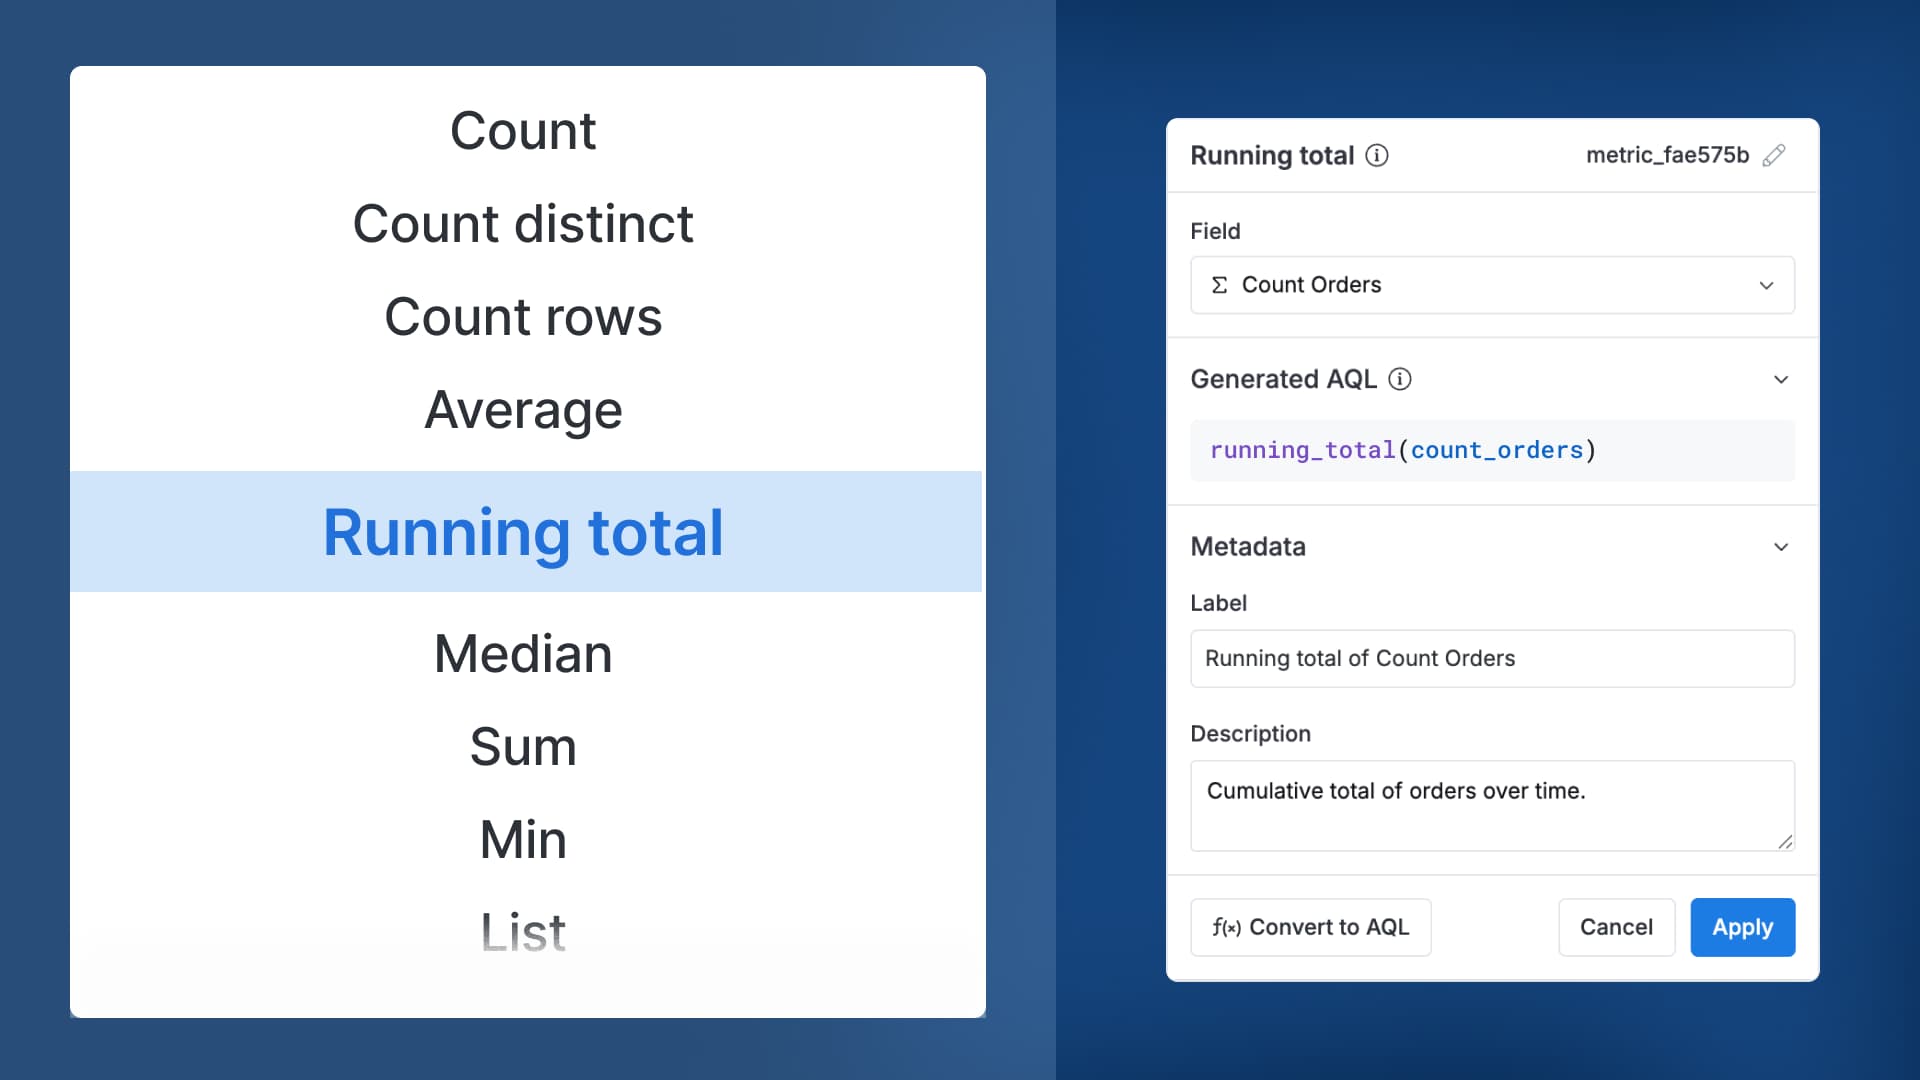
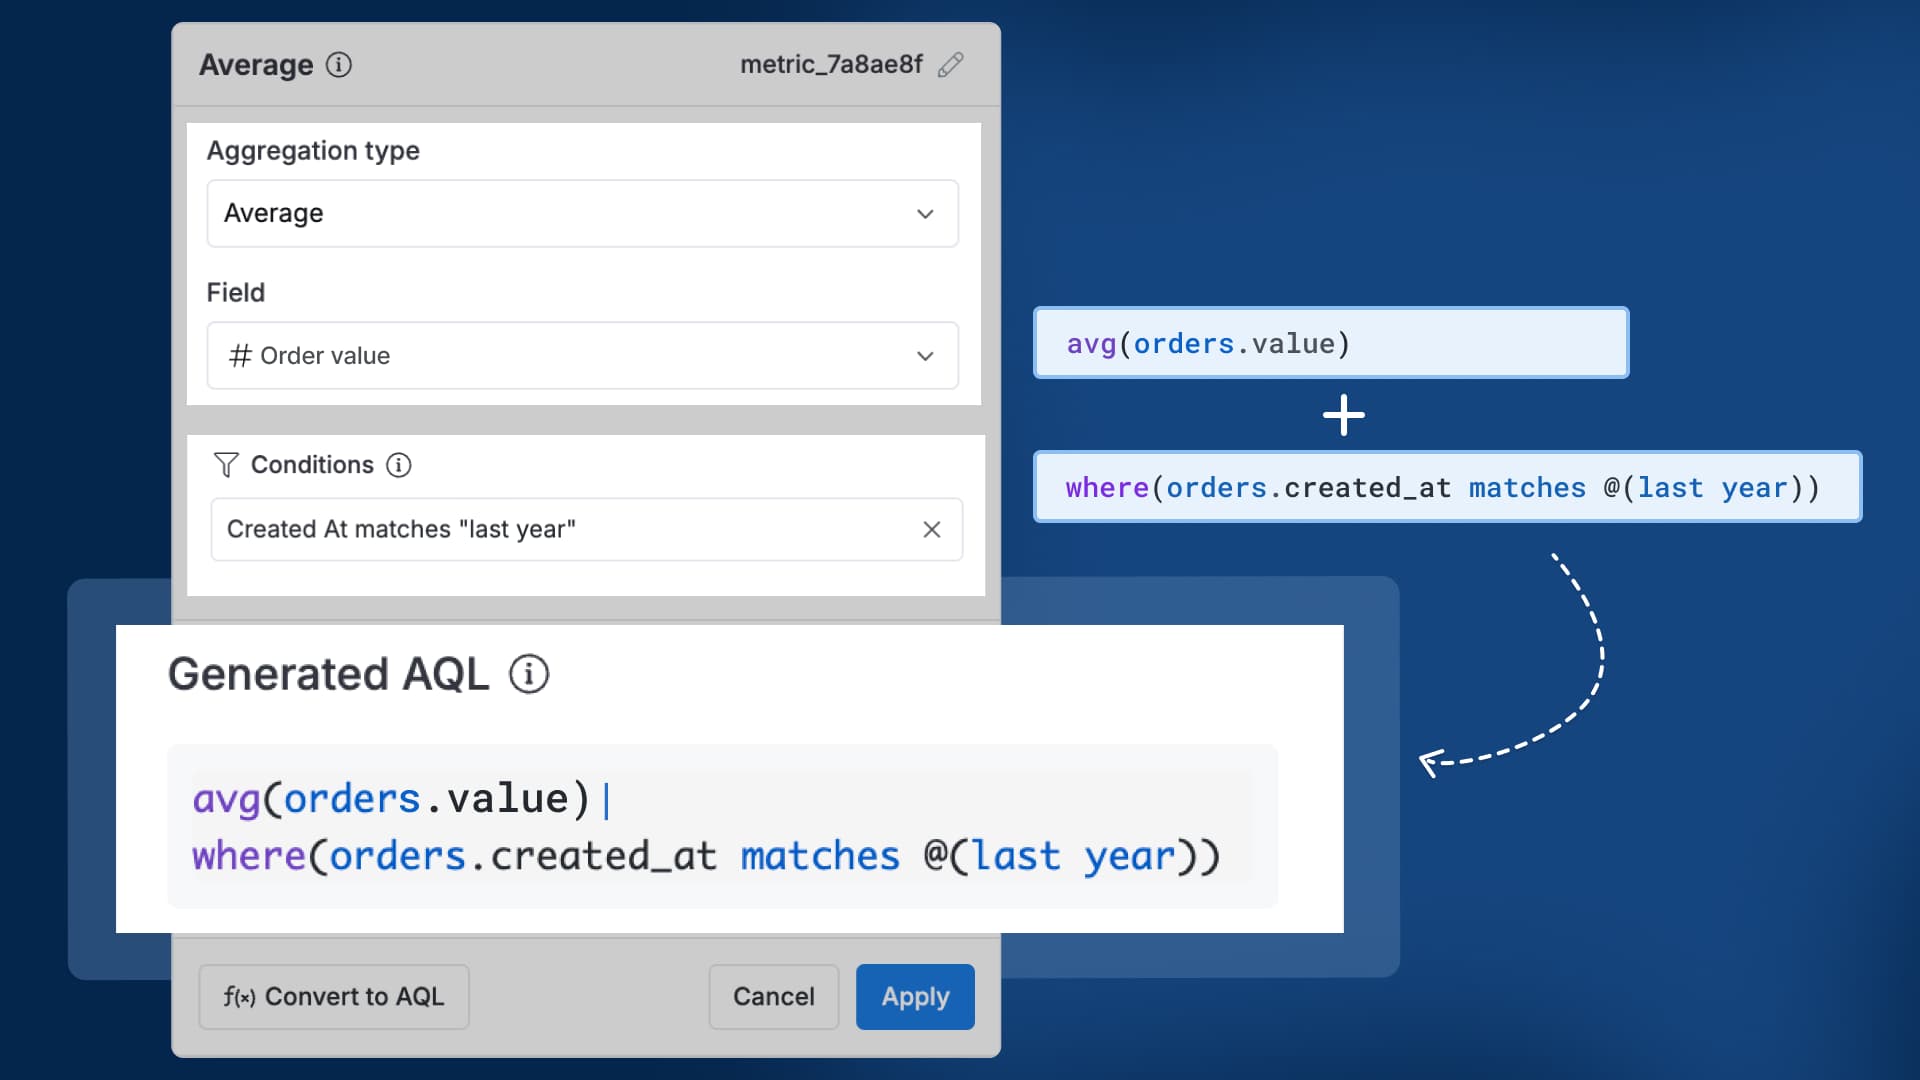
Calculation Builder currently supports all basic aggregations (count, sum, average), conditional aggregations (count if, sum if), running totals, and more - all through a simple point-and-click interface.
Share your feedback
Calculation Builder is currently in beta. We’re still polishing things up, so some behaviors or options may evolve. Your feedback is incredibly valuable - let us know what works, what doesn’t, or what you’d love to see next!
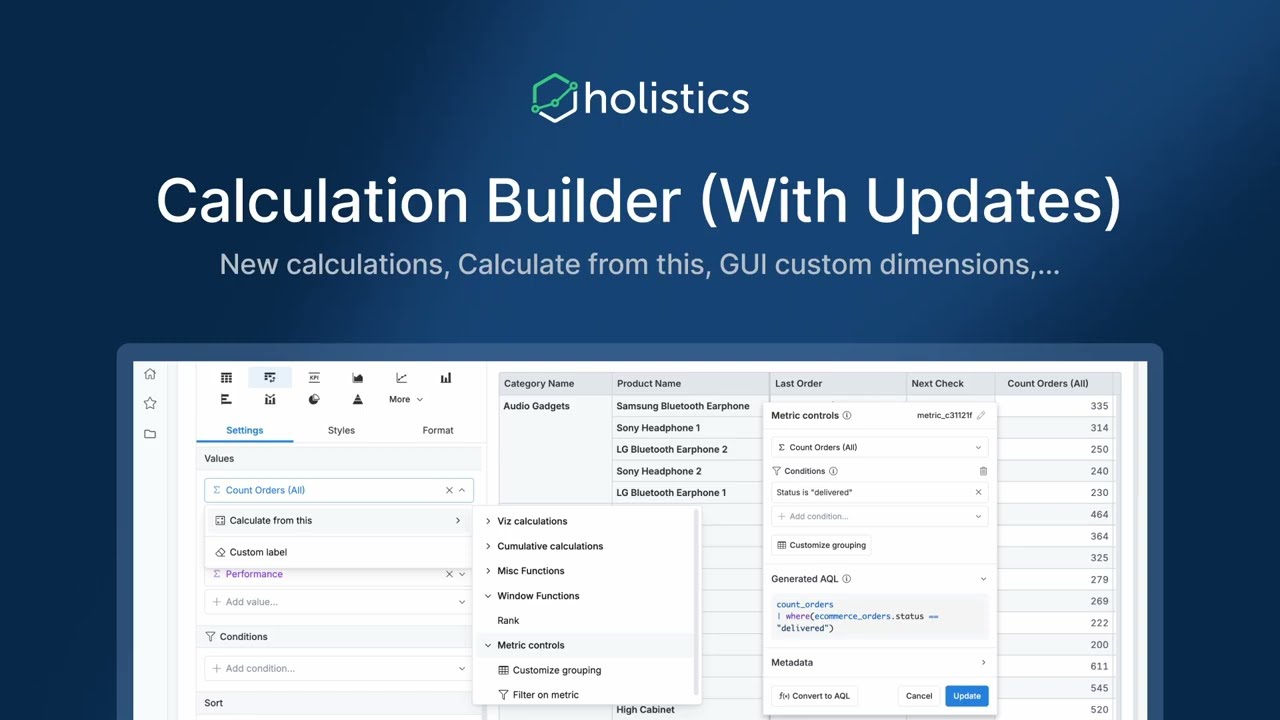
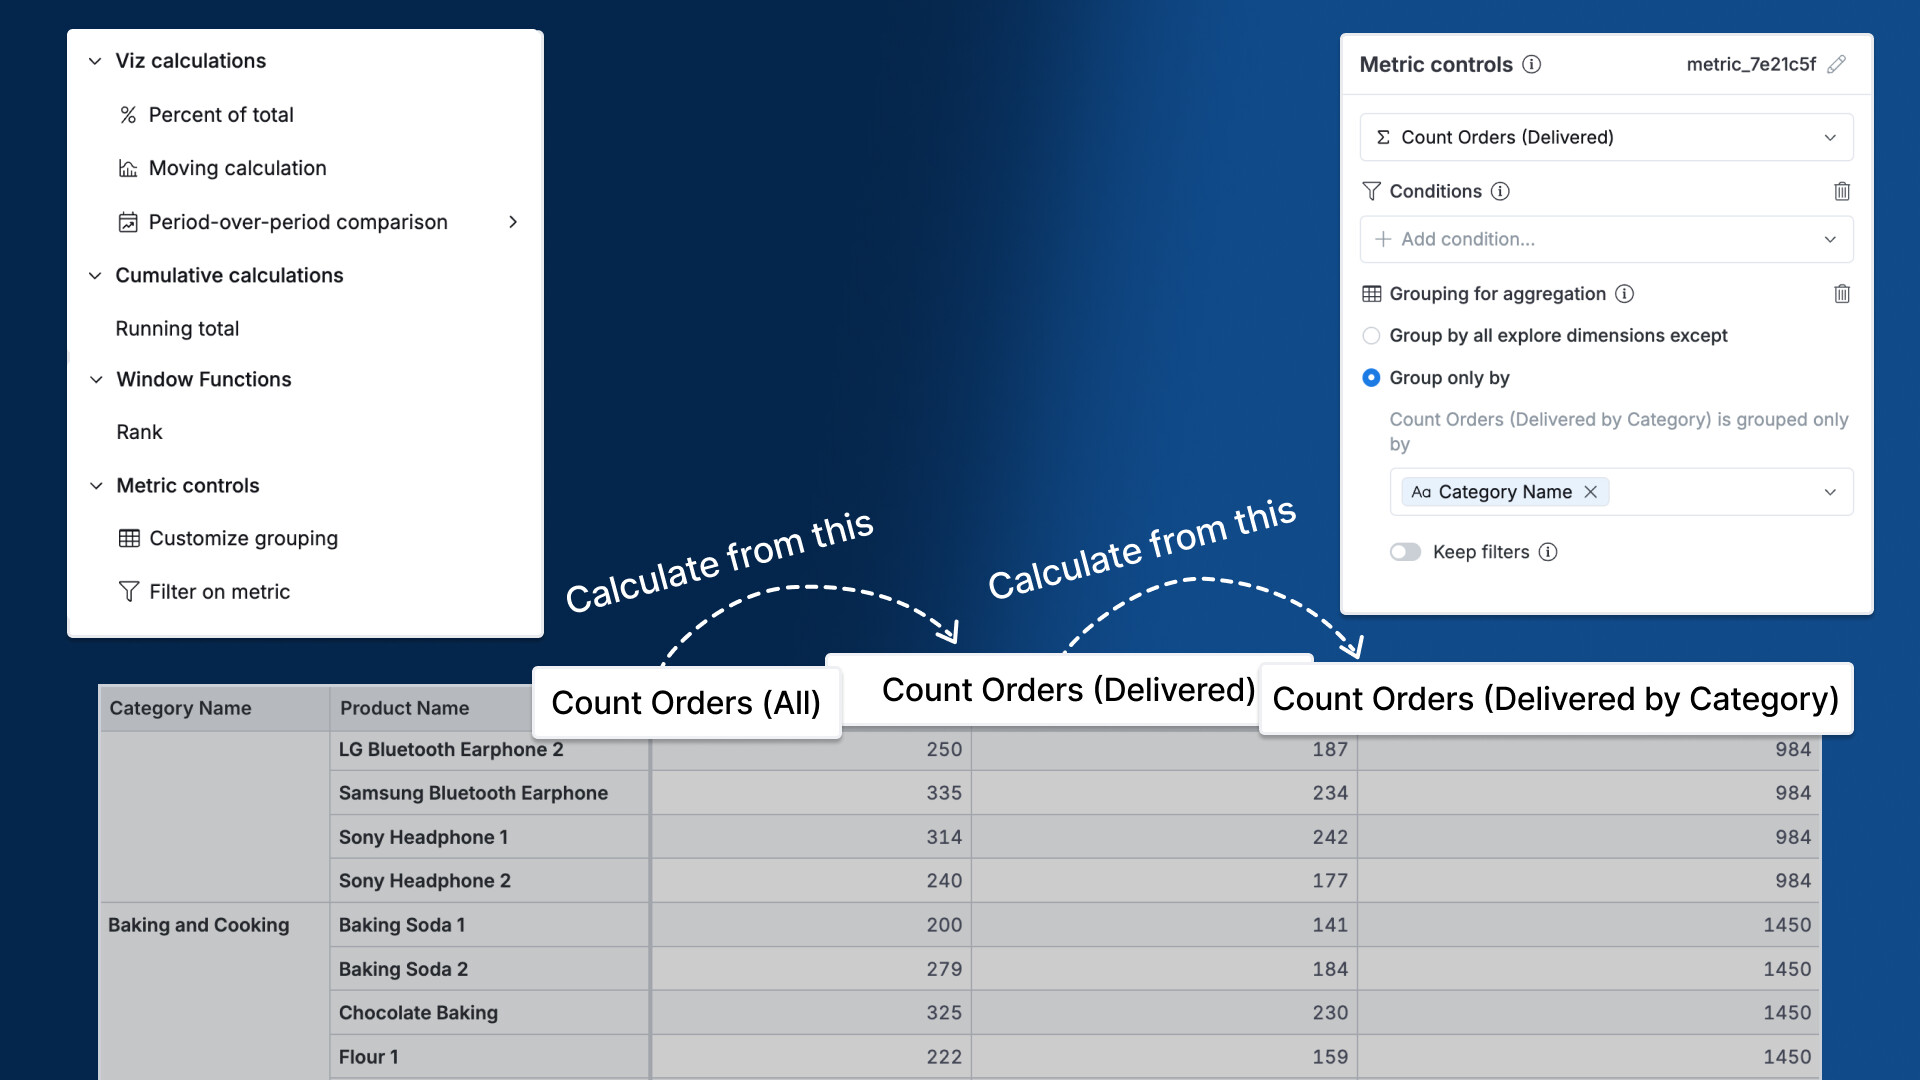
Calculation Builder (Updates): New calculations, Calculate from this, GUI custom dimensions, Metric controls
Hi folks, building fields just got easier
Our latest Calculation Builder updates will give you more ways to work with ease.
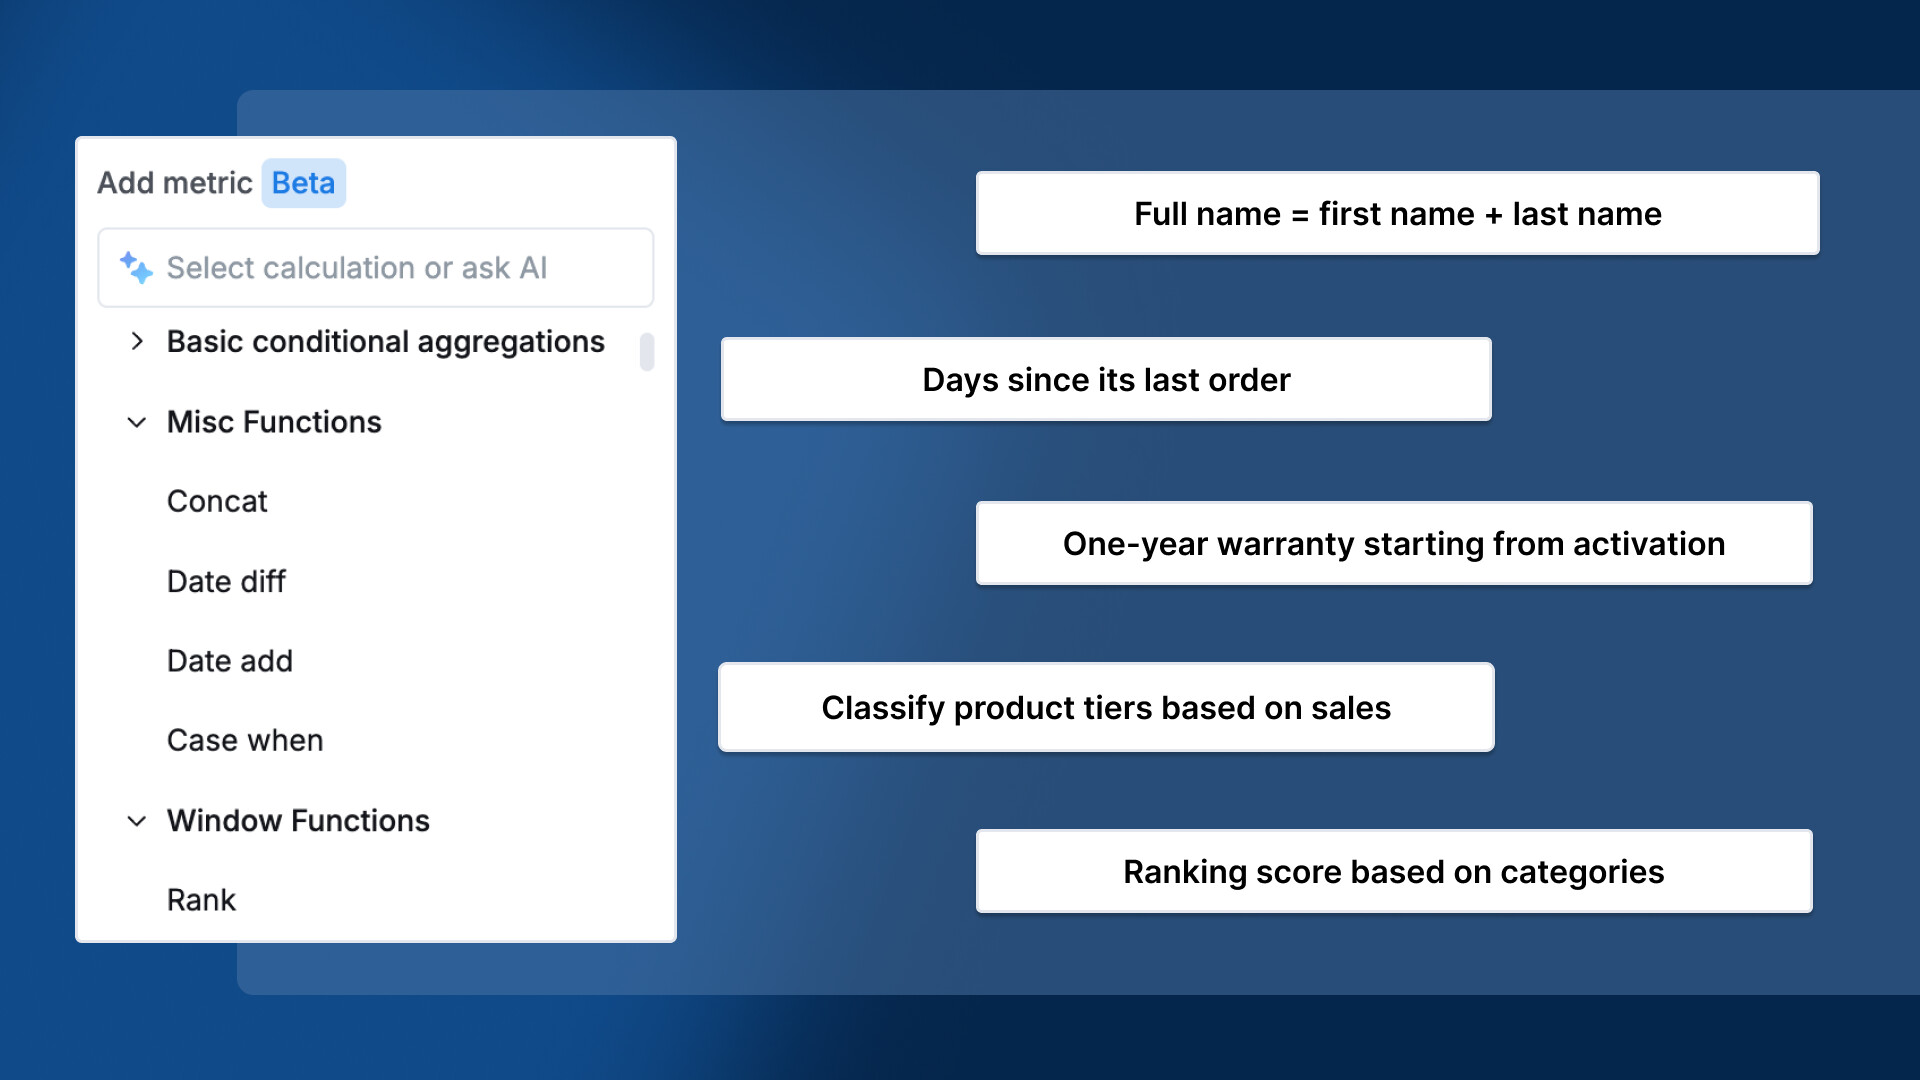
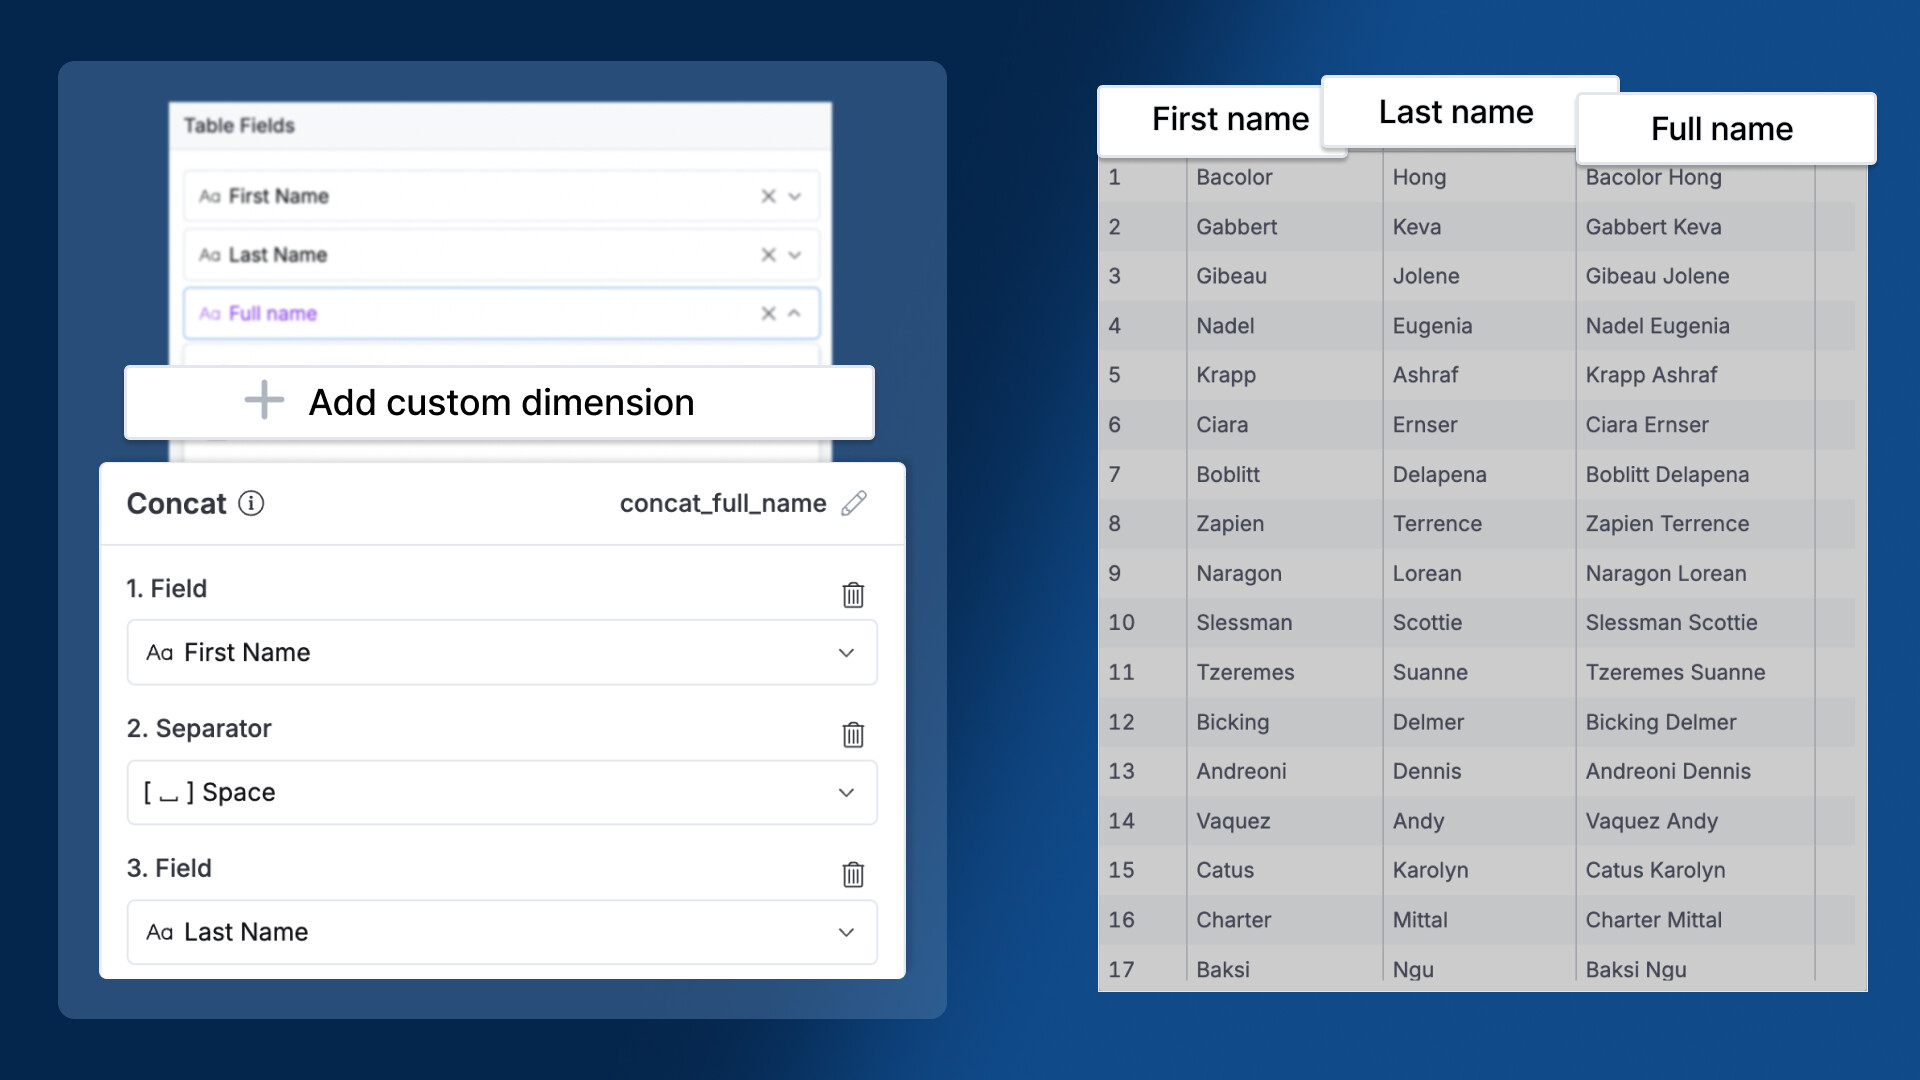
New calculations: Concat, Date difference, Date add, Case when, and Rank – enabling you to work with text, dates, rankings, and classifications intuitively.
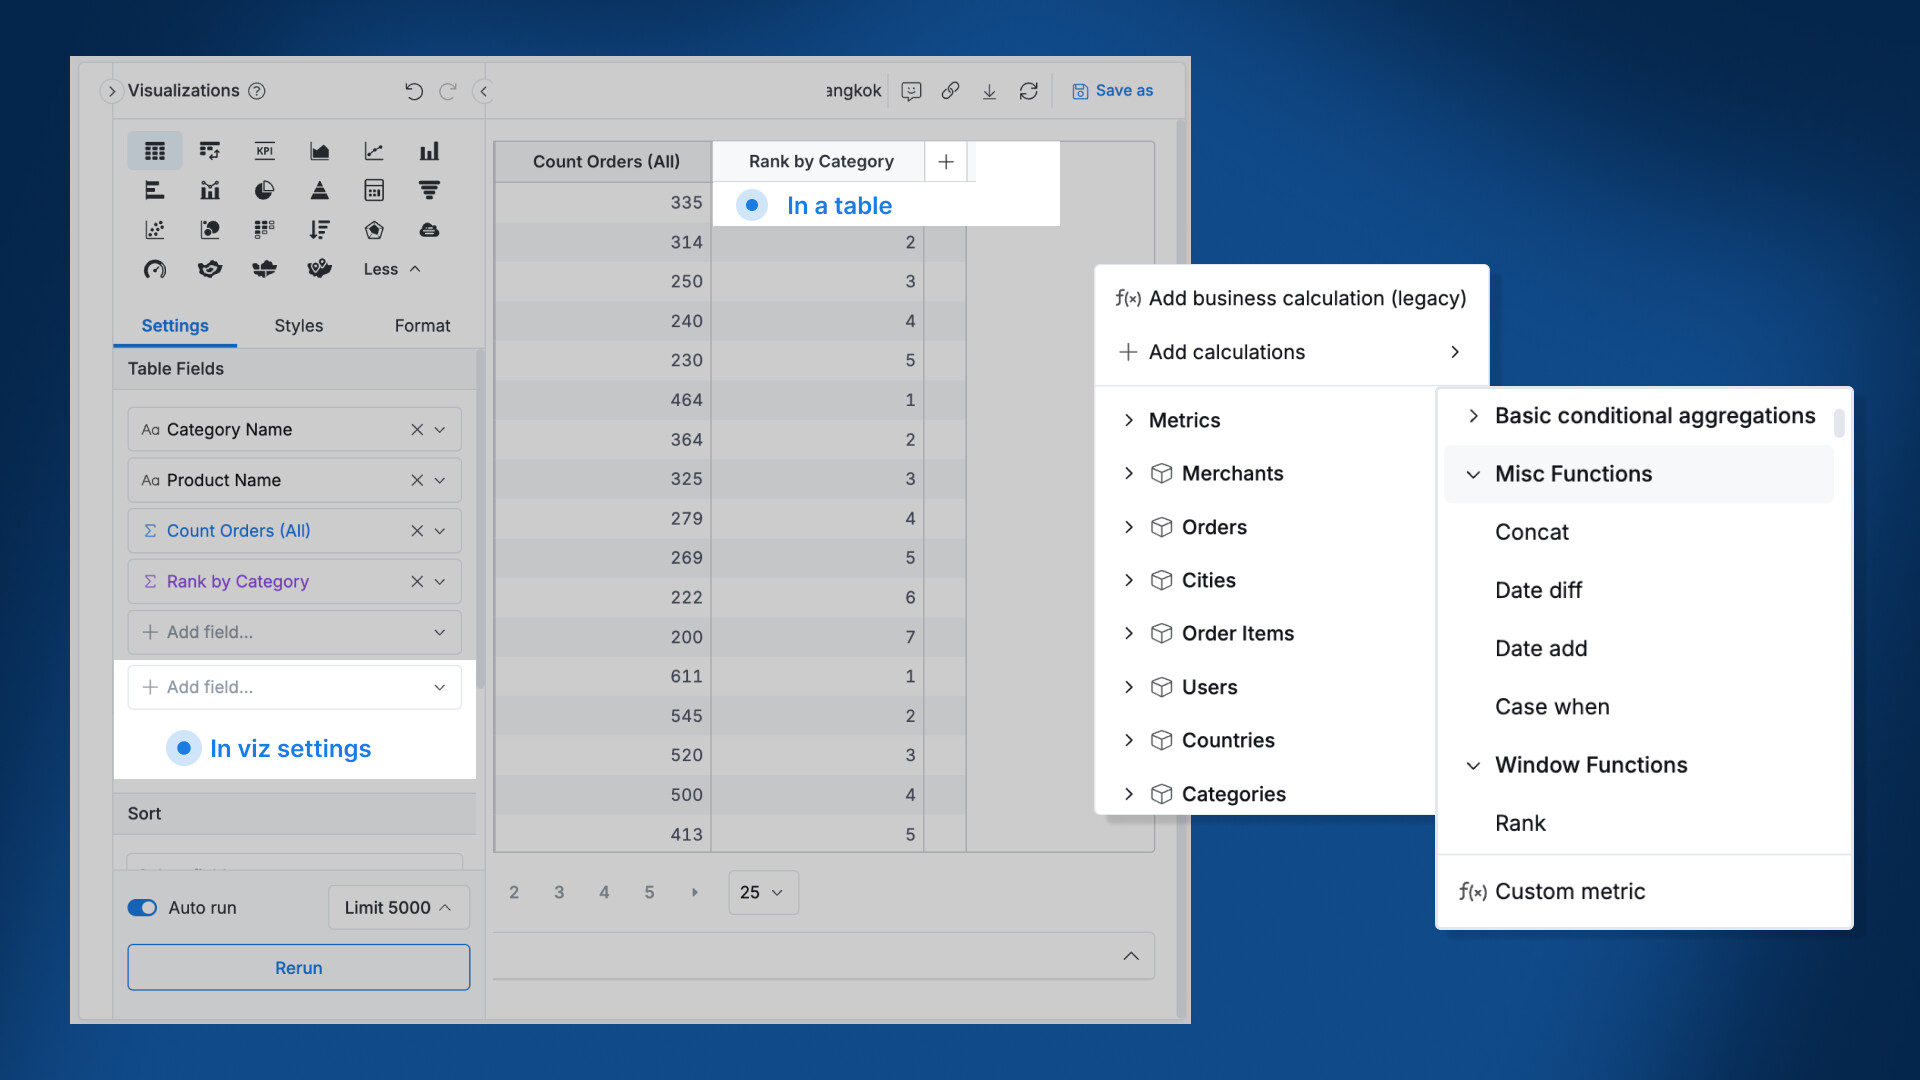
Calculation Builder anywhere: Access Calculation Builder across your Reporting tab - in the dataset fields panel, visualization settings, and tables, to define logic where you work.
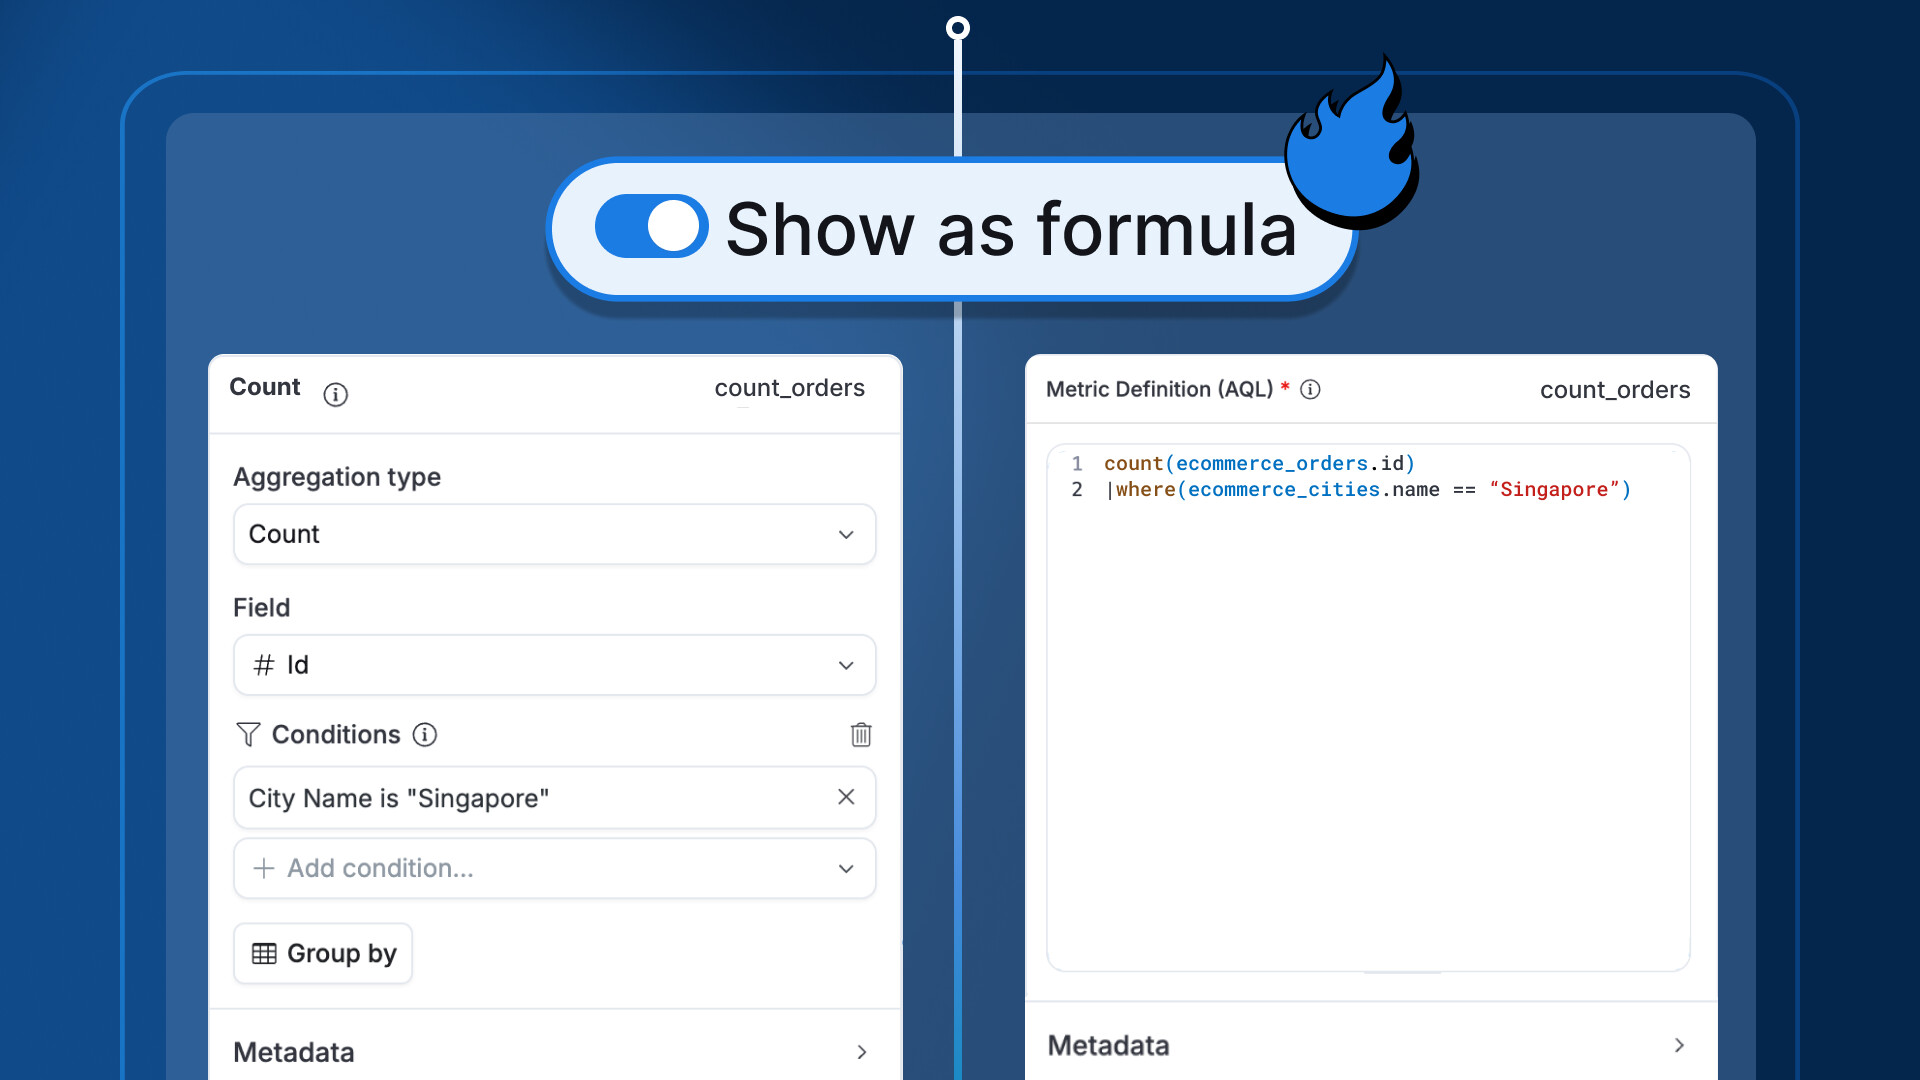
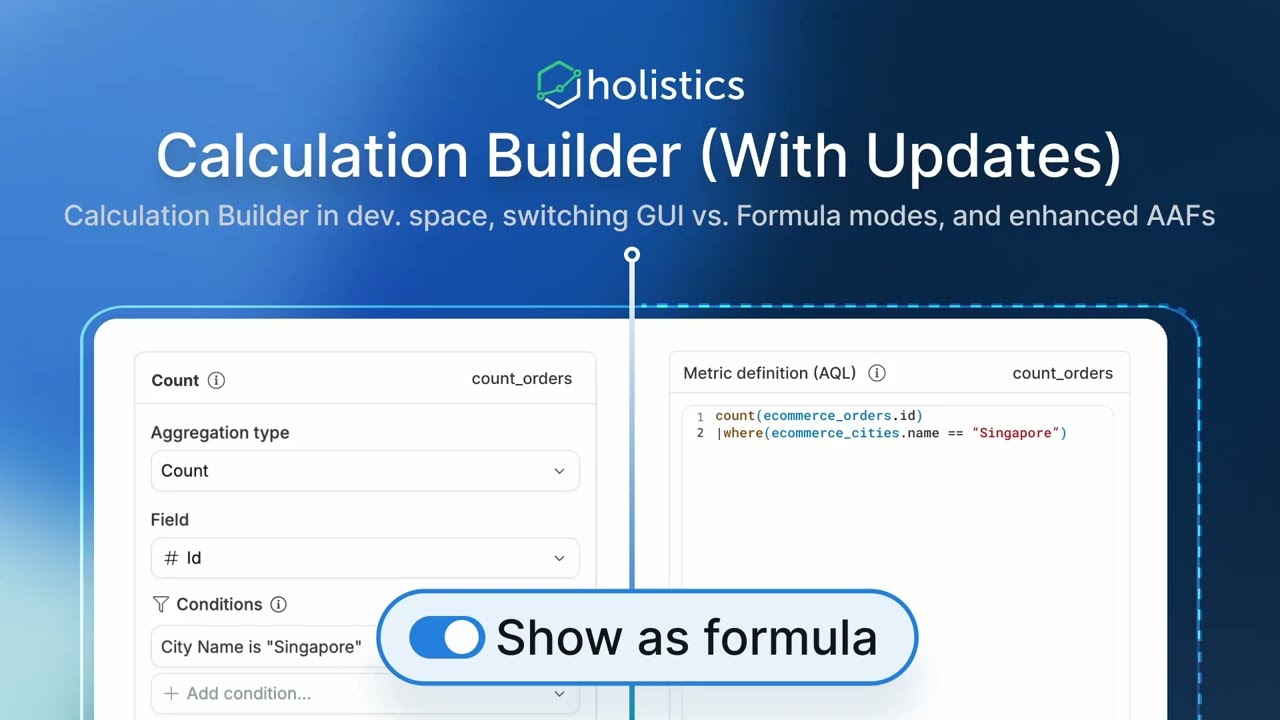
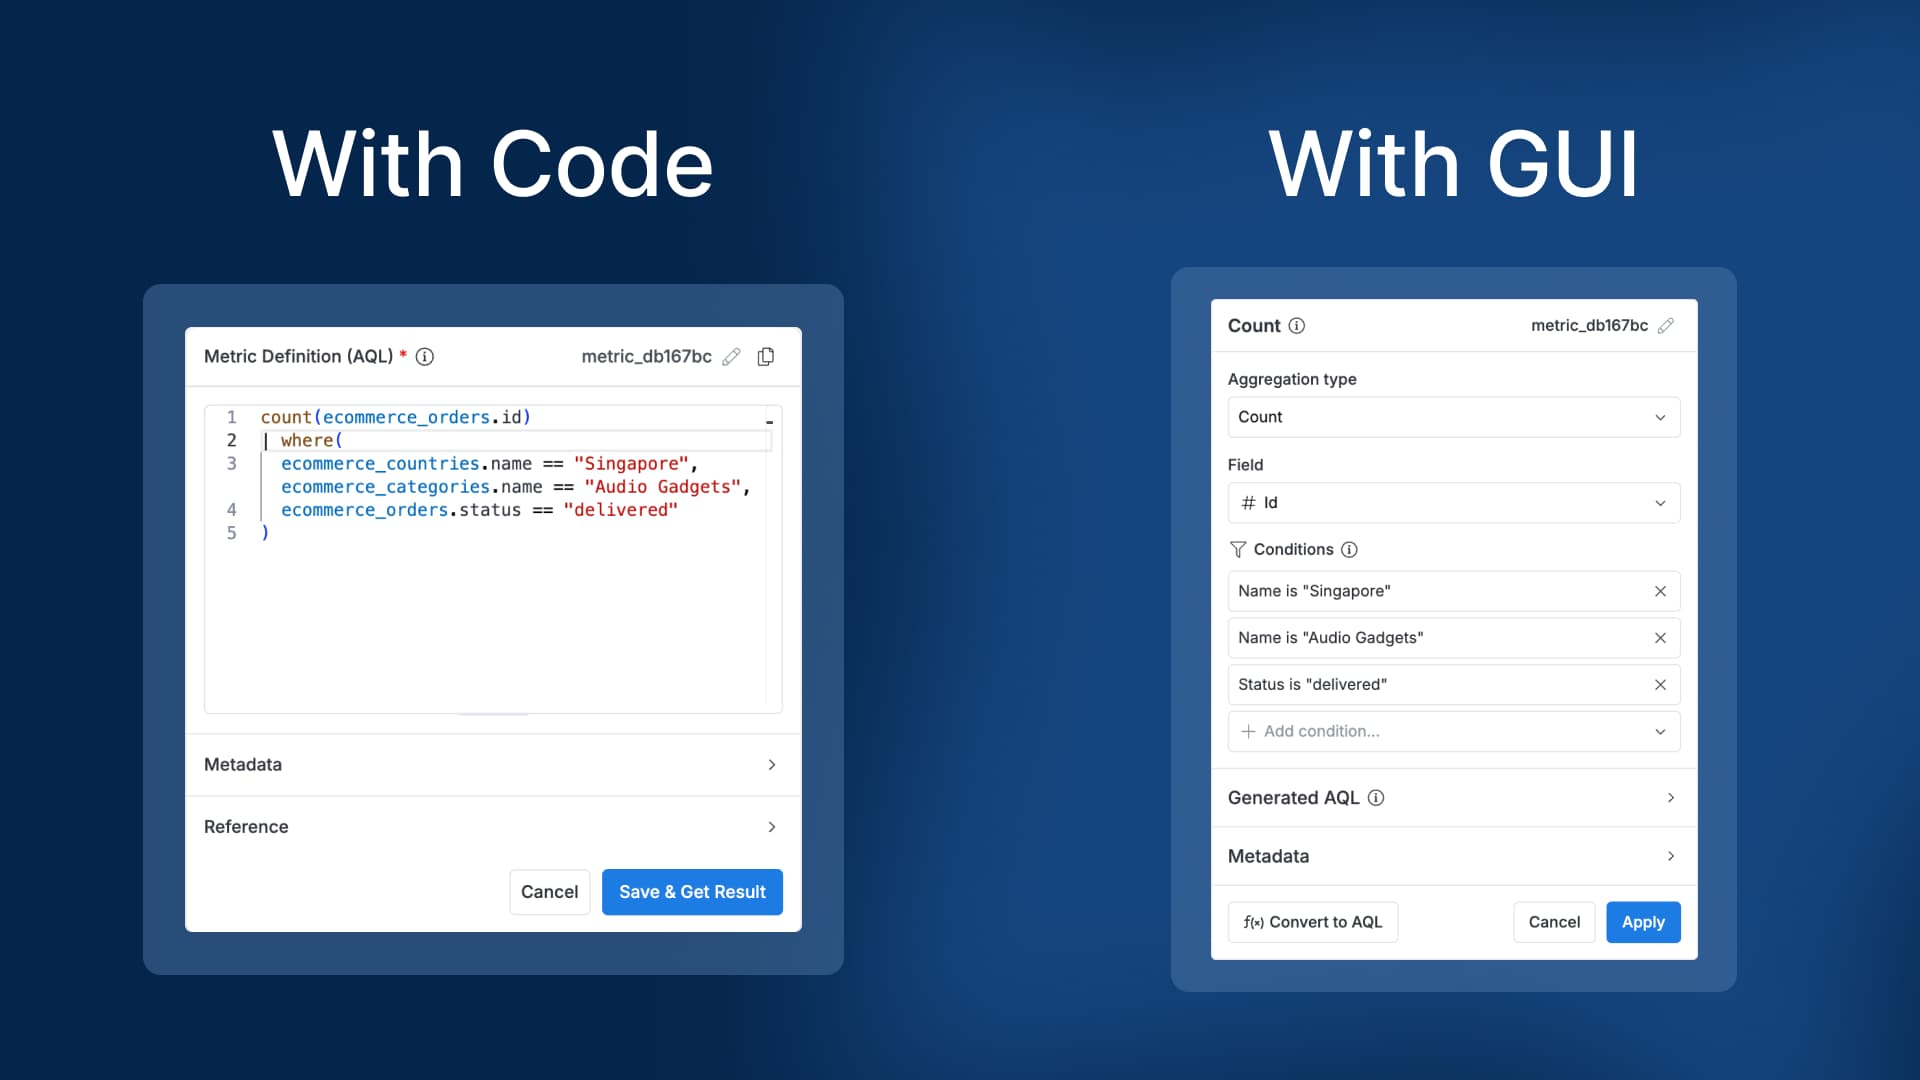
Calculation Builder (Updates): Available in Development space, GUI vs. Formula mode switching, Enhanced AAFs
Hi there
We’ve made some new tweaks to the Calculation Builder to make field creation more flexible and powerful
Available in Development
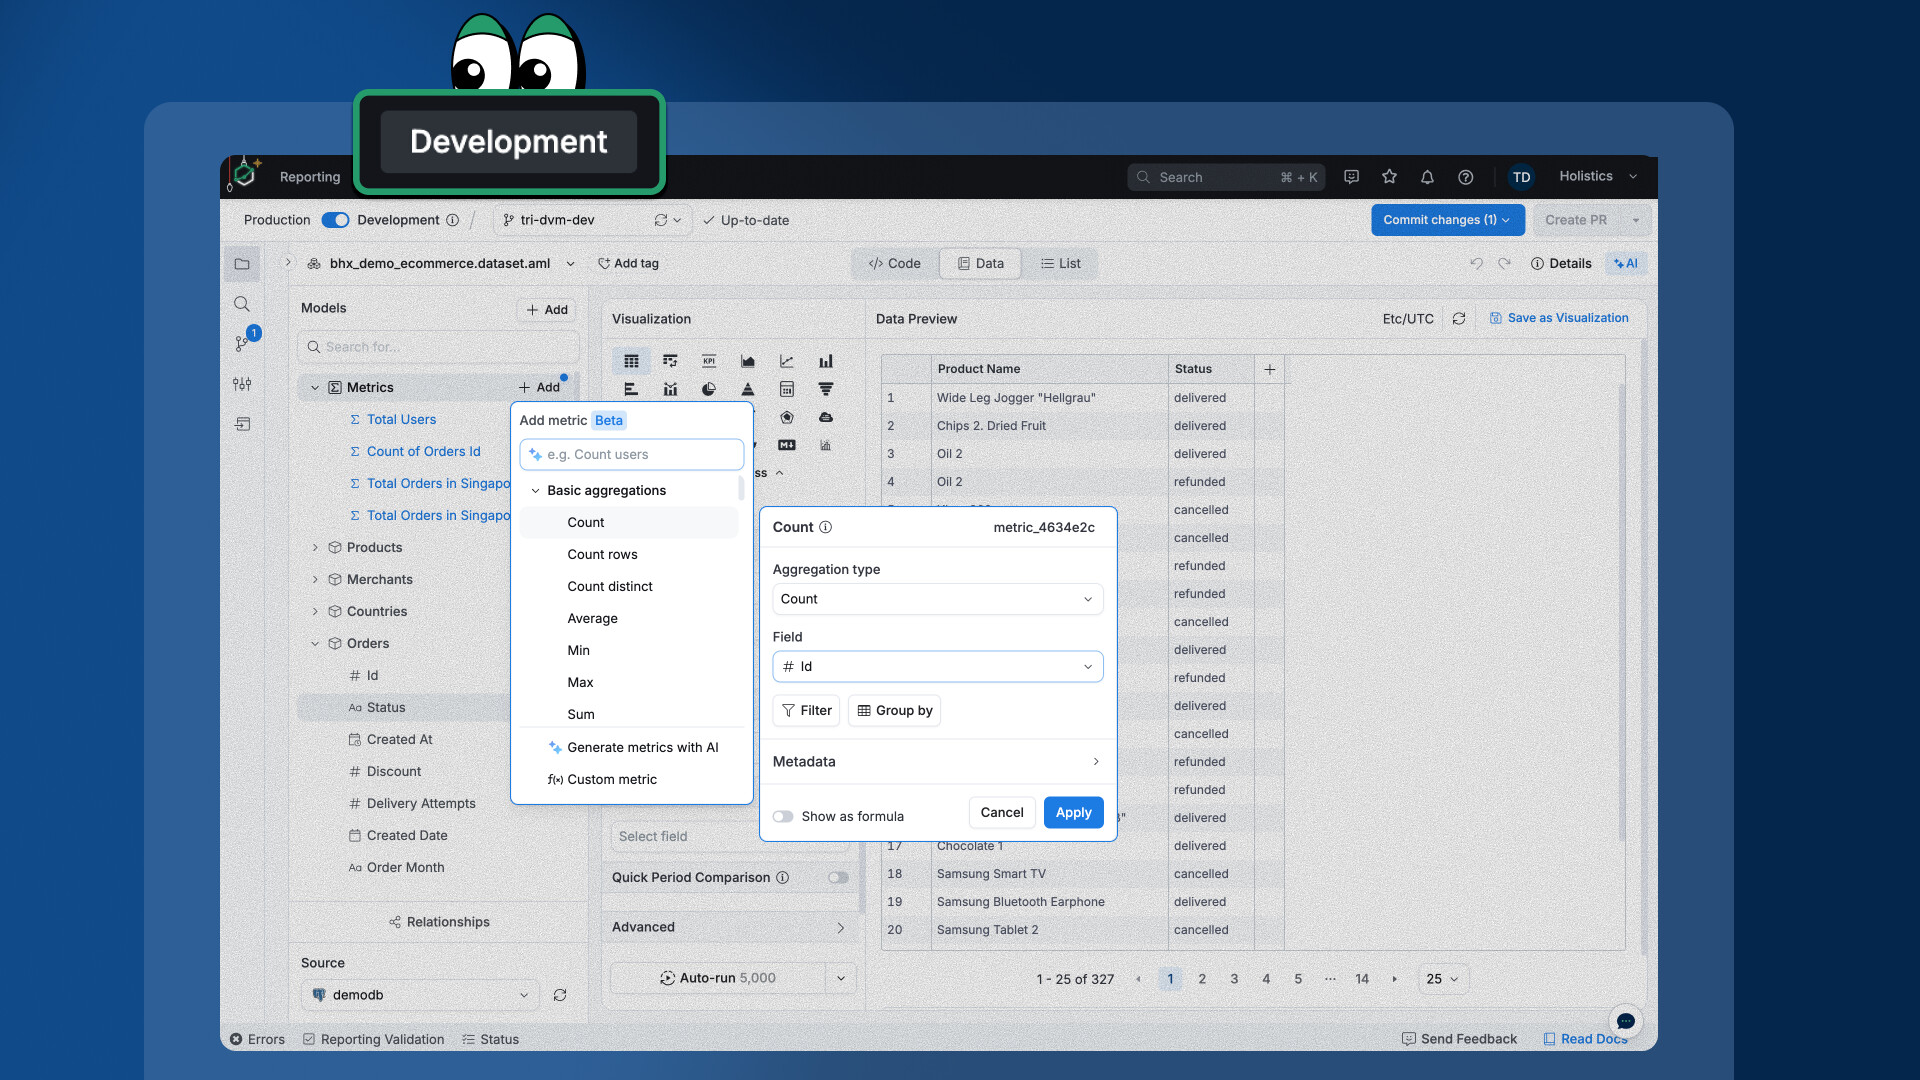
You can now use the Calculation Builder in the development space, so you’ll get the intuitive GUI to speed up creating and testing your fields before publishing.
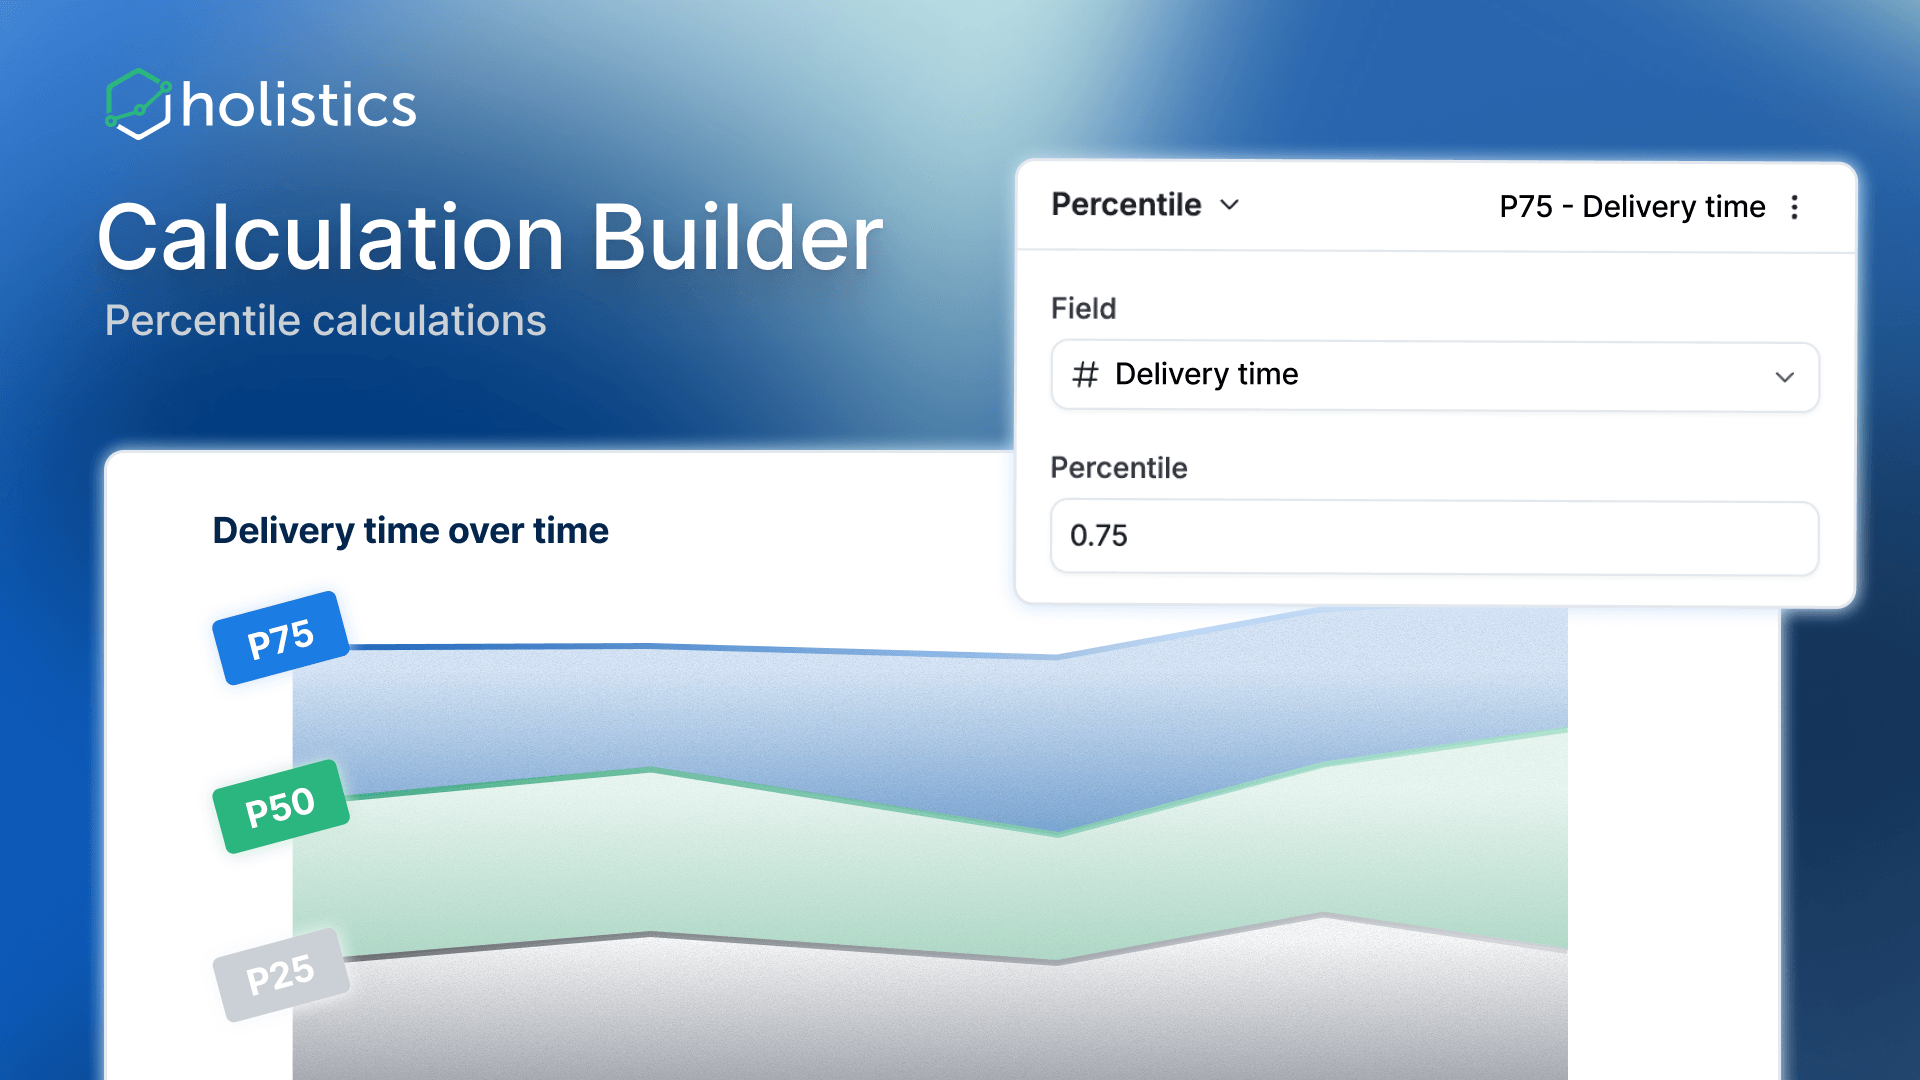
Percentile calculations are available to the Calculation Builder!
Create continuous and discrete percentiles directly in the GUI. Choose from common percentiles (P10, P25, P50, P75, P90, P95, P99) or enter a custom value.
Two types are supported:
Continuous percentile - interpolates between adjacent values
Discrete percentile - returns the closest actual value from the data
Example use cases
P10 customer lifetime value - identify your lowest-value segment to investigate churn risk
P25 vs P75 salary range - show the interquartile range for compensation benchmarking
P75 order value - understand where the bulk of revenue sits for pricing decisions
P90 response time - track performance while filtering out outliers
P95 session duration - identify power users by top 5% engagement time
P99 query execution time - catch extreme outliers for capacity planning
 More calculations are coming up soon.
 There’s even more coming up.