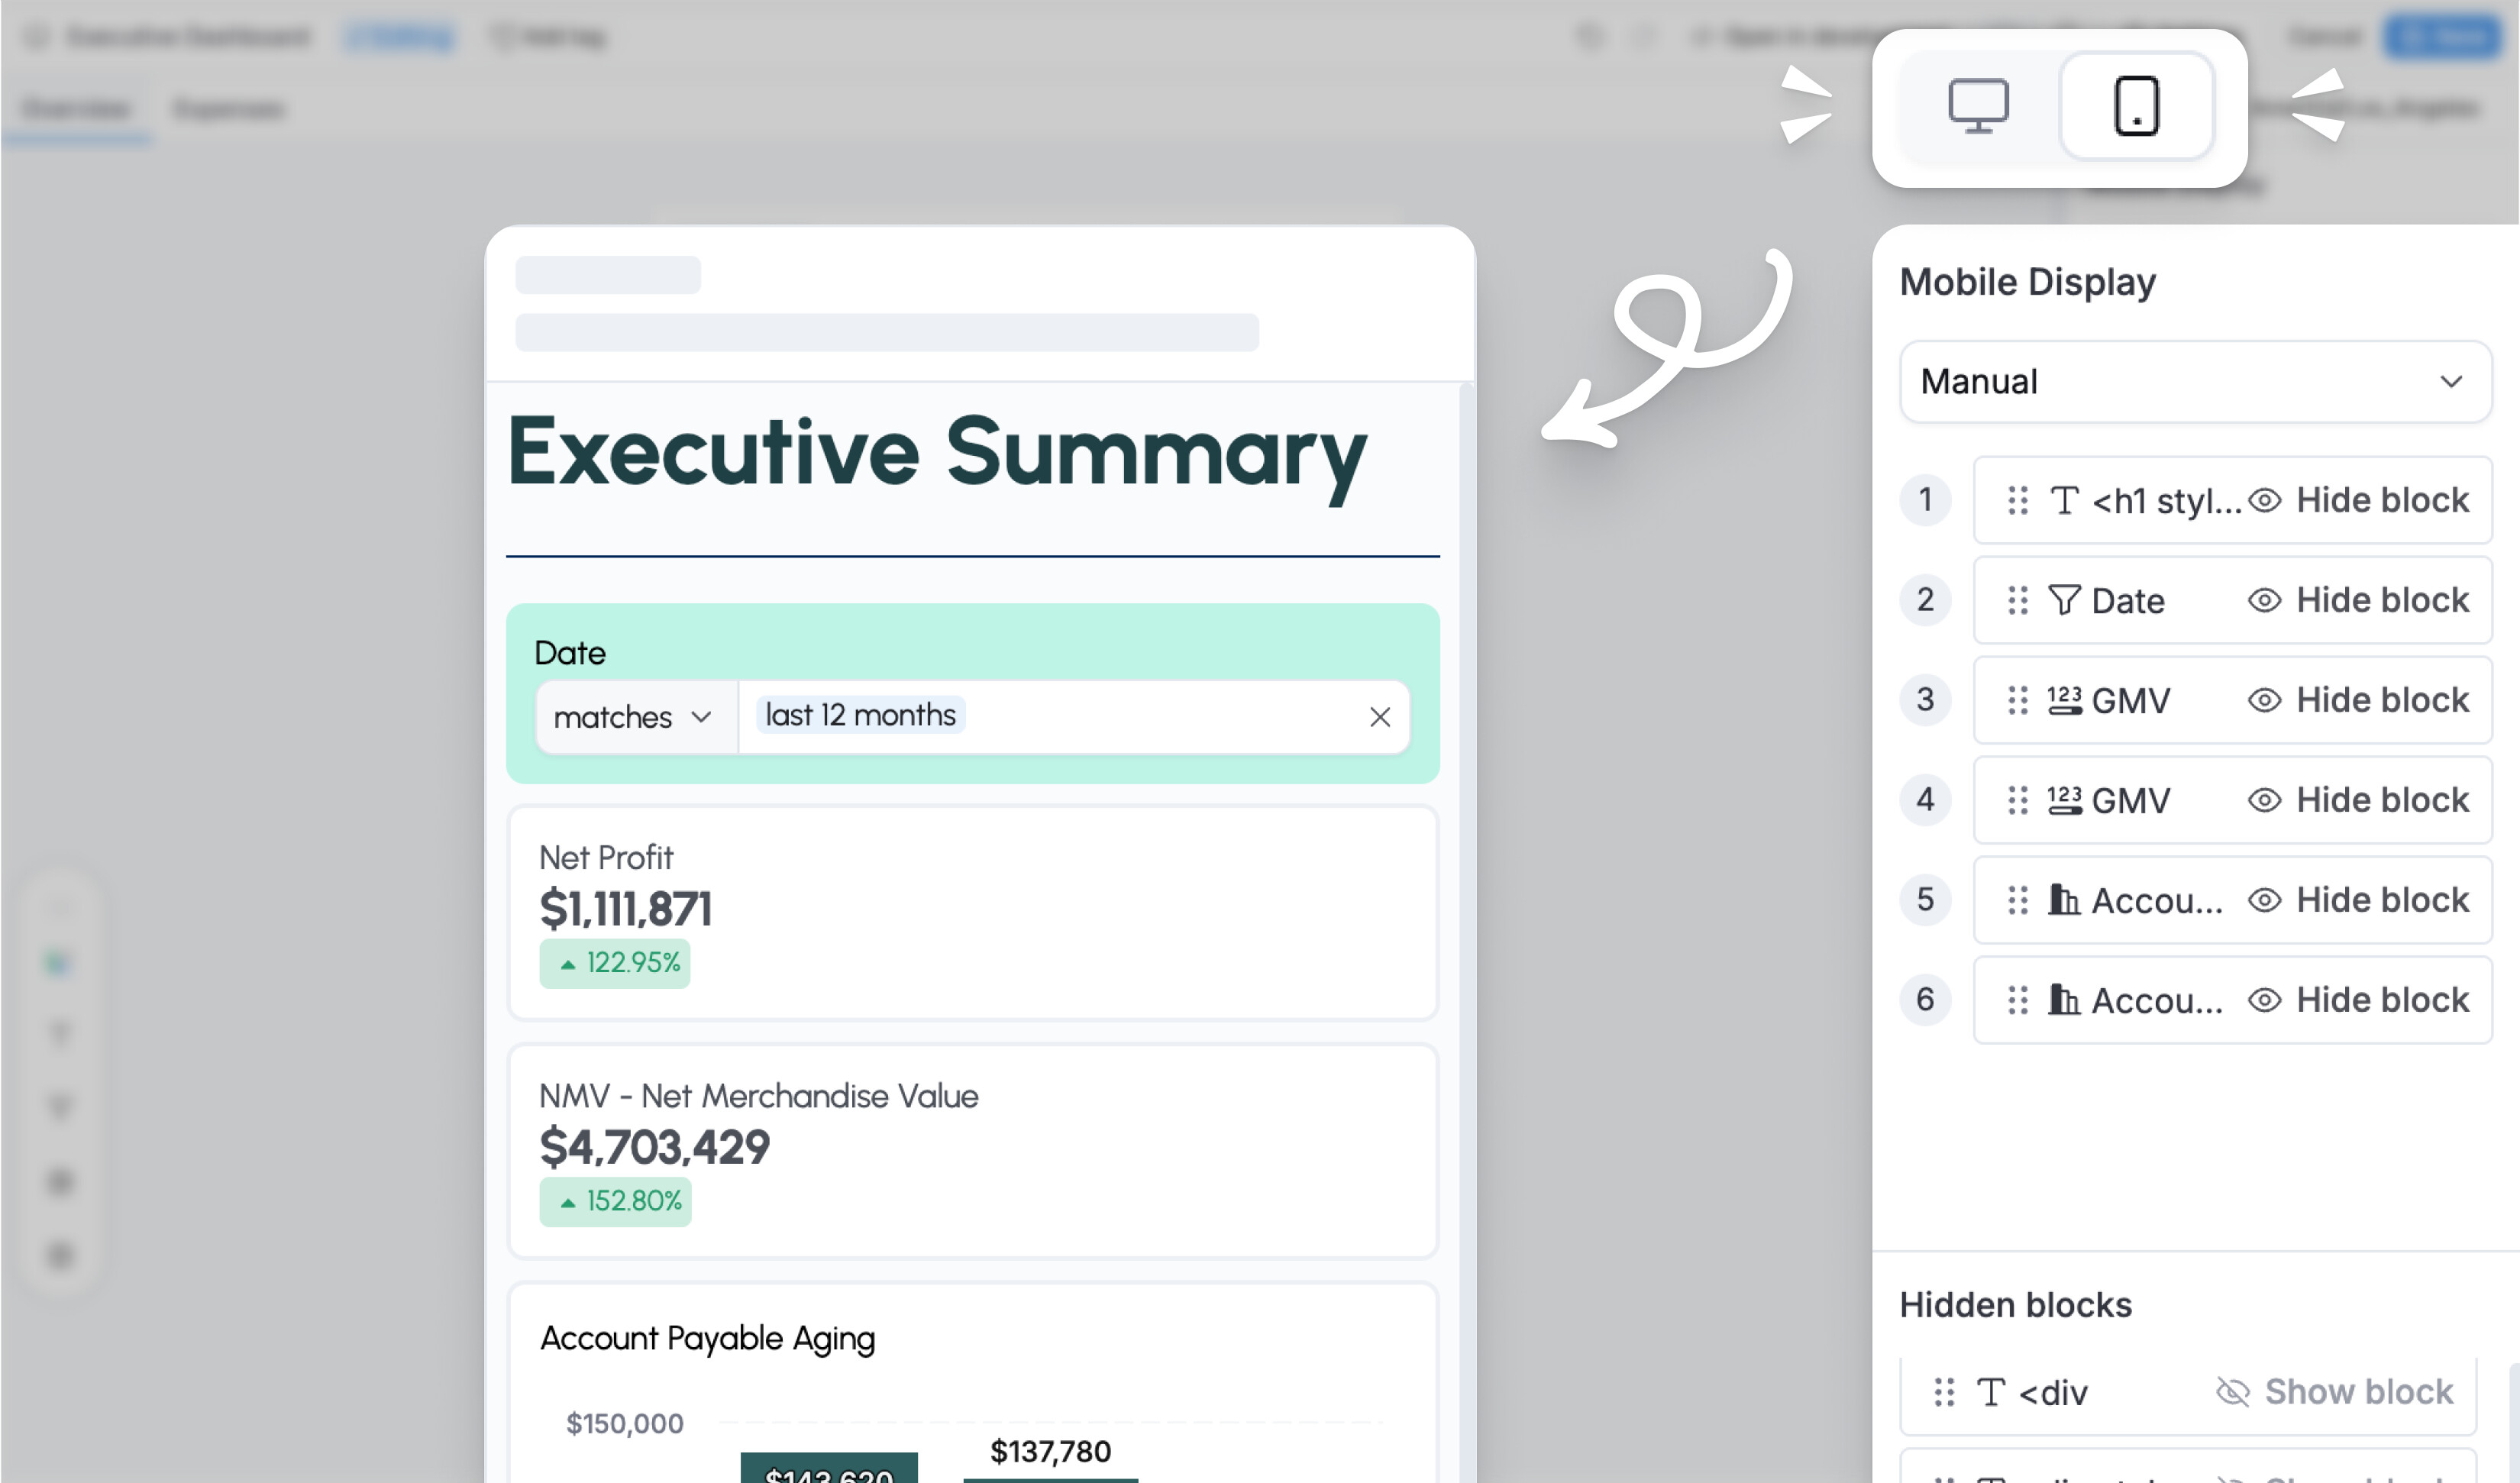
We’re excited to announce that we’re bringing Mobile View, Themes, and Reusable Library to the Reporting environment!
The problem we’ve solved
Previously, dashboard editors — especially explorers — had to switch to the Development environment to configure Mobile View, Themes, and Reusable Library. This added unnecessary friction and completely blocked explorers, who can only work in Reporting.
The solution
With these features now live, you can configure mobile view, apply theme, and insert shared reused blocks directly in Reporting when building canvas dashboards.
How it works
Open any dashboard in Reporting edit mode and you’ll see Mobile View, Themes, and Reusable Library available right there. No need to switch to Development — everything stays in one place.
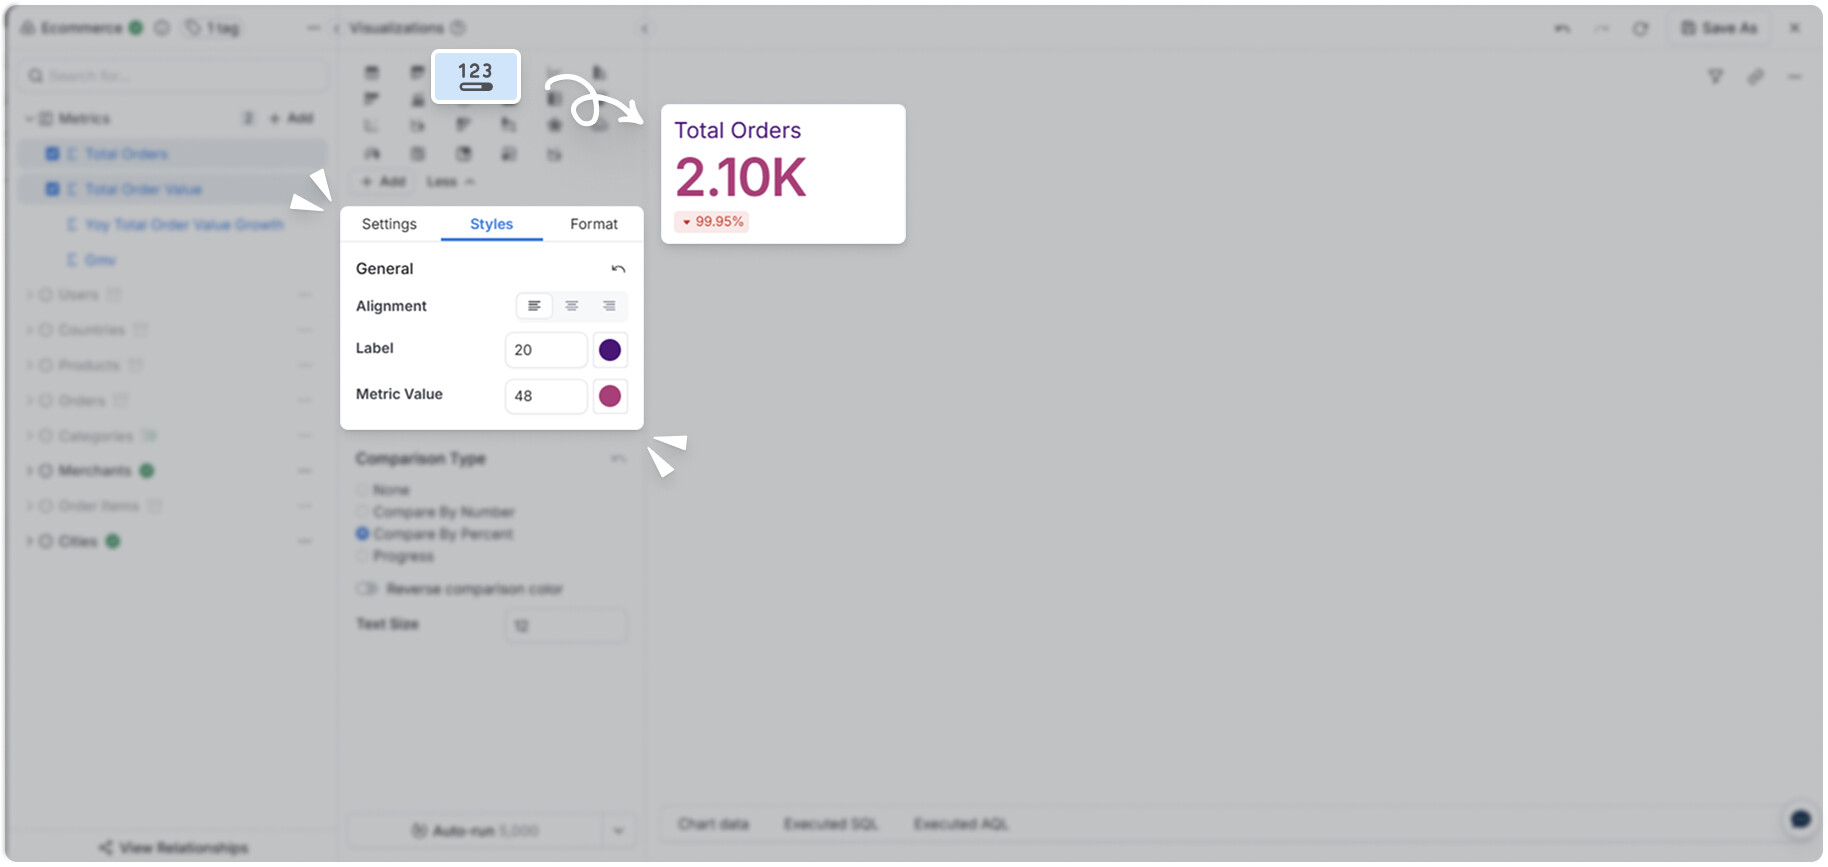
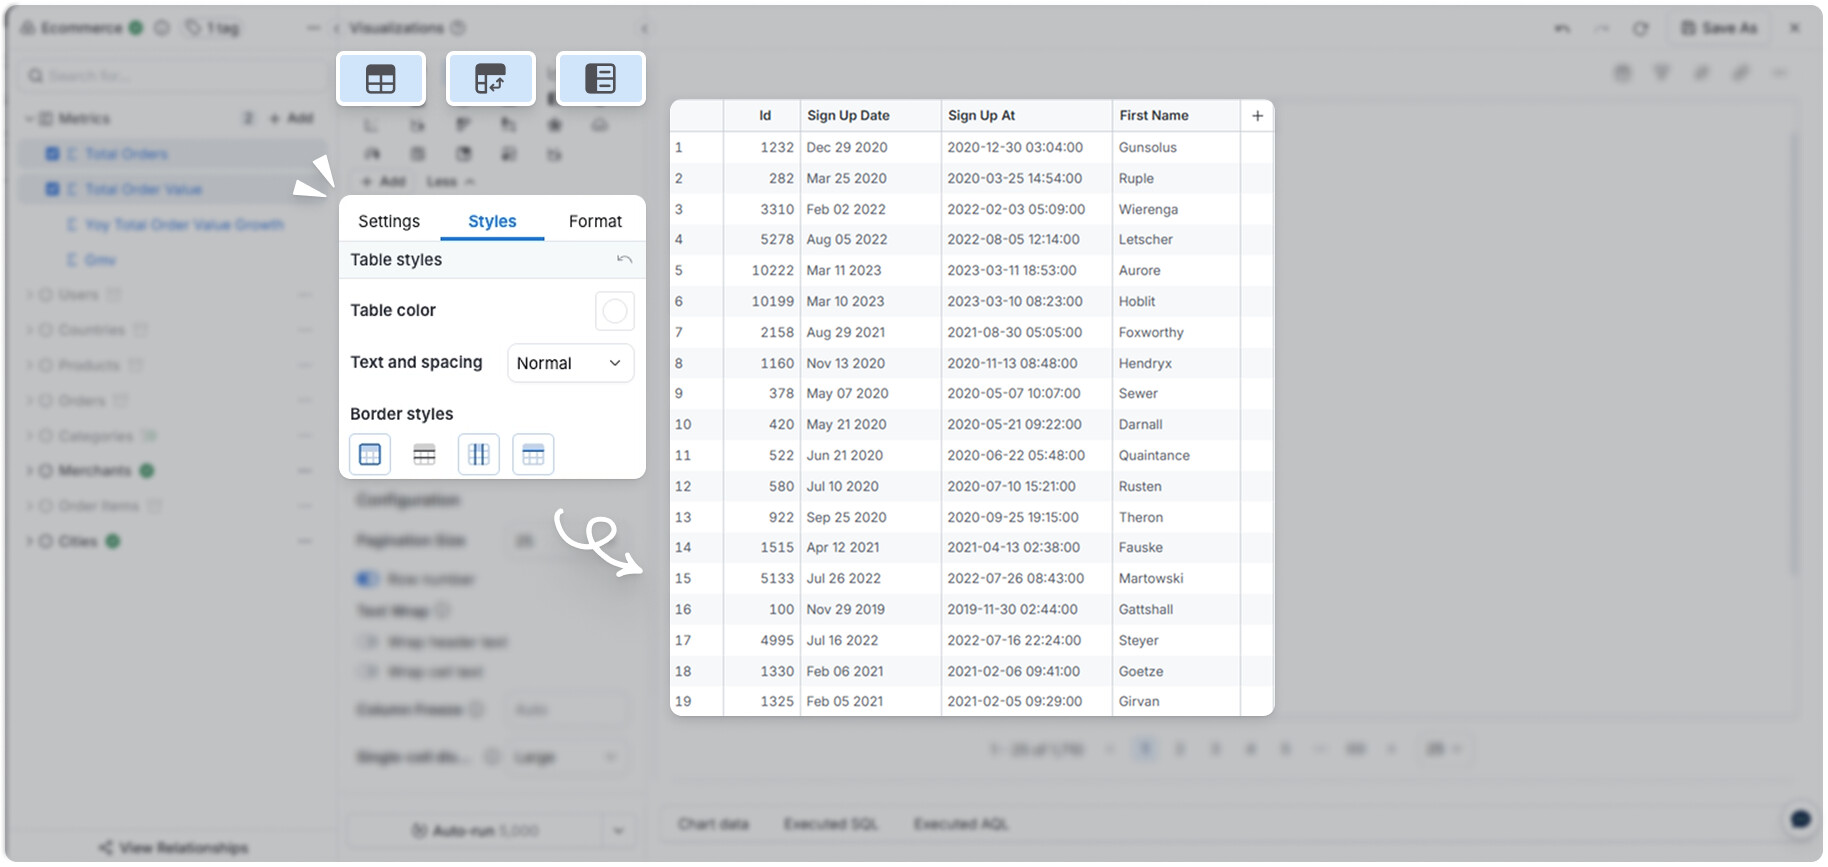
We’re excited to announce that we’ve also brought chart styling for KPI Metric and Tables (Data Table, Pivot Table, Metric Sheet) to Reporting. You now edit it directly from Dataset Explore and the Report creation flow, no need to switch to Development or enter the canvas editor to do it.
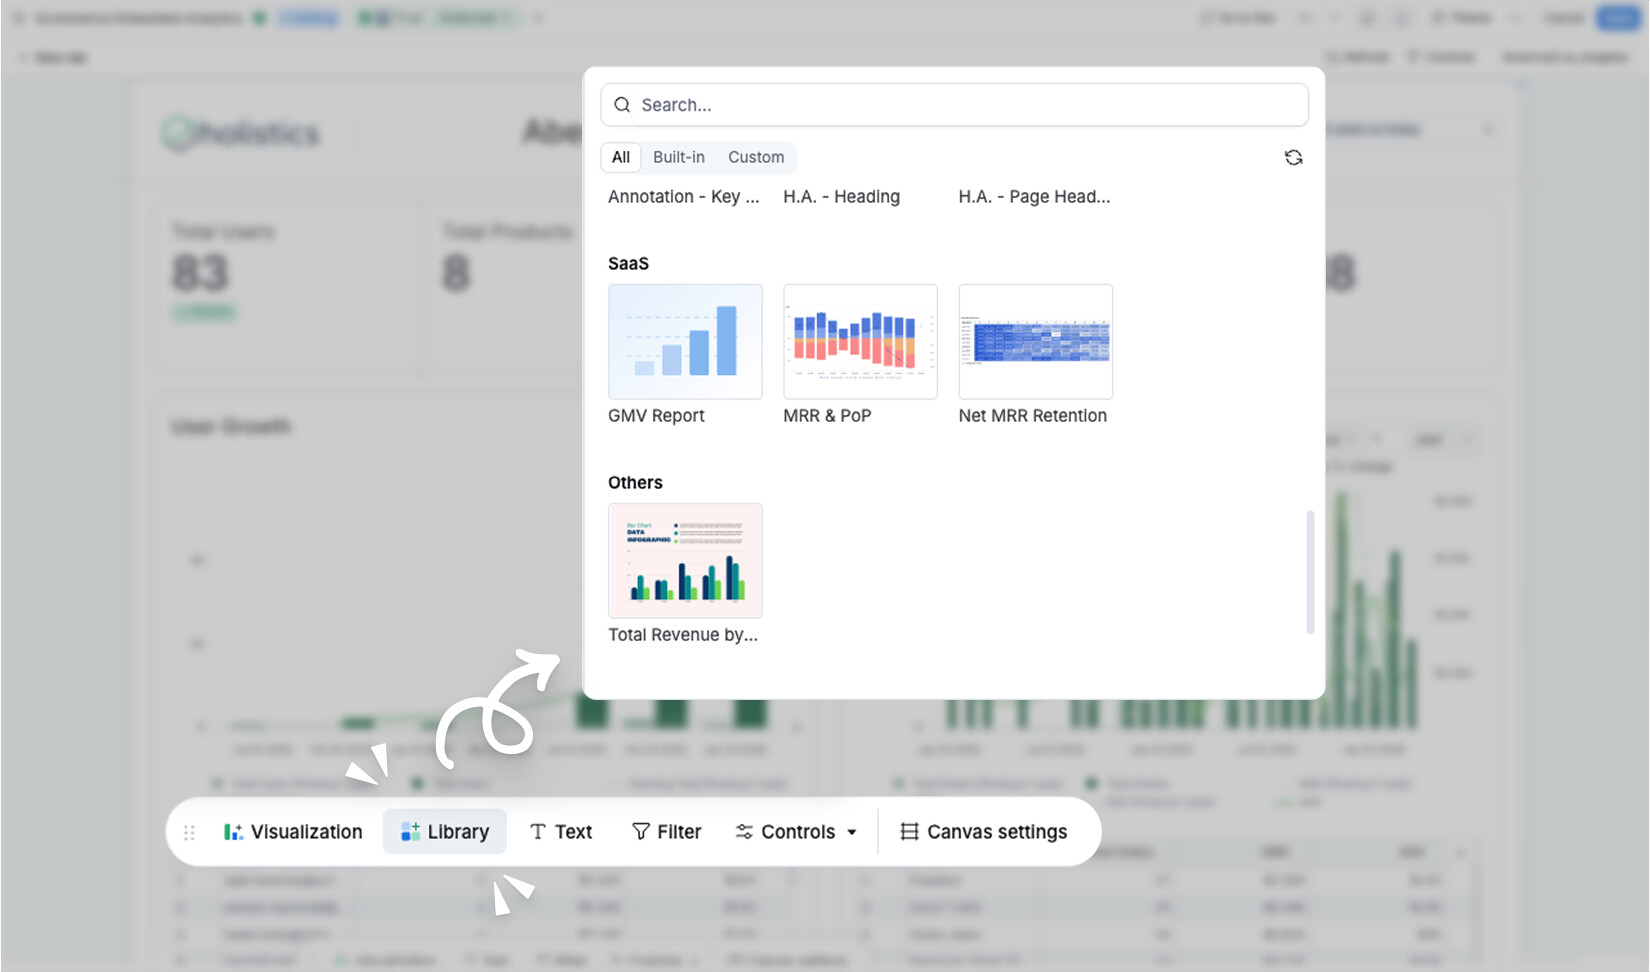
You can now browse and insert reusable components without leaving the Reporting dashboard editor - no more switching over to Development
Previously, using library blocks meant jumping into Development first. That added extra steps for everyone, and locked Explorers out of the workflow entirely.
Now, components live right where you work: insert them directly, and any block a teammate builds is instantly available to the whole team.