Dynamic Content Blocks let you build custom, data-driven narratives and visual components using Markdown / HTML / CSS, and have them automatically update with live data from your models (no manual copy/paste into slides).
What you can do with it
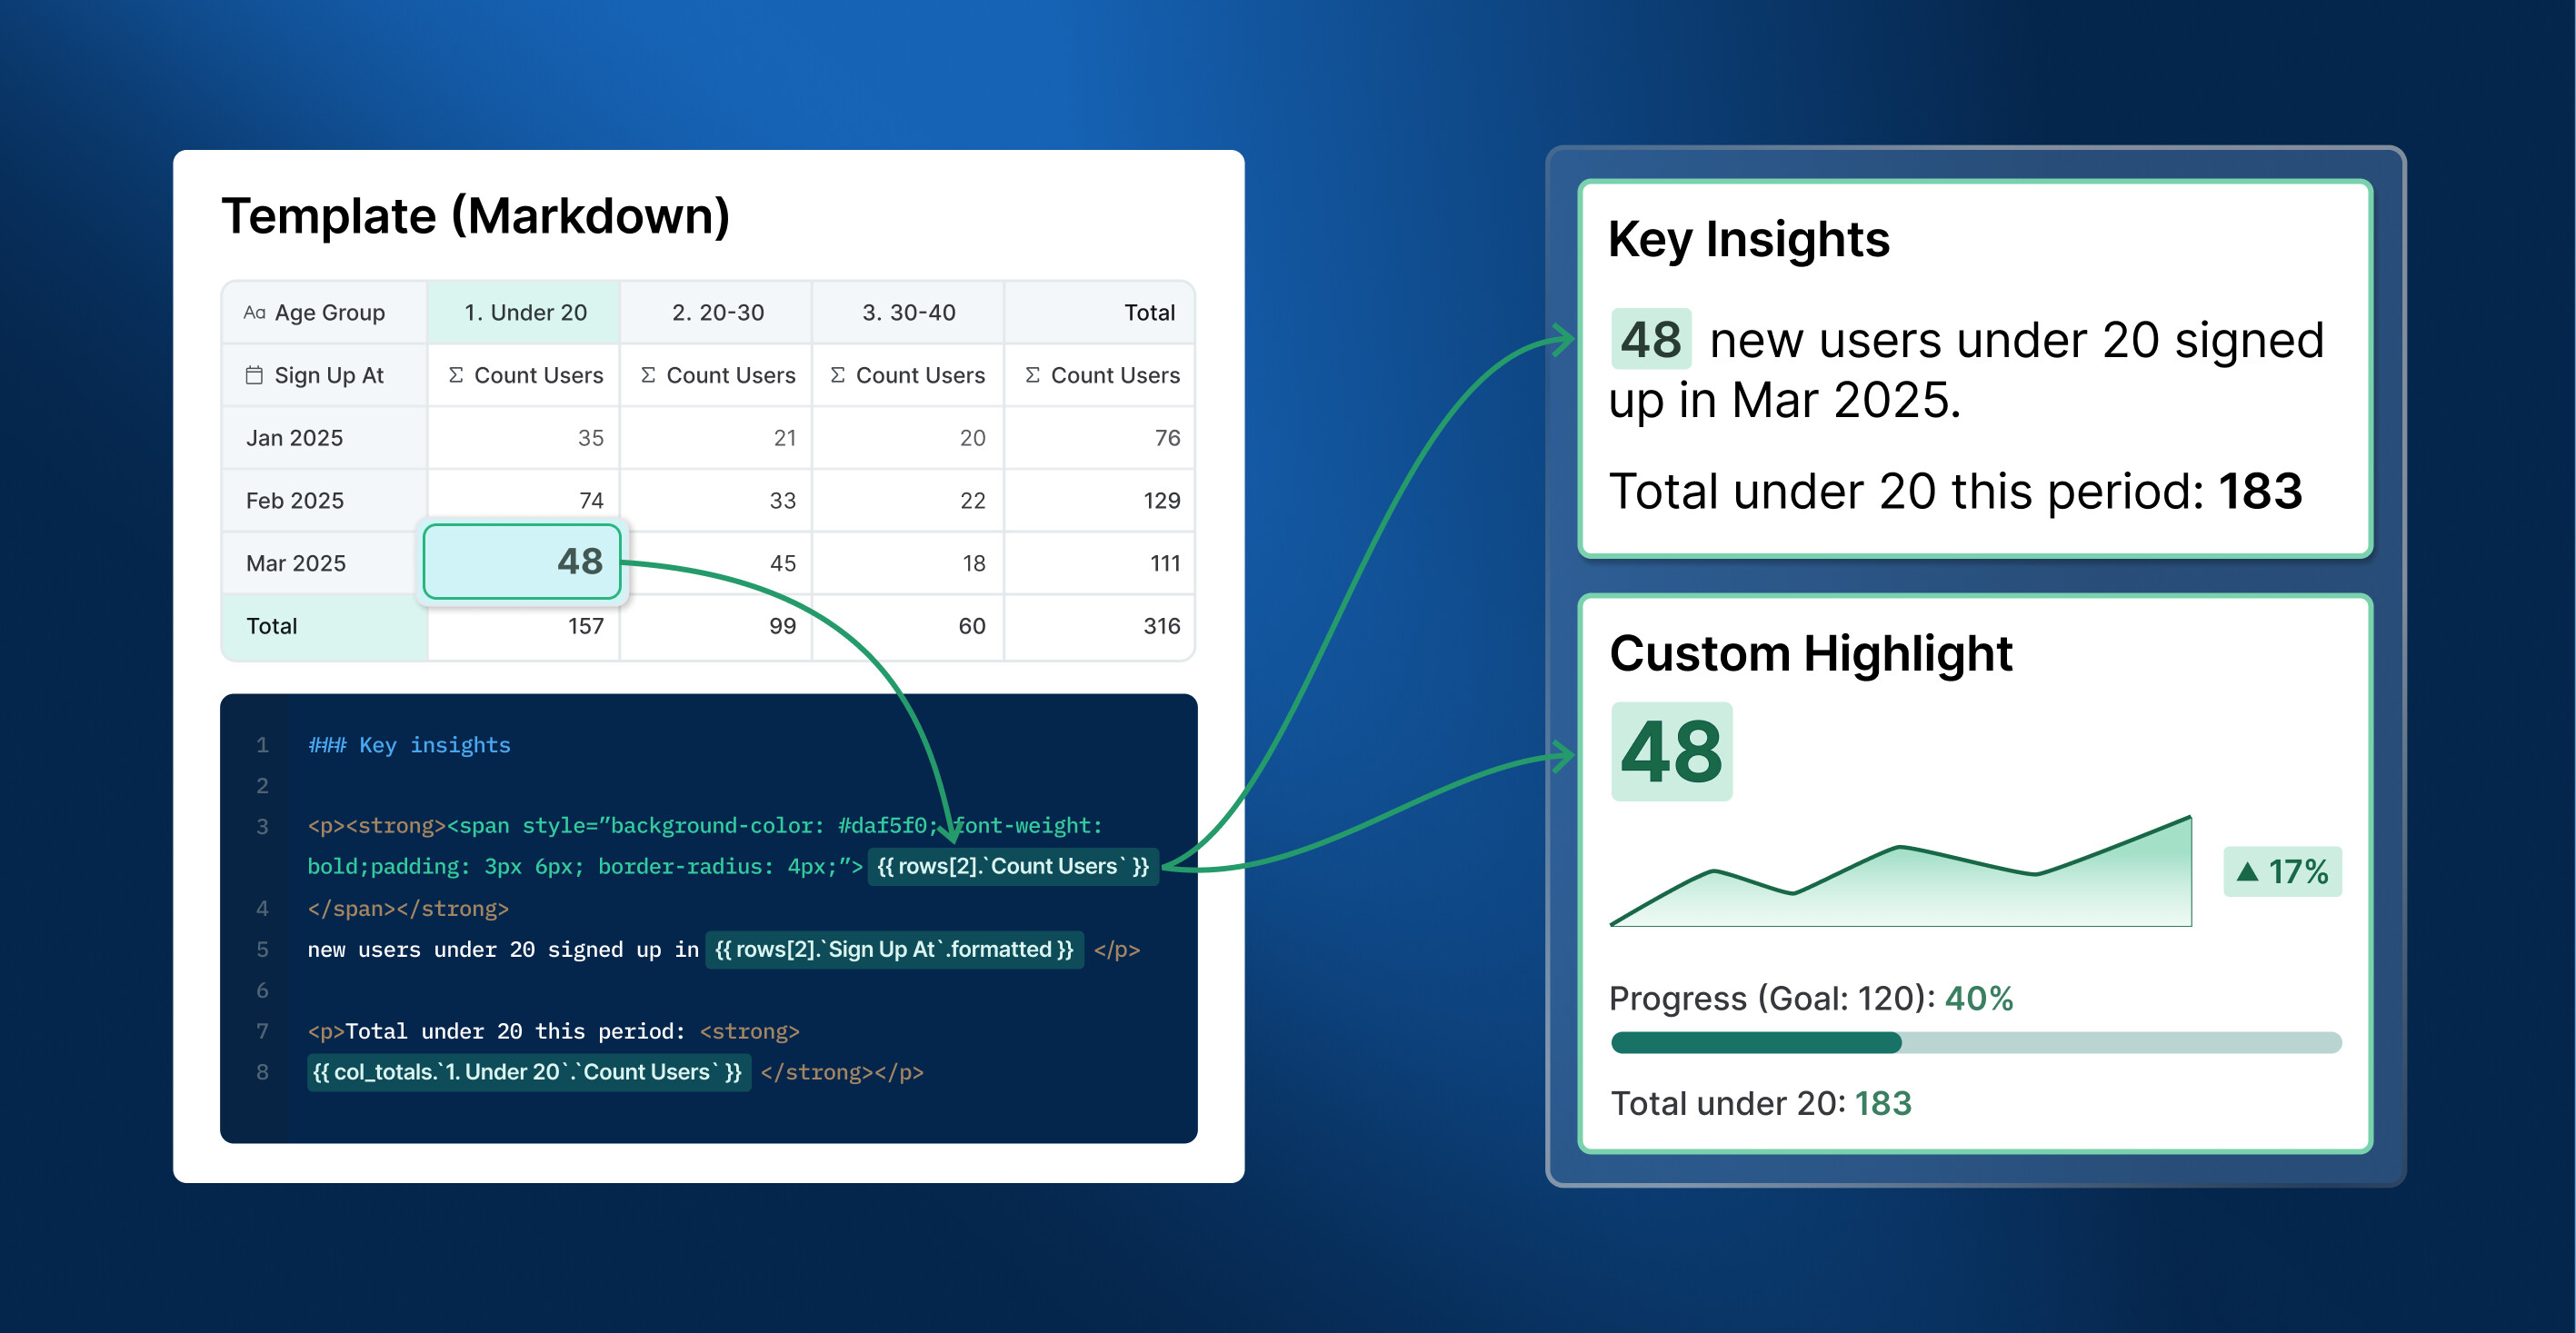
1. Narratives with Live Data
Transform raw data into stories that drive action. Instead of forcing stakeholders to interpret complex charts, you can now deliver insights in plain language that refreshes automatically.
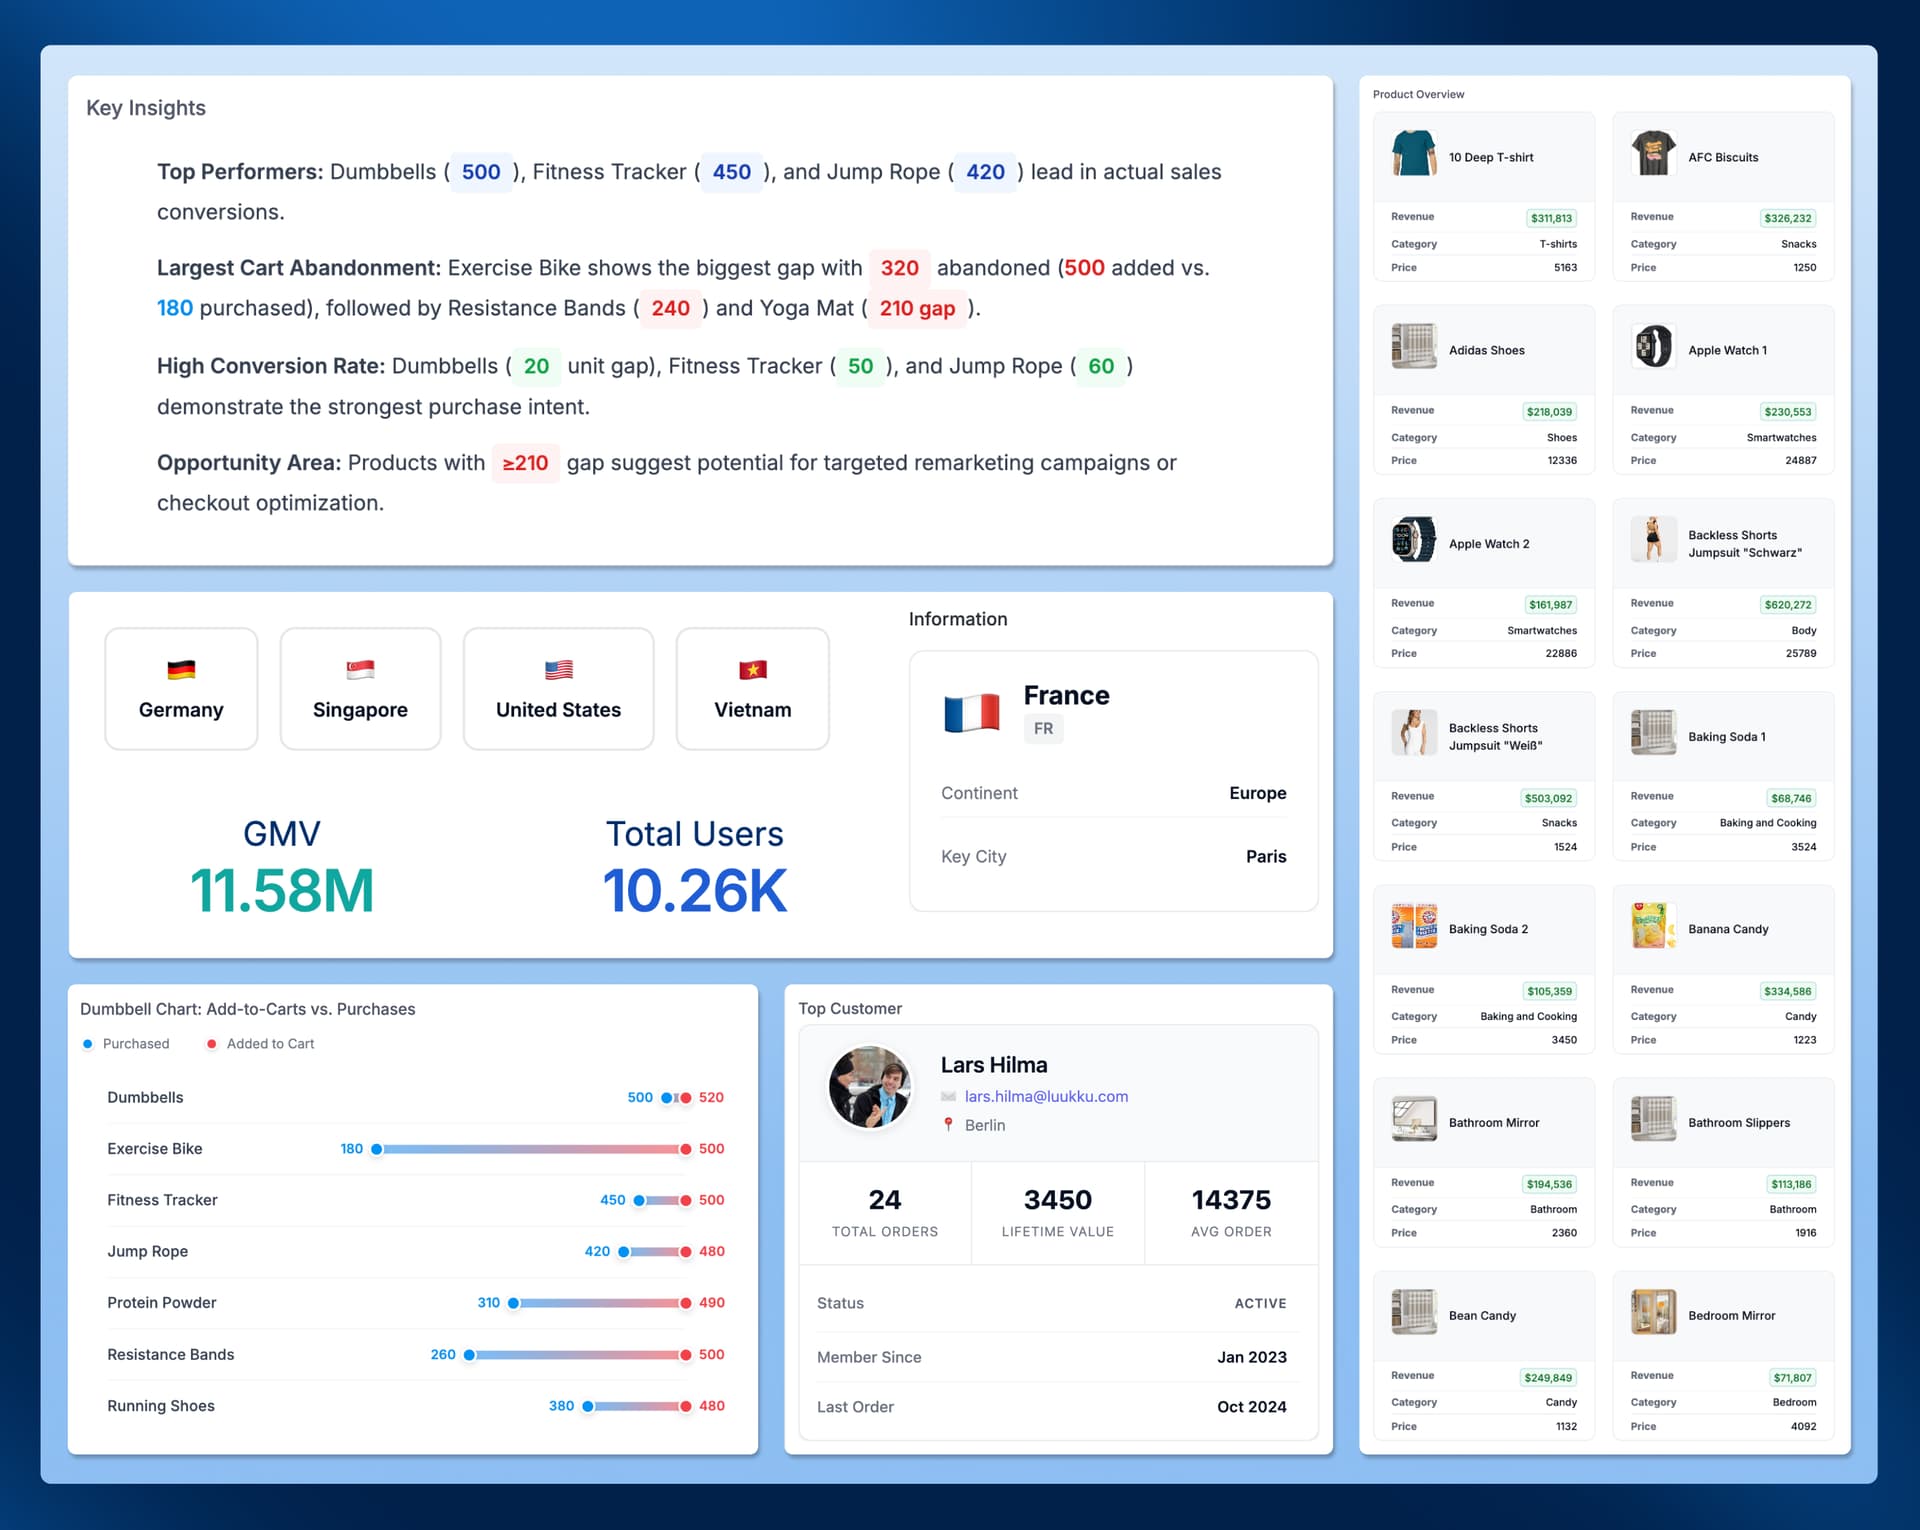
Branded Layouts: Design product catalogs, metric cards, or KPI displays that match your exact company visual identity.
Detailed Record Views: Build rich customer profiles or deal summaries that combine text, metrics, and formatting.
3. Custom Dashboard Controls
You can even create custom controls for your dashboards, such as tailored filter or date drill interfaces, utilizing the freedom of HTML and cross-filtering mechanisms.
Notes & current limitations
No JavaScript execution in templates (HTML/CSS only), for security reasons.
Docs launch with 4 starter templates; we’ll expand the library over time.
JS support isn’t on our current roadmap since it can expose some potential security risk.
Curious though: what would you use JS for? Knowing whether it’s custom charts, interactivity, or something else would help us understand if there’s another way to get you there. Thanks.
Since only HTML is allowed, it’s impossible to create dynamic key insights.
With JS, we could build logical flows and highlight what truly matters, rather than relying on predefined insights that only change numbers but not the context or behavior of the content.
To make sure we can explore the best possible solution for you, could you share a bit more about your specific use case?
What does the insight logic look like? For example: “if revenue growth is negative, show a warning message and highlight the top declining segment.” An example of the logic you have in mind would be super helpful.
How complex is the logic? is this a simple check (above/below a threshold) or multi-condition logic across several metrics?
The reason we’re asking: while JS execution isn’t something we support today, there may be a workaround depending on your logic. We’d love to see if we can get you there.