KPI Metric progress bar

  1. Is there a way to round the percentage on the progress bar?
  2. Can the block background color be set based on percentage, i.e. green when positive, and red when negative?
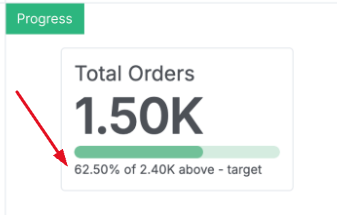
Hi Chris, thank you for reaching out to us.

The first point has not been supported. Our product team just added it to the backlog, and we will keep you updated when it’s released.

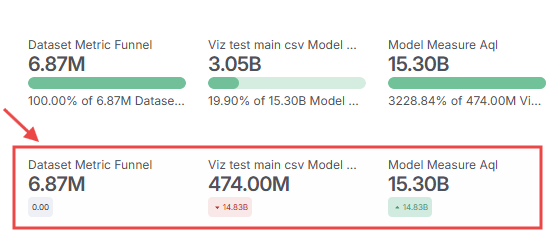
Regarding the second point, could you switch to using the trend indicator instead, as the attached image, since the progress bar with negative progress is quite unusual.
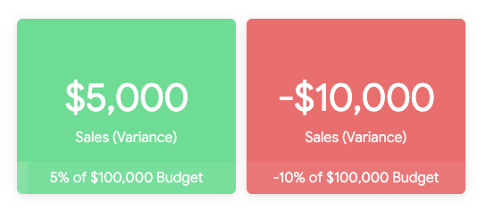
Thank you! I was hoping to mimic the same visuals from another tool, for example, to quickly show when sales is over/under budget. Progress bar is to show the variance in this case.
I’ll figure out another way.

Hi @ctang, thank you for providing the examples.

You can build similar visual by using our Dynamic Content Blocks

The result will look like this:

To build this visual, you can follow these steps:

  1. Select Markdown viz type
  2. Add the metric and create a new custom metric to calculate the card background using our AQL’s case .. when .. syntax
case(
  when: your_metric > 0, then: 'green',
  when: your_metric < 0, then: 'red',
  else: 'white'
)

(remember to name it Background)

  1. Add code to your editor
<style>
  .sales-kpi-card {
    border-radius: 12px;
    padding: 24px 20px;
    color: #ffffff;
    text-align: center;
    box-shadow: 0 4px 14px rgba(0, 0, 0, 0.12);
    min-height: 170px;
    display: flex;
    flex-direction: column;
    justify-content: center;
    gap: 10px;
  }

  .sales-kpi-card.green {
    background: #6bd28b;
  }

  .sales-kpi-card.red {
    background: #e86d73;
  }

  .sales-kpi-card.white {
    background: #9ca3af;
  }

  .sales-kpi-value {
    font-size: 52px;
    line-height: 1;
    font-weight: 700;
    margin: 0;
  }

  .sales-kpi-label {
    font-size: 20px;
    line-height: 1.3;
    font-weight: 500;
    margin: 0;
    opacity: 0.95;
  }

  .sales-kpi-subtitle {
    font-size: 16px;
    line-height: 1.4;
    font-weight: 500;
    margin: 8px 0 0;
    opacity: 0.95;
  }
</style>

<div class="sales-kpi-card {{rows[0].values.`Background`}}">
<div class="sales-kpi-value">{{ rows[0].values.`your_metric`.formatted }}</div>
<div class="sales-kpi-label">Sales</div>
</div>  

(remember to replace your metric name to above code)

Could you give it a try and let me know if works for you?

I was able to do that on data and pivot tables with Conditional Formatting, but would miss the progress bar. On Metric KPIs, I could not specify a background color based on positive/negative values and percentages.

Hi @ctang, sorry for my late reply. Have you tried our Dynamic Content Block in my last comment?
It would help you create a Metric KPI card with a specific background color based on positive/negative values.