I have a pretty simple table that contains the logs of views and clicks for specific banners. Every time there’s a view, there’s a line in the table. Every time there’s a click, there’s a line… pretty standard.
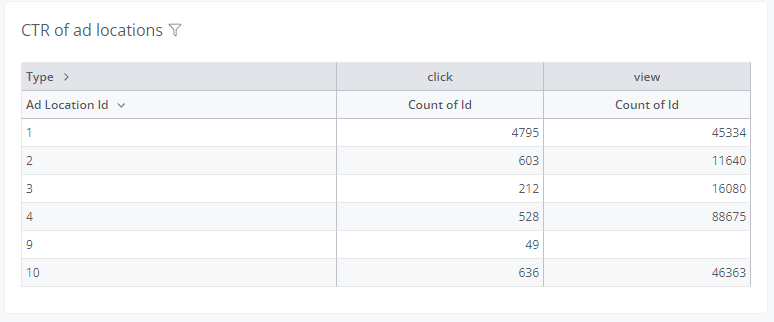
With holistics, I made a pretty standard table summing these logs by ad placement:
Hi @EdouardF,
A very quick way to solve this is adding a Business Calculation field in your table, to calculate the ratio of Clicks over Views.
You can take a glance at the doc here for further tutorial: Business Calculation | Holistics Docs.
For this case, I believe something like count(model.click) / count(model.view) in the Business Calculation would do the trick.
In case you want to reuse this calculation in several other reports, you can create a Custom field in the data model instead. The doc for it is here: Dimensions & Measures | Holistics Docs. Cheers!
Awesome! Do give me a ping if you have any problem with it
Also, I’m curious to learn what troubled you when finding a way to add this calculation field to your table. Could you share more about where you expected to see this ability, and how you expected it to be more intuitive for you, @EdouardF?