Wednesday, September 17, 2025
What can you do with $150?
You could buy a week’s worth of groceries. Or, if you run a BI company, spend it on a single Google ad click for “embedded analytics.”
Since 2022, the price of those clicks has tripled, fueled by the explosion of embedded BI tools - now three times as many - vying for your attention. Today, vendors are willing to spend the equivalent of a year’s worth of groceries each month just to get in front of you.
We’re lucky we don’t have to.
If you’re using Holistics for embedded analytics, chances are you first used it internally. You liked how natural exploration felt, and you wanted to bring that same analytics experience to your customers. Most of our customers followed that same path.
We believe the best analytics doesn’t separate “internal” from “external” users. It just makes working with data feel effortless for everyone.
This month’s features blur that line even further, extending the same intuitive, friction-free experience to every user, whether they’re your customer or your colleague.
 Just Released
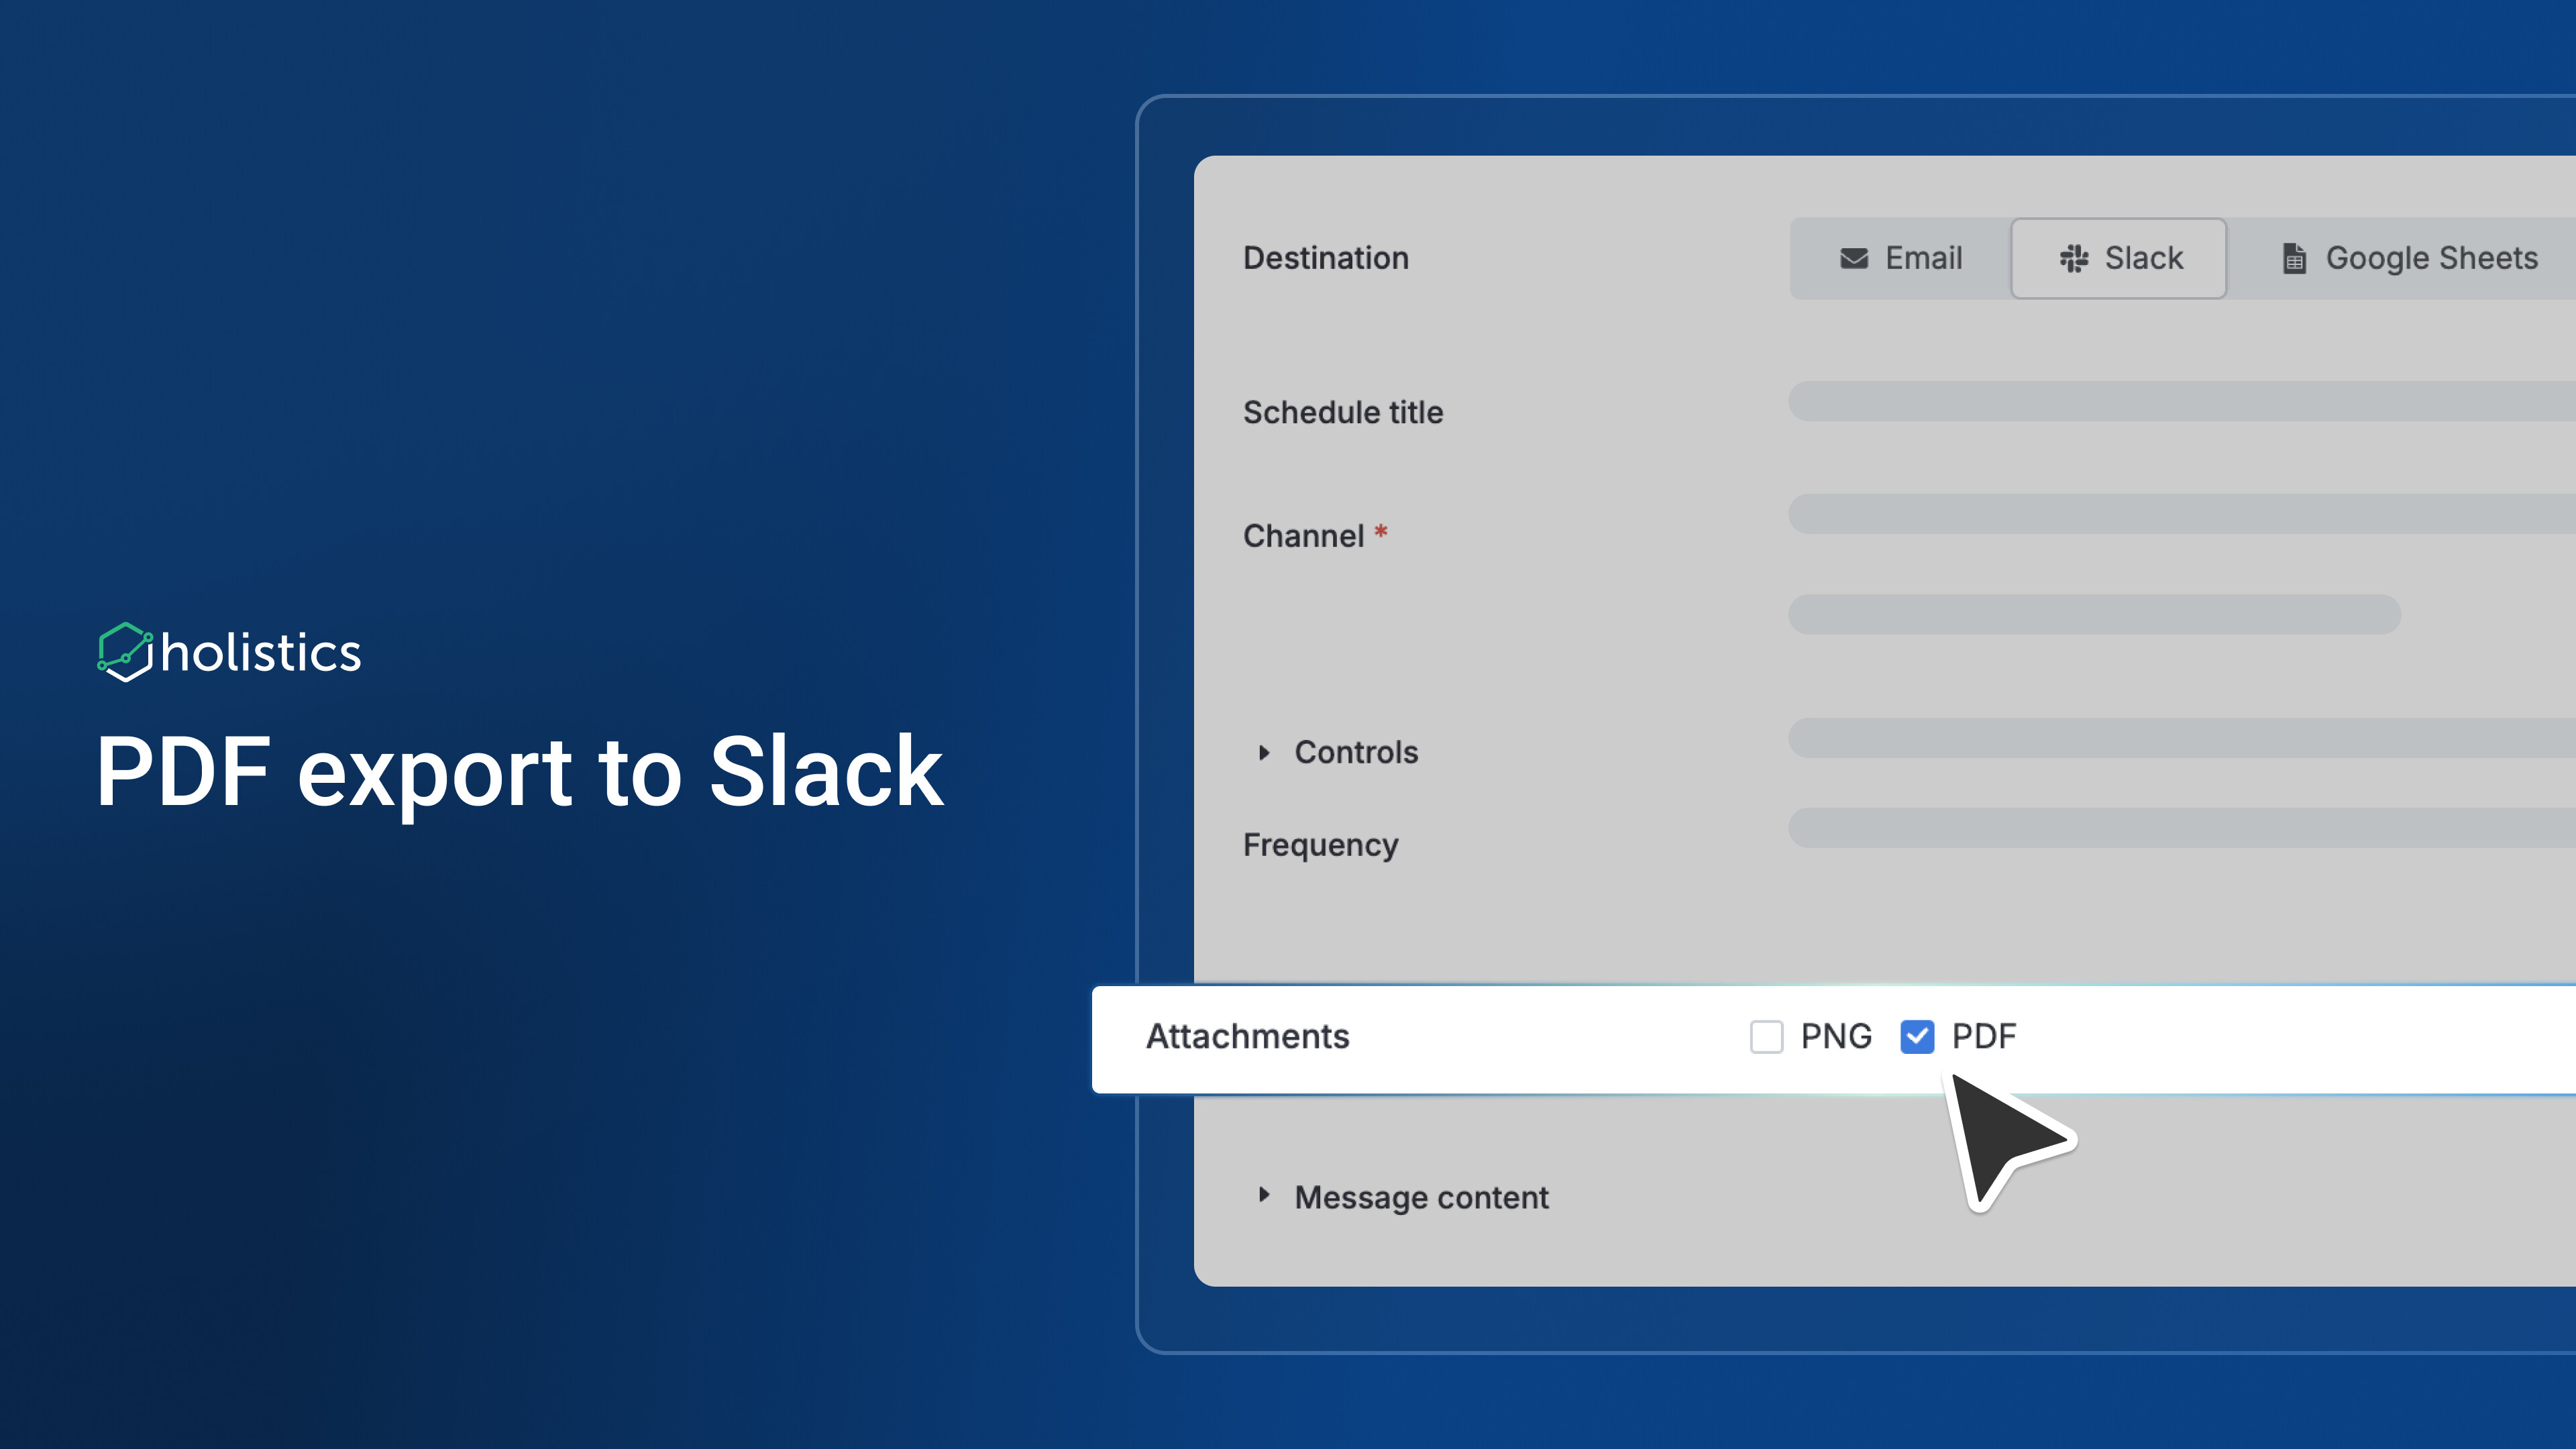
 PDF Export to Slack
No more flooding your Slack channels with 5-10 separate images just to share a dashboard!
We’re excited to announce that you can now export your complete dashboards as a single, professional PDF file.
This feature automatically combines all your selected charts and visuals into one document, keeping your channels tidy and making it easier to share comprehensive reports.
For more information, check our documentation here.
 Layout Assist for Canvas Dashboard (Closed Beta Released)
Canvas Dashboard introduces a flexible, freeform layout. But that freedom sometimes comes with a tax: more time on cosmetic fixes, overlap fixes, manual positioning, spacing adjustments, etc.
Our new Layout Assist solves this. With this feature, you can:
- Trim whitespace automatically to clean up element spacing and improve visual consistency
- Work in non-overlap mode by default for cleaner layouts (hold 2 seconds to switch to overlap mode)
- Shift multiple blocks simultaneously for faster bulk adjustments and reorganization
- Expand canvas automatically as you add content, eliminating manual resizing
 Visualization Mapping View for Canvas Dashboard
Instantly see which conditions and controls affect any chart without hunting through dashboard filters one by one. Click any visualization’s filter icon to get the complete mapping overview in one place.
With this feature, you can:
- View all mappings of the selected visualization at a glance
- Remove unwanted mappings directly from the popover
- Locate the mapping objects with one click
 AI-Generated Descriptions for Tags
Tags make it easier for everyone to find what they need, but only if each tag has a clear, useful description. Writing tag descriptions, however, is boring, repetitive work.
Fortunately, AI does not get bored. Soon, you can use AI to generate clear and concise descriptions for each tag, eliminating manual writing while ensuring uniformity across your content organization system.
Released for AI Alpha users. If you’re interested in trying out Holistics AI, join our waitlist here.
Content Archiving
As analytics workspaces grow, outdated content clutters your environment and confuses users. Content Archiving lets you declutter by hiding outdated content without deleting it.
With this feature, you can:
- Archive content to hide outdated data models, datasets, and dashboards from search
- Preserve historical data in a dedicated archived space
- Get archive recommendations based on inactivity (30/60/90 days)
- Auto-pause schedules for archived dashboards to prevent outdated data delivery Refer to our public docs for more details.
For more information, check our documentation here.
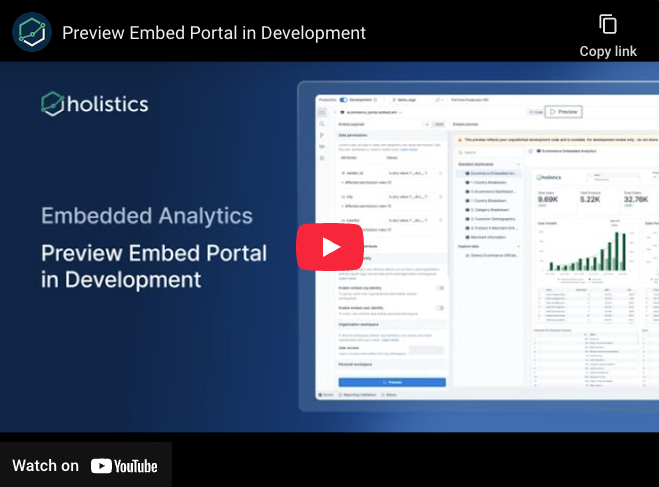
 Preview Embed Portal in Development
Previously, developers had to publish changes to Reporting every time they wanted to test embed portal modifications, creating unnecessary friction and potential production impacts. We now provide an in-development preview that displays exactly how your embed portal will behave without requiring publication first.
With this feature, you can:
- Test changes instantly without publishing
- Catch issues and validate modifications before they hit production
- Enjoy a better developer experience: No more context switching between development and preview environments
See full demo here.
 Coming Soon
Branded Filters
Dashboard controls (filters, dropdowns, inputs) currently clash with your beautifully themed dashboards, creating visual inconsistency that breaks the user experience.
Soon, controls will automatically inherit your dashboard themes for seamless visual harmony.
What’s coming up your way:
- Smart auto-inheritance: Controls automatically adopt the Block container theme colors once defined.
- Intelligent color calculation: The System handles color shades, hover, focus, and disabled states.
Widget-level Filter
Previously, users had to click “Edit” or “Explore” and jump into separate modals just to change basic filters like date ranges or categories, breaking their analytical flow and forcing them to work with one chart at a time.
Now you can apply filters to individual widgets, directly from the dashboard interface, maintaining full dashboard context while you explore. This is our first step toward bringing the complete exploration experience into the dashboard.
With this feature, you can:
- Adjust conditions directly on the dashboard
- See how changes affect multiple visualizations simultaneously
- Make quick data adjustments without losing analytical momentum
 View Underlying Data & Breakdown in Embed Portal
We’re bringing View Underlying Data and Dynamic Dimension Breakdown capabilities to embedded portals.
This feature allows you to:
- Drill down into conversion funnels at granular levels
- Generate shareable links to underlying data views
- Break down dimensions on the fly without building multiple charts
- Provide full data transparency to embedded users
Holistics Referral Program: Share Holistics, Earn $500
Great tools are meant to be shared, and now you’ll get $500 when you do.
We’ve launched our referral program to reward customers who help spread the word about Holistics. If you know any friends who could benefit from a more intuitive analytics platform, send them our way. We’d be grateful for your recommendation. When someone you refer subscribes to Holistics, we’ll send you $500 as a token of our appreciation. ![]()
Learn more about our referral program.

September UX Updates
You can also find all of our September UX Roundup here.
Copy and paste from the navigation tree
You can copy and paste widgets and dashboards directly from the navigation tree into any folder. No extra steps needed.
Copy link with instant feedback
You now get clear, reactive confirmation when a link is copied, so there is no more guessing.
Consistent modes across Dashboards and Datasets
Modes now appear in the same order. You do not need to switch context or second guess which one to choose. The workflow is smoother and more predictable.
Find alerts faster
Search data alerts by ID or by alert name. Use whichever detail you have at hand.