October 16th, 2025
You can’t live on promises.
Some might promise you an entire category, a completely new way of doing the same thing, and then vanish into the smiling mouth of an acquisition. Others promise life-changing technology that turns out to be just sleight of hand: They’re magicians, and the magic trick is us believing them.
We can’t live on promises, and we can’t live without them either.
To build anything at all is to look the universe dead in its indifferent eyes and say, “the hell with the odds”.
Holistics promises a lot of things, too. We promise “AI-assisted self-service”, and every day, we say “to hell with the odds” too.
We say it in every way we can: You’ll see it in the product updates below, and in the messy little snippets I’m probably not supposed to show you. (They’re unpolished, the way all beginnings are.)
- An AI Benchmark Report to track how our AI learns over time, what it gets right, and what it gets wrong, because you can’t improve what you can’t measure. Internal use for now, but soon for everyone.
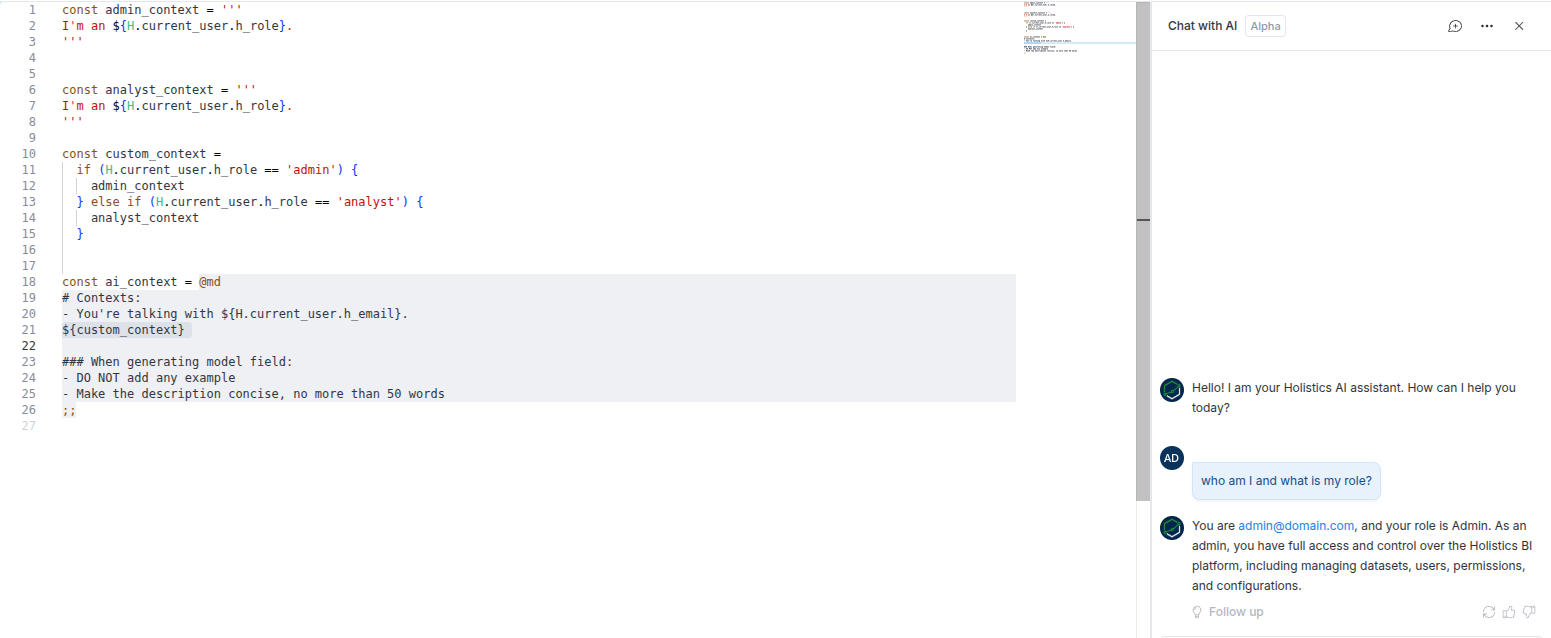
- Org-level context, and programmable prompts where you can inject a user’s attributes directly into the prompt. If you’re using Holistics Embedded Analytics, you can use this to pass customer or tenant context, enabling AI to provide more relevant and accurate responses to your customers’ questions.
- Mobile Mode, stress-tested on a cracked phone to make sure even if our AI becomes sentient, it won’t have the means to conquer humanity.
You can’t live on promises, but at least I hope you see how it’s being held dear.
 Just Released
 Ask Your Chart with AI
The line wiggles, but you’re not sure what it means. You want to dig deepr to see why, to see how, so you ask your analysts, but you have to wait for the stars to align and they’re in a good mood, because they’re under pressure already with ad-hoc requests coming from every direction.
Now, you can just ask AI.
Hover over a chart, click “Ask AI,” and choose from suggested prompts or type your own question to explore deeper without leaving your dashboard.
See the full demo here. For more information, check out our docs here.
 Layout Assist for Canvas Dashboard
Canvas Dashboard introduces a flexible, freeform layout. But that freedom sometimes comes with a tax: more time on cosmetic fixes, overlap fixes, manual positioning, spacing adjustments, etc.
Our new Layout Assist solves this. With this feature, you can:
- Prioritize Non-overlap: Now you can set your blocks to auto avoid overlapping. To switch to overlay mode, just press and hold a block for two seconds.
- Trim whitespace to remove extra space around your elements.
- Shift multiple blocks at once for faster adjustments.
- Auto-expand the canvas as you add new blocks.
See full demo here.

 Custom Tables for View Underlying Data
View Underlying Data helps business users quickly see what makes up this number at the most detailed level. But sometimes there’s just too much detail—people don’t know what to look for.
Now the data team can customize different underlying-data views for a better user experience. For example, when examining revenue metrics, users can choose from curated views like Orders View, Users View, or Products View, each showing only the fields relevant to its context.
With this feature, you can:
- Organize data by different business contexts (e.g., Orders, Users, Products)
- Provide AI with better context for more accurate insights
- Give users flexibility to explore data from the angle most relevant to them
For more information, check our documentation here.
 Custom Dimension List for Drill Down and Break Down
When users drill or break down data, a long list of dimensions can be overwhelming. Now you can curate the list to show only what matters, highlight key dimensions, group them logically (e.g. Locations, Products, Demographics).
With this feature, you can:
- Curate the dimension list to show only relevant dimensions for drill-down and break-down
- Organize dimensions into logical groups for easier navigation
- Create flexible drill-down paths that adapt to different analysis needs
- Enhance AI understanding by providing better dimensional context
For more information, check our documentation here.
 Easier Data Formatting
Formatting data fields used to require navigating to field settings, making changes, and returning to your view. It’s such a tedious back-and-forth process that we all hate.
With this new update, you can now change data formats directly from the table context menu, making formatting adjustments faster and more intuitive.
With this feature, you can:
- Format data directly from tables without leaving your current view
- Access formatting options via context menu for quick adjustments
- Enjoy a refreshed UI that makes formatting more intuitive
- Save time by eliminating navigation between different screens
For more information, check our community post here.
 Archive Recommendations
“Everyone builds dashboards” sounds great in theory, but in practice, it quickly turns into a maintenance nightmare.
- You’ve got hundreds of dashboards with names like P&L_Tom and P&L_new. Everyone’s clicking through duplicates, trying to find the “real” one.
- And when you finally try to clean up, auditing them all by hand feels like Mission Impossible.
Archive Recommendations takes care of that. It automatically identifies inactive dashboards suitable for archival. With this feature, you can:
- Automatically identify inactive dashboards without manually auditing your entire workspace
- Control dashboard sprawl and keep your workspace organized
- Review recommendations safely - viewing items from the list doesn’t count toward view metrics
- Improve search relevance by removing outdated content from user results
See the full demo here.

 Merge Request Workflow for GitLab
GitLab users previously couldn’t enjoy the same streamlined merge request workflow that GitHub users had, forcing them to constantly switch between Holistics and GitLab to manage their changes.
Not anymore. You can now create, monitor, and merge requests directly in Holistics with the same functionality GitHub users enjoy. With this new update, you can:
- Create Merge Requests directly in Holistics with AI-generated titles and descriptions
- Monitor MR status in real-time without opening GitLab
- Auto-publish changes when MRs are approved and merged to your default branch
- Enjoy feature parity with GitHub PR workflow
See full demo here.
 SQL Passthrough for AQL 4.0
Have you ever really, really wished you could just unnest JSON data without going back to edit your model?
Well, your wish (if you ever have one) just came true. You can now leverage native SQL functions directly in your dataset queries, handling JSON unnesting and any database-specific functionality not available in standard AQL, all without leaving your current workflow.
With this feature, you can:
- Extract fields from JSON directly in your dataset queries
- Apply database-specific functions (Postgres, BigQuery, MySQL, etc.)
- Maintain type safety while using native SQL capabilities
- Extend AQL’s power without breaking your workflow or going back to the model
See full demo here.
 Coming Soon
Default Dashboard Template
New dashboards start with Holistics’ default look, forcing teams to manually restyle them for brand consistency—a repetitive process that wastes time and breaks uniformity.
Soon, we will introduce the Default Dashboard template, which allows you to:
- Define a master template once with your brand standards and best practices
- Auto-apply the template to every new dashboard created
- Ensure brand consistency across your entire organization
- Save time by eliminating manual styling work for every new dashboard
See the full demo here.
Holistics Referral Program: Share Holistics, Earn $500
Great tools are meant to be shared, and now you’ll get $500 when you do.
We’ve launched our referral program to reward customers who help spread the word about Holistics. If you know any friends who could benefit from a more intuitive analytics platform, send them our way. We’d be grateful for your recommendation. When someone you refer subscribes to Holistics, we’ll send you $500 as a token of our appreciation. ![]()
Learn more about our referral program.

 October UX Updates
You can also find all of our October UX Roundup here.
New look for shareable link UI
Making it easier to distinguish between different link, with additional space for displaying descriptions and more information

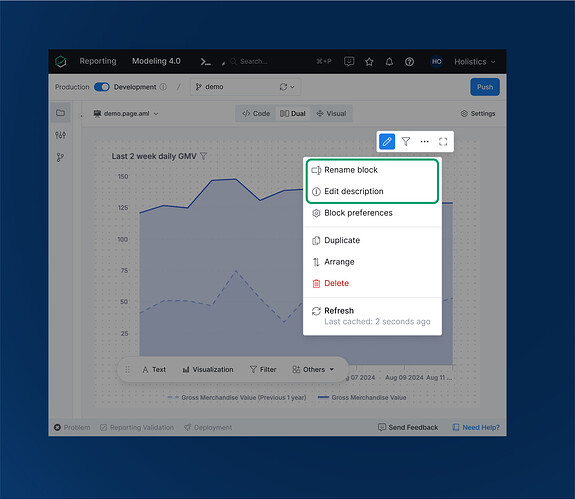
Block Action Menu Enhancement
Adding “Rename block” and “Edit description” options directly to the action menu for improved discoverability
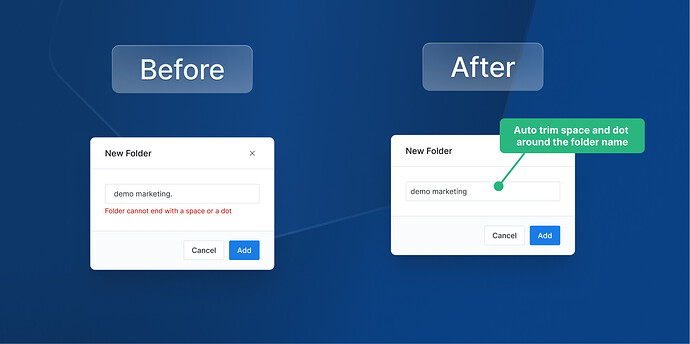
Folder Name Formatting
Enhanced our system to automatically trim spaces around folder names for cleaner organization
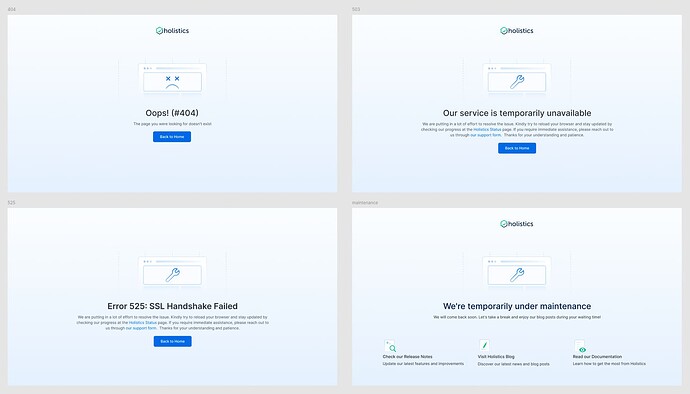
Error Page Illustrations
Updated illustrations on error pages for a more polished look