One must imagine the data analyst happy.
Sisyphus tried to cheat death and was condemned by the Greek gods to an eternity of rolling a boulder up a hill, only for it to roll back down. The data analyst, on the other hand, meets a gentler fate, which is less physically grueling but might be just as mentally defeating: trying to make self-service work.
First, you give users what’s easy. An Excel interface or a drag-and-drop report builder. They can pretty much answer their own questions, with a bit of a learning curve. Then you give them AI, just ask your data a question, and go with whatever comes back.
Self-service is considered done. And the boulder rolls back down.
Because eventually someone asks a follow-up question. Revenue by month, sure, no problem, you say. Revenue by month, for returning customers only, excluding the APAC test accounts, compared to the same period last year. Now you’re not so sure. The drag-and-drop doesn’t drag that far. The AI hallucinates a number that looks right but isn’t. So you, the analyst, step in, write a SQL query, ship a derived table, and tape the answer to a Slack thread. Self-service is considered done (by a human, manually, at 11 pm on a Wednesday)
The next morning, it happens all over again. At least Sisyphus only had one boulder. At least he had a stable hill. The analyst, on the other hand, wakes up every morning to find there are more boulders and the hill is actively getting steeper. Every new business question that the semantic layer can’t handle natively adds weight to the boulder and grade to the slope. Instead of making the work compound, the tool makes the problems compound. So the team does what any reasonable team does: they buy a new tool and migrate. They start fresh, with clean definitions and a pristine semantic layer and a conviction that this time it will be different.
Give it eighteen months, or one must imagine the data analyst happy.
(The only alternative is to imagine a compounding, semantic intelligence, like what we build at Holistics. But that’s the story for another day.)
Released
 Chat to refine your charts
You’ve built a chart. It’s almost right, but you want to change the color, switch the visualization type, or adjust the number format.
Now you can just tell our AI to do exactly that, without starting all over again. Holistics AI can now read your existing visualization and refine it through chat - updating styles, formats, and chart types without you digging through settings panels. It’s a faster way to polish your charts while staying in flow.
See full demo here.

 Automatic email updates for your embedded users
Your embedded users shouldn’t have to log in, ask an analyst, or remember to “check the dashboard” to stay updated.
Now they can simply subscribe to an embedded dashboard with just their email address, and get updates delivered automatically.
This also lays the groundwork for what comes next: bringing email subscriptions (and eventually data alerts) to more self-serve workflows across Holistics.
 Cleaner field description for faster exploration
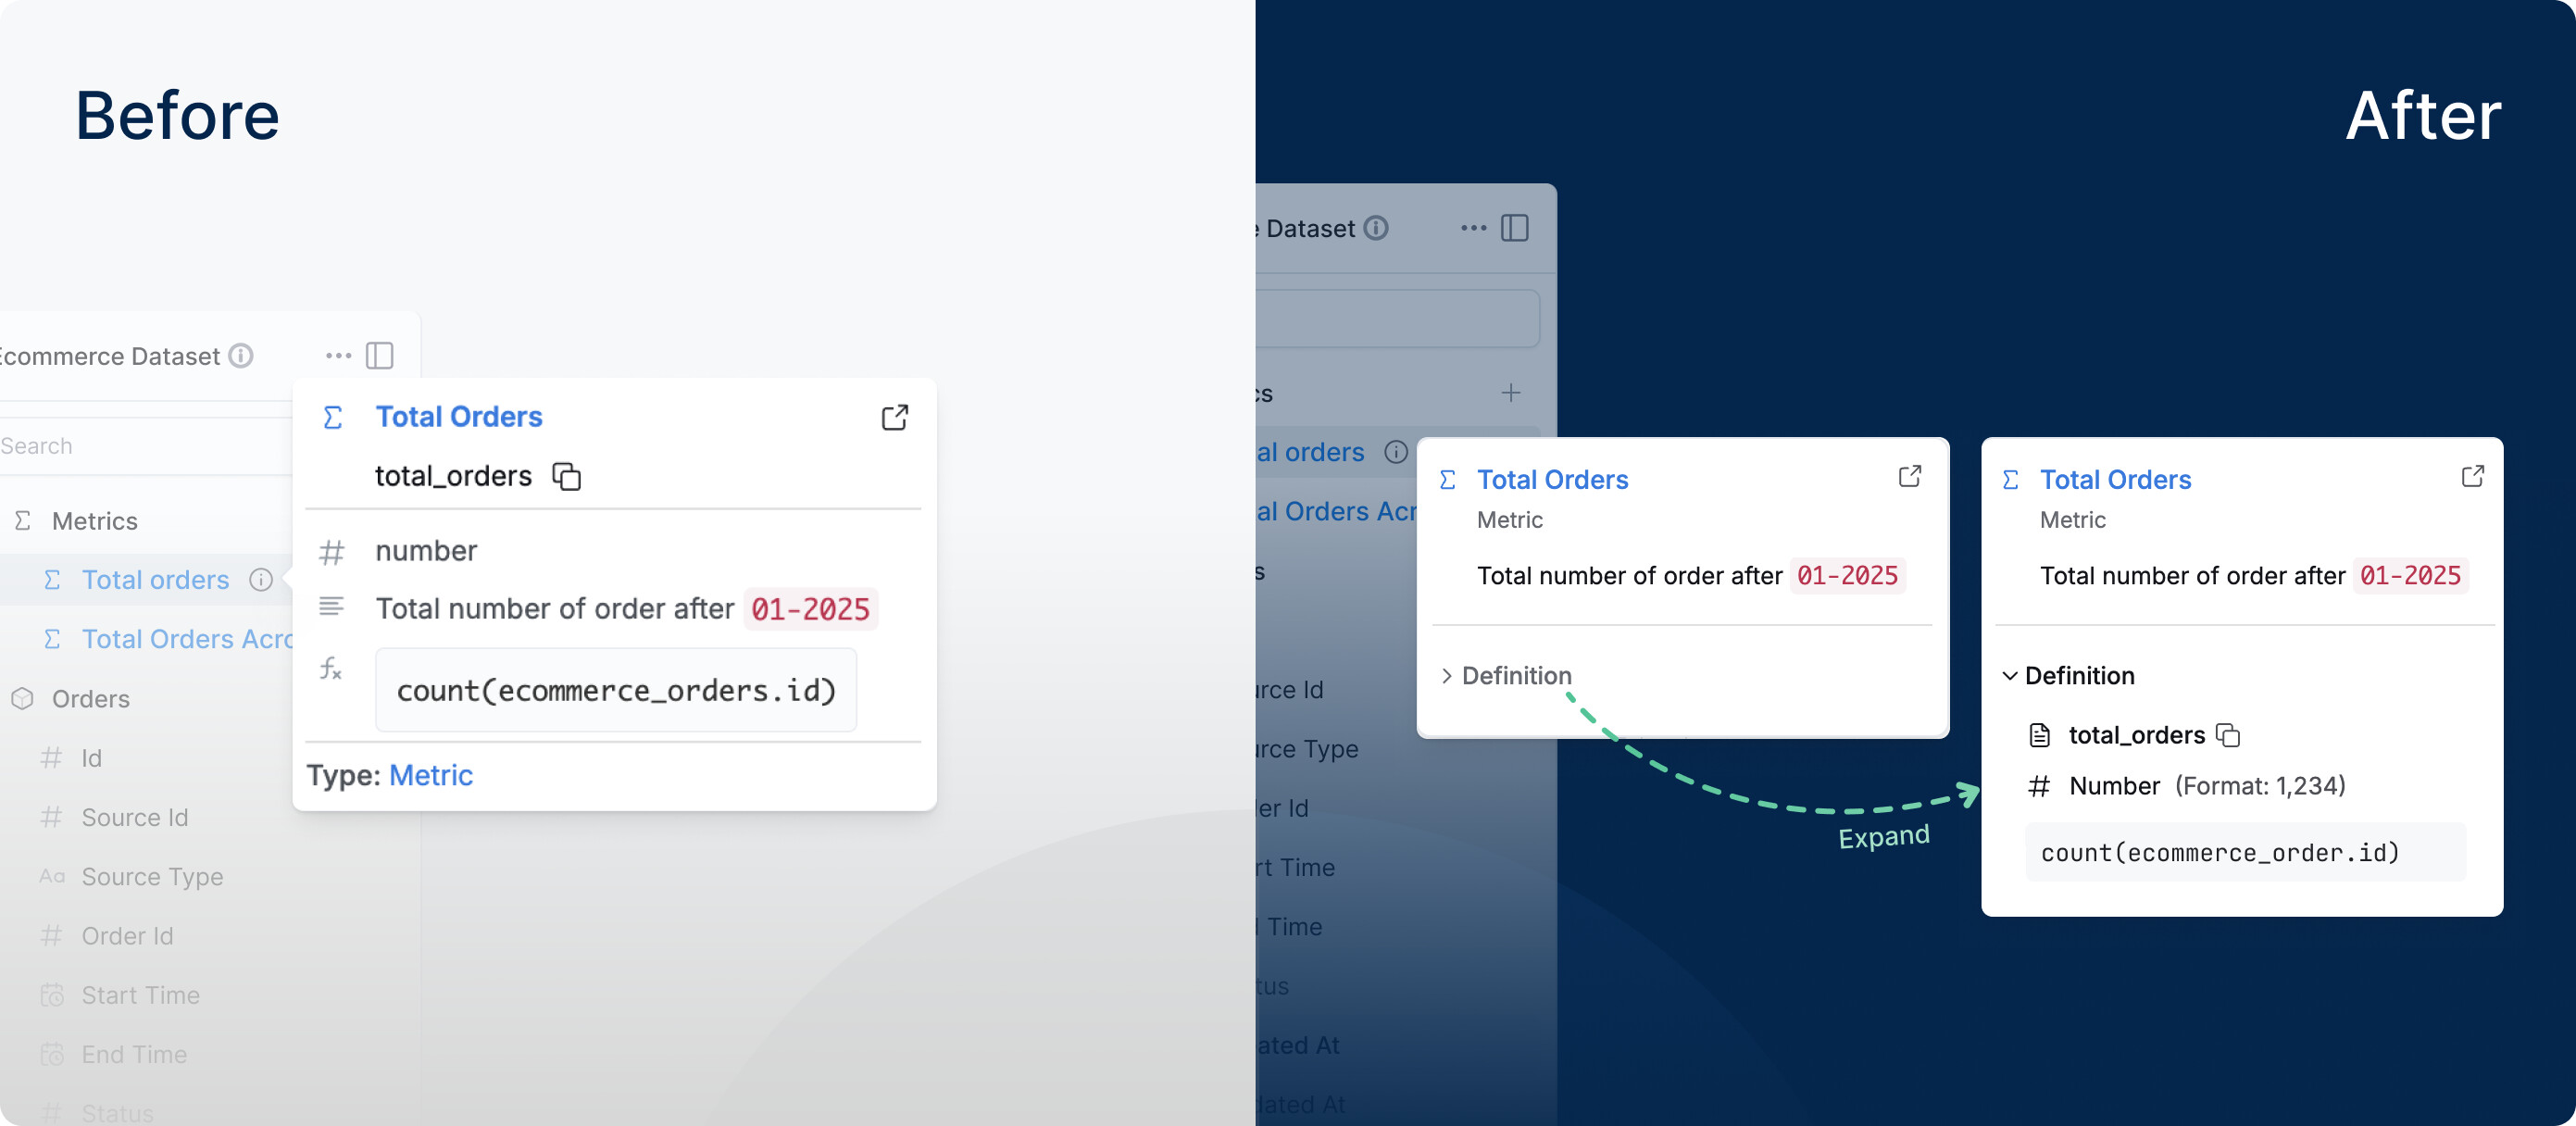
We’ve made field tooltips a lot friendlier for business users.
Before, simply hovering on a field could dump a wall of technical metadata - IDs, model names, formulas - things that are useful for analysts, but might not be useful for explorers.
Now, field tooltips are clean by default: explorers see only what they typically need in the moment - the label and description. And when deeper context is needed, technical details are still there on demand in the Definition tab (formula, model, data type, etc.), without getting in the way of everyday analysis.
 Dynamic Content Block
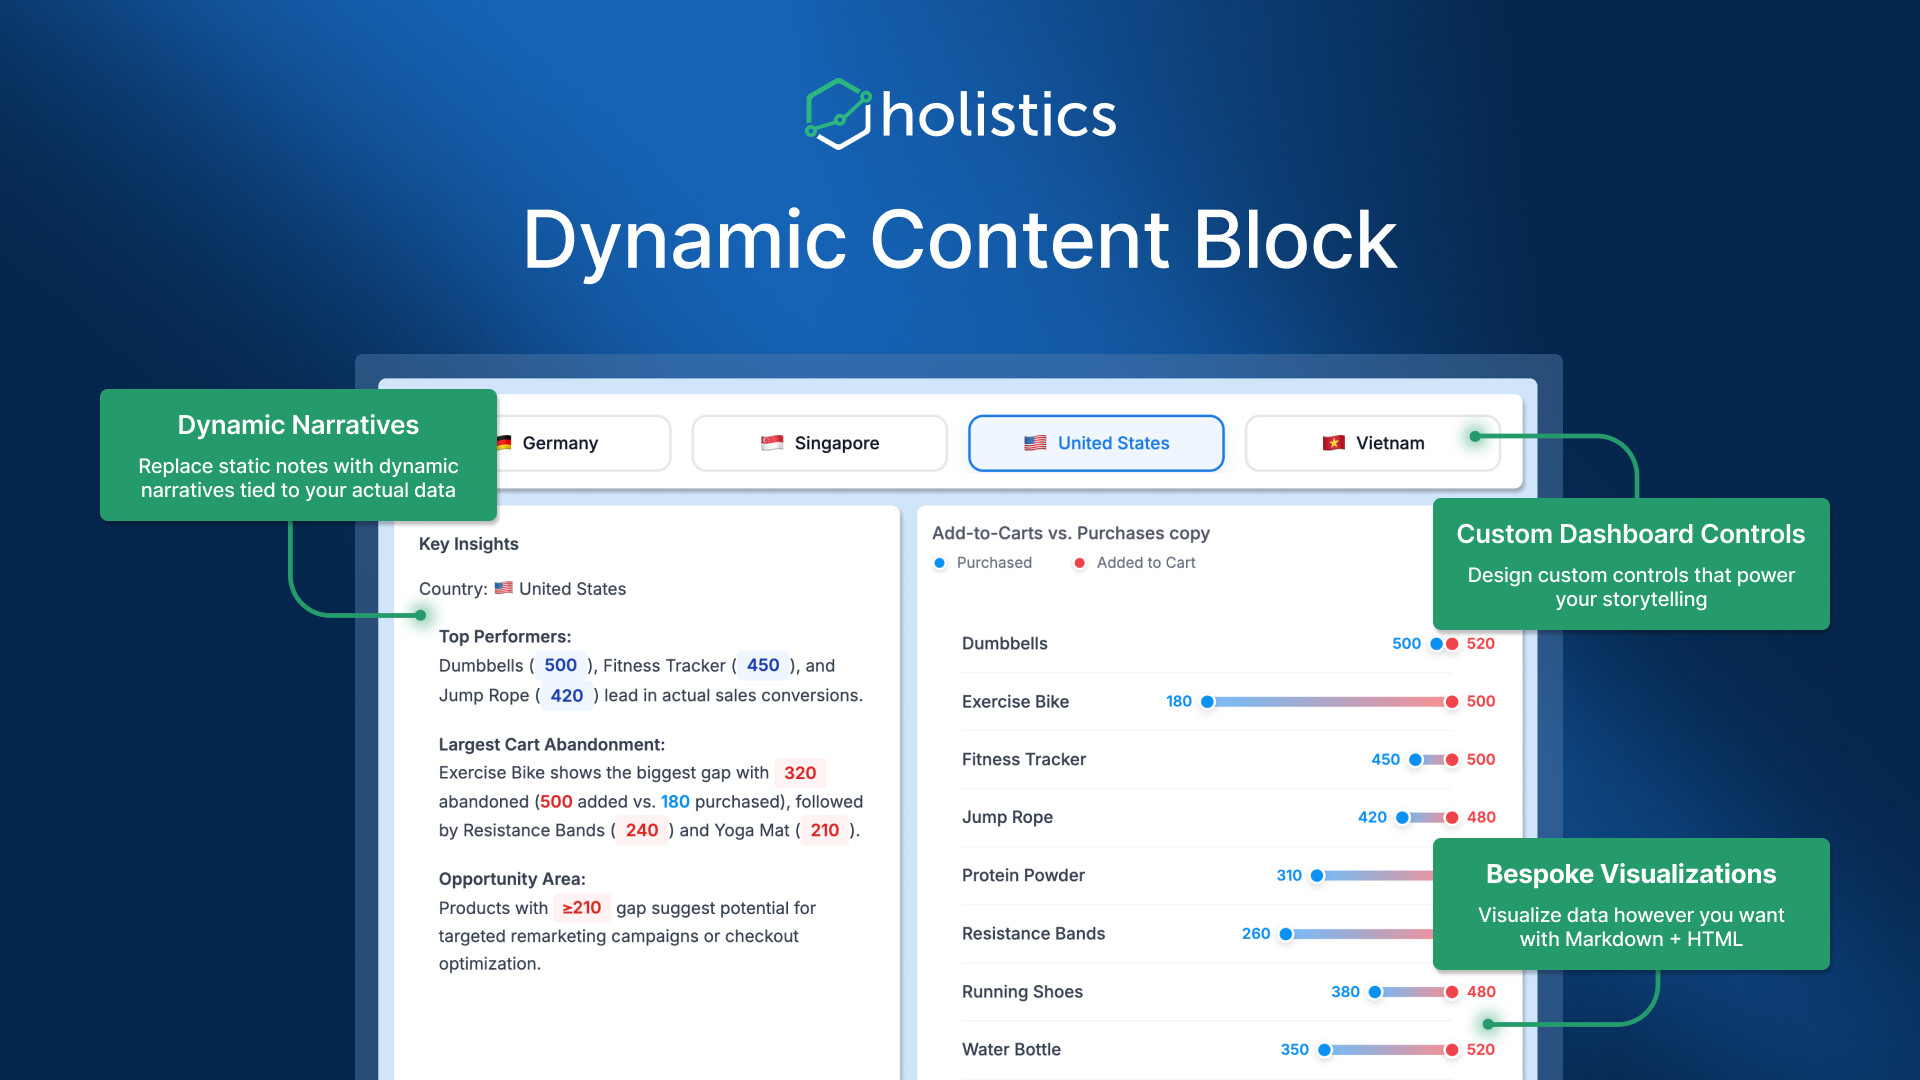
With the new Dynamic Content Block, you can combine HTML, CSS, and templating to build on-brand KPI callouts, executive briefs, or account cards where every value and label auto-refreshes with your data.
The cool thing about this feature is simple: you can drop these dynamic blocks directly into narrative reports, so the story updates itself.
Instead of writing a weekly exec note and then manually replacing every number, you write it once, and the values stay current (and extra fresh) as the data changes.
Read more about this feature here.
 Mobile dashboard view in Reporting
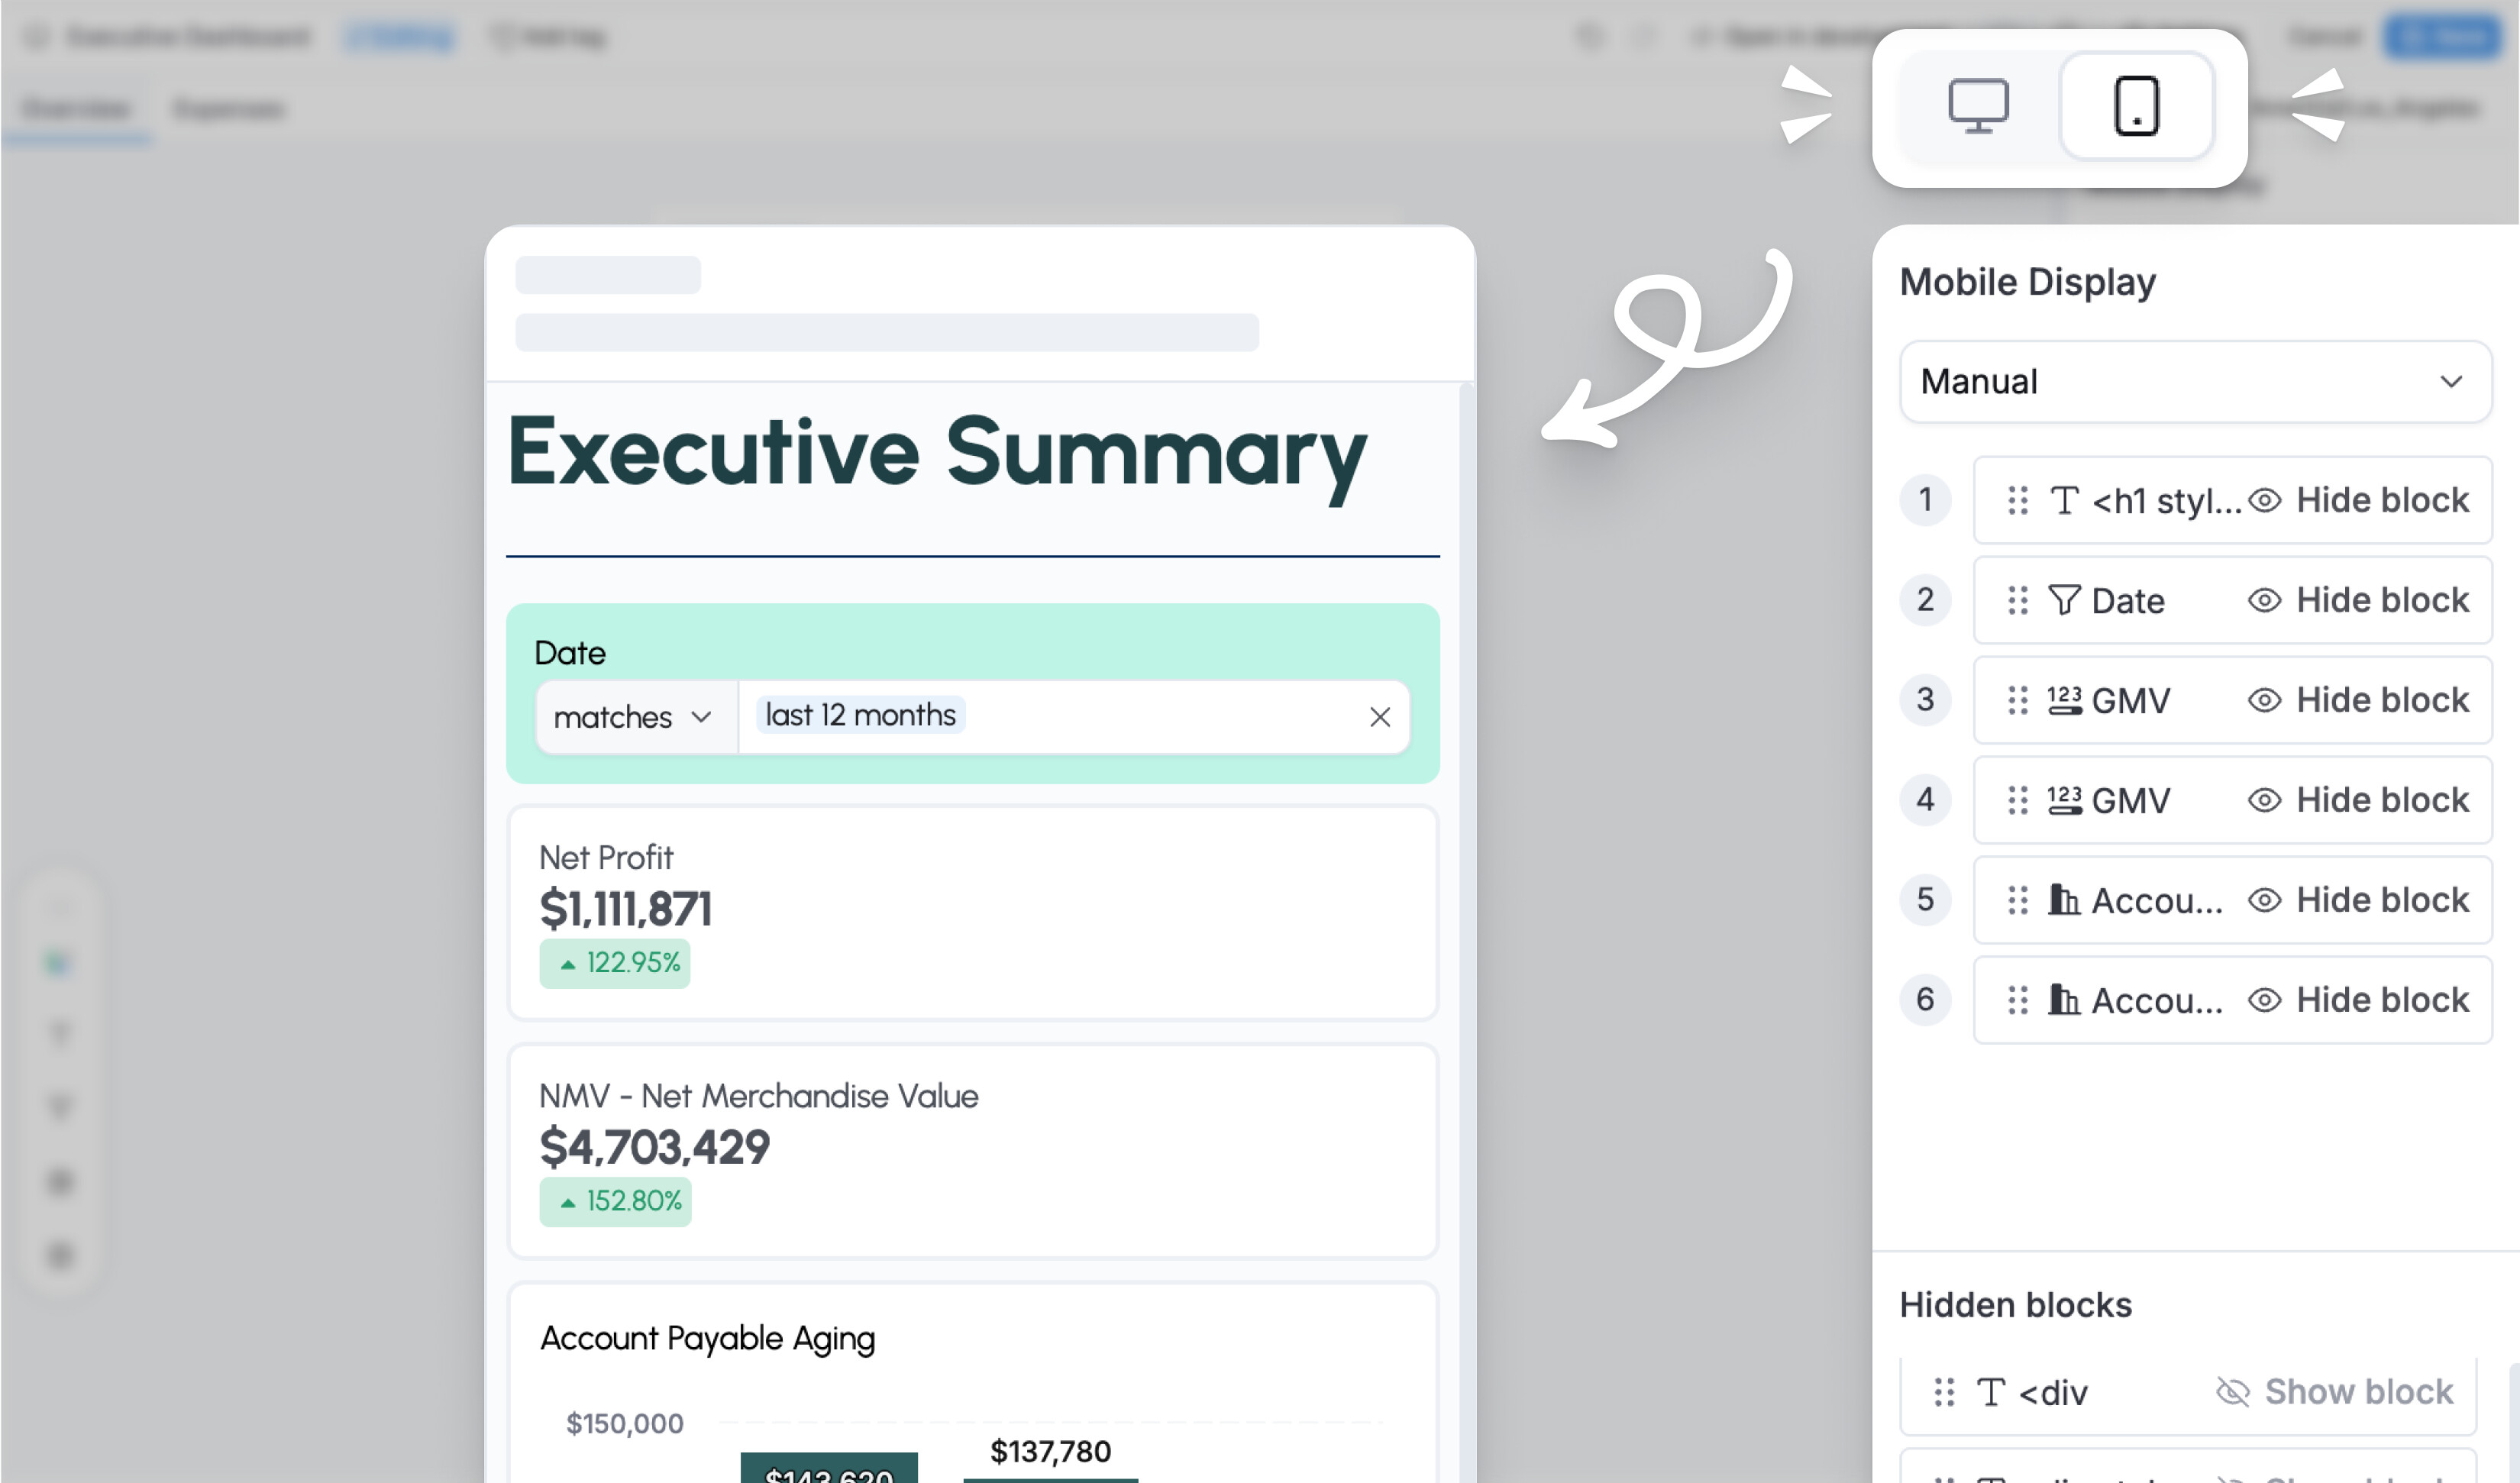
Before, if you wanted to see how your dashboard looked on mobile, you had to ask an analyst for help if you didn’t have access to Development layer. That meant waiting around, creating extra work for them, and generally making things slightly more annoying for everyone involved.
Now you can just switch to mobile view and set up your responsive layout yourself, without taking a detour through the development layer.
For more information, refer to our public doc: Mobile responsiveness
Coming Soon
 Search and reuse saved visualizations with AI
You’re in the middle of exploring. You ask a question, expecting an answer, not another duplicate chart.
Now, Ask AI checks your existing charts and dashboards first before creating anything new. If it finds a relevant visualization, it shows it right away. If not, it generates a new one.
The result is a smoother flow: less rework, more trust in what’s already been built, and faster answers without breaking your momentum.
See full demo here.

 Auto-theming: Set brand colors once, style everything automatically
Styling dashboards shouldn’t feel like coloring in every chart by hand. But for many dashboard builders, that’s exactly what it looks like. It takes time, creates inconsistency, and makes supporting multiple brands harder than it should be.
Not anymore, with auto-theming, you get:
- Brand color setup: Define your core brand identity using just a few colors (primary, accent, text) in your theme’s
ColorThemeblock. - Automatic styling: The system automatically generates consistent styling across all dashboard components — canvas backgrounds, block borders, table headers, chart colors, and more. While the system handles 80% of styling automatically, you can still override specific properties when you need precise control.
- Multi-Brand support: Each theme can carry its own brand identity, making it easy to support different color schemes for different clients or product lines.

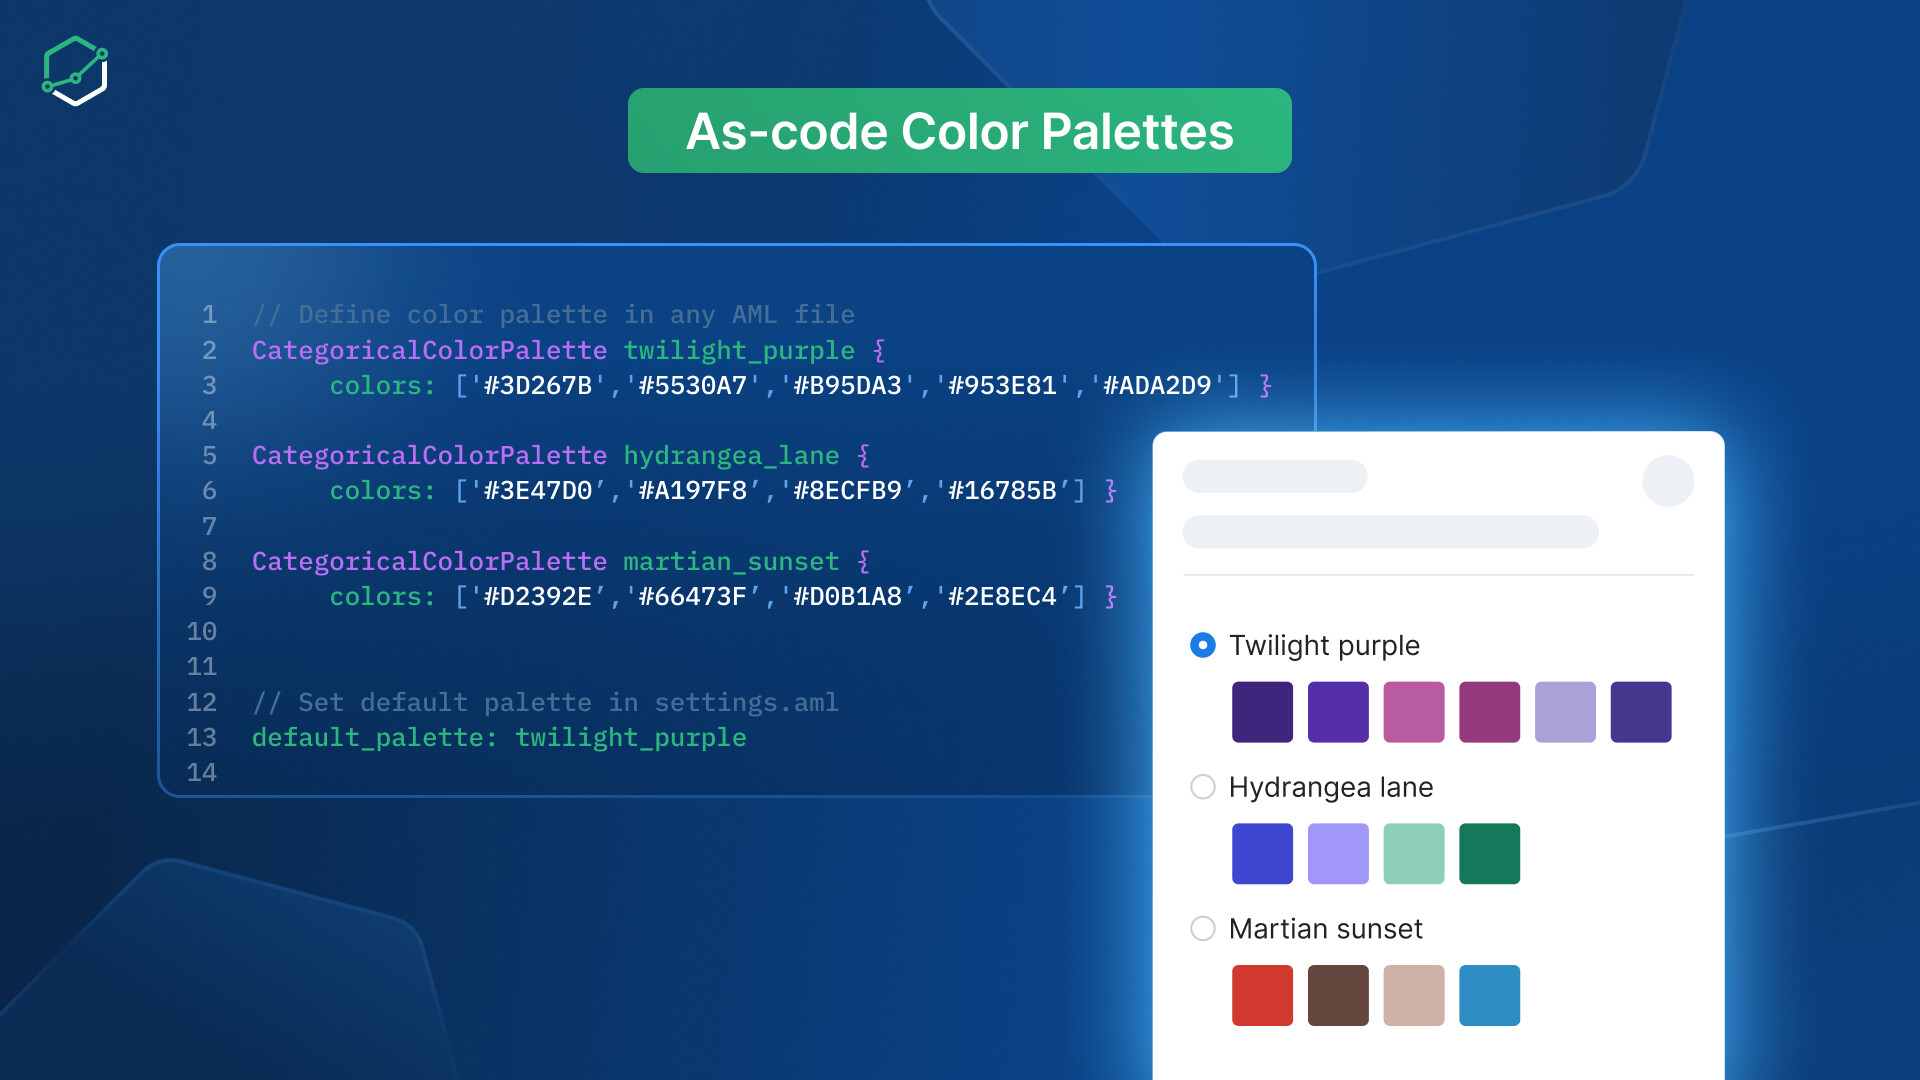
Manage color palettes through code for better reusability
Manually setting colors chart by chart takes too much time. It also makes branding harder to keep consistent, especially when you need to support more than one brand.
You now get:
- Code-First palette definition: Create categorical, sequential, and diverging color palettes directly in AML files alongside your data models.
- Workspace defaults: Set a default color palette at the workspace level, ensuring all newly created dashboards automatically use your brand colors.
- Multi-Level referencing: Reference palettes at any level — project-wide, per theme, or per individual chart. Lower levels always override higher ones for precise control.
- True reusability: Changes to a palette automatically propagate everywhere it’s referenced. Update once, apply everywhere.
 February and March UX Updates
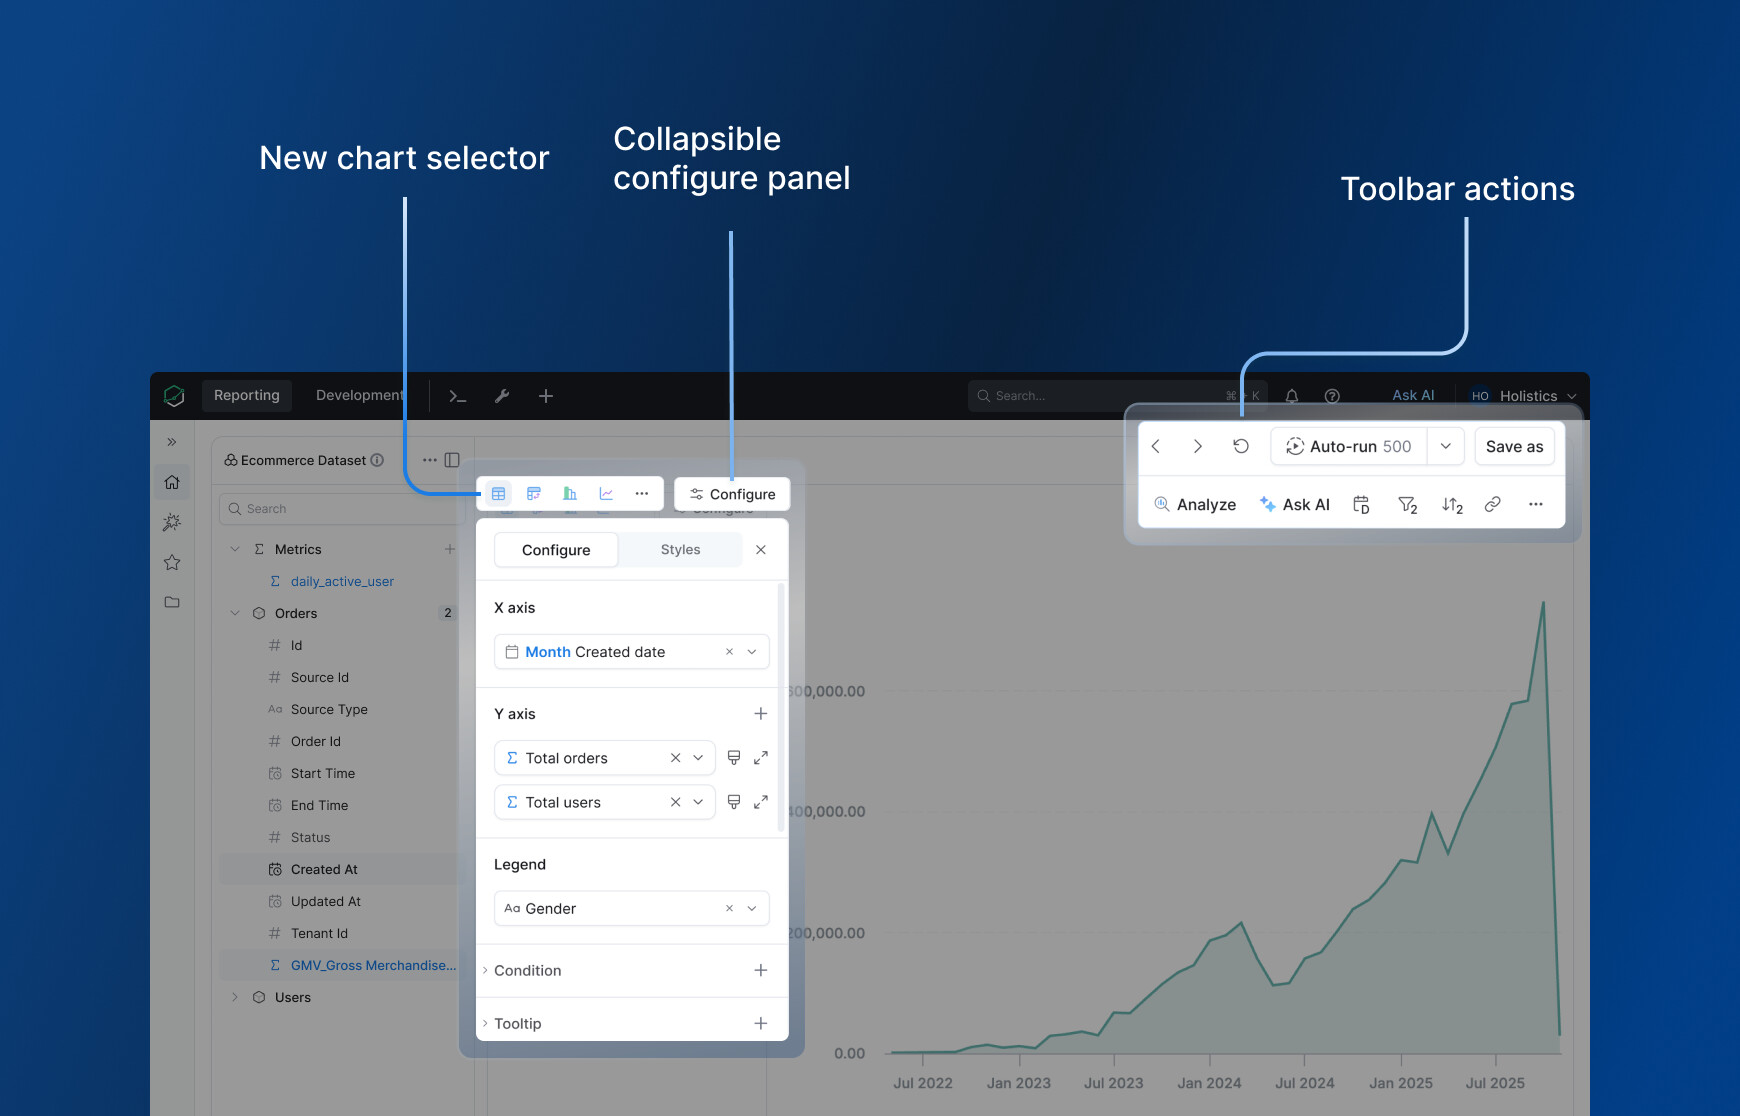
A Simpler Explore Experience
We’ve refreshed the Explore interface to make exploration feel faster and more direct.
Before, many useful actions were hidden inside the visualization settings panel, adding extra clicks just to explore your data. Now, the key actions are right up front.
As soon as you open Explore, you can work directly with the chart, toolbar, and dataset panel to filter, slice, and understand your data without digging through settings.
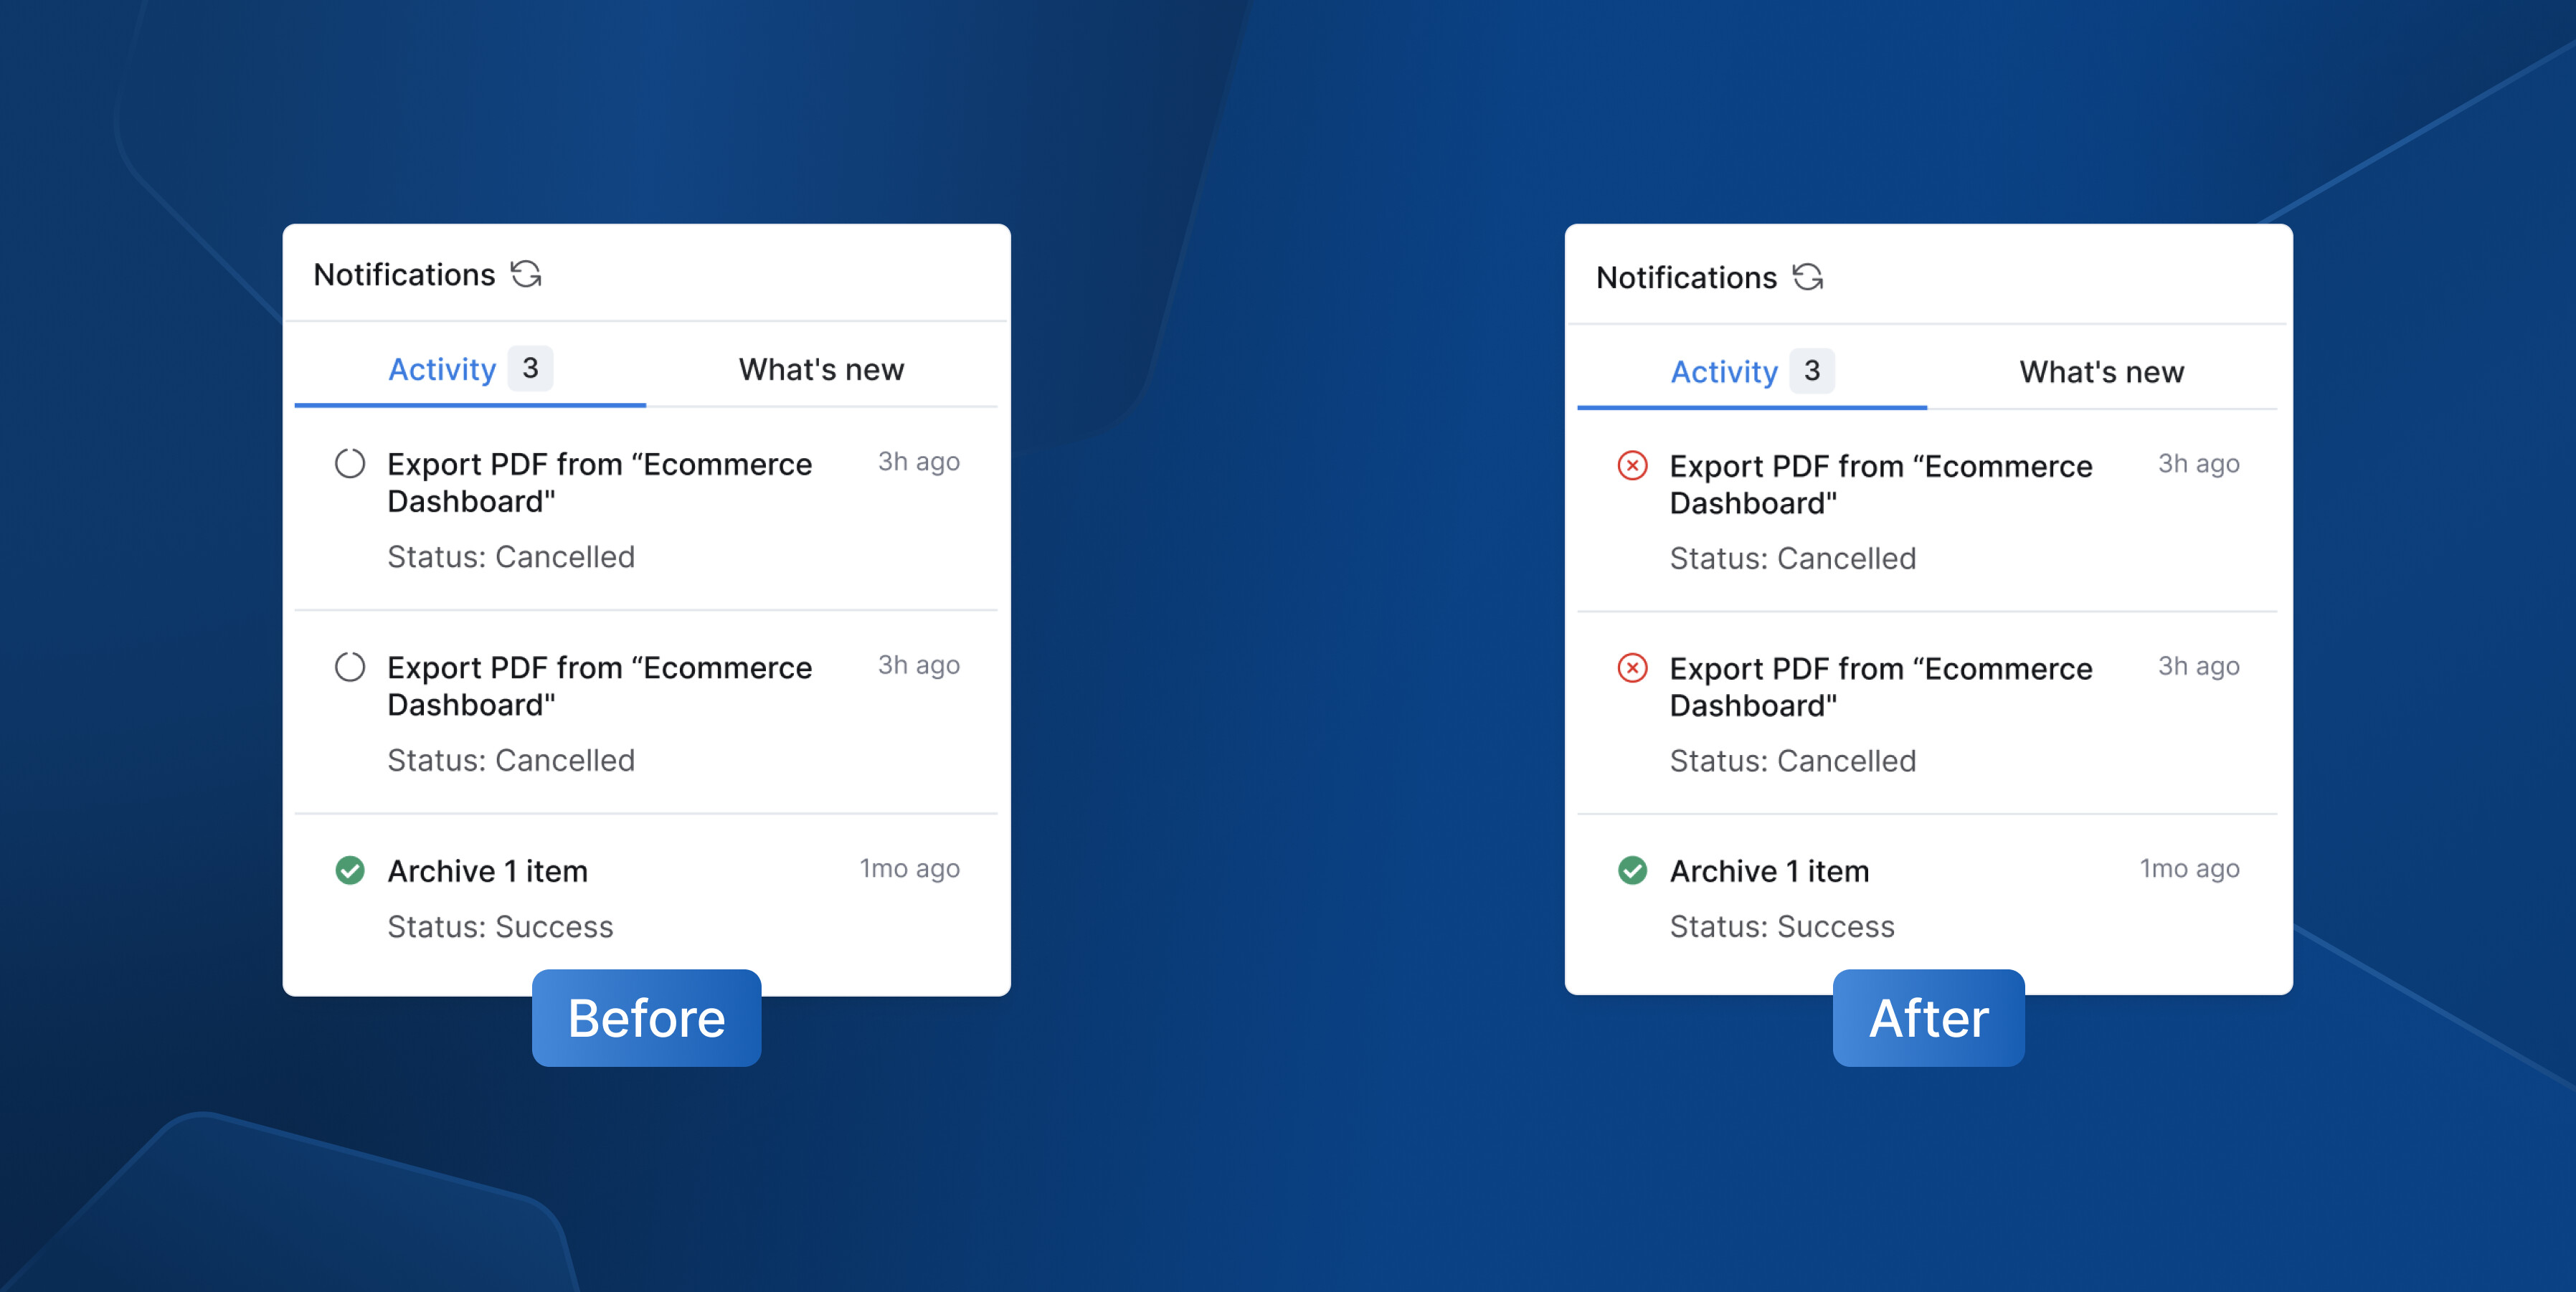
Notification status
We corrected an issue where the loading icon remained in notifications even after an export job was canceled. It will now display an “error” icon instead for better status indication.
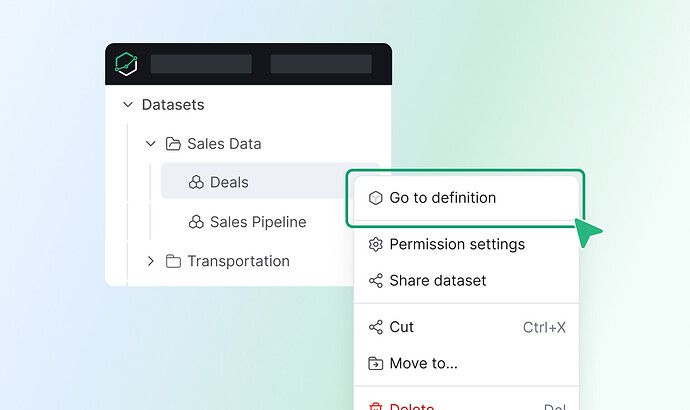
Dataset navigation to development
Added quick access to dataset definitions directly from the sidebar for faster navigation.
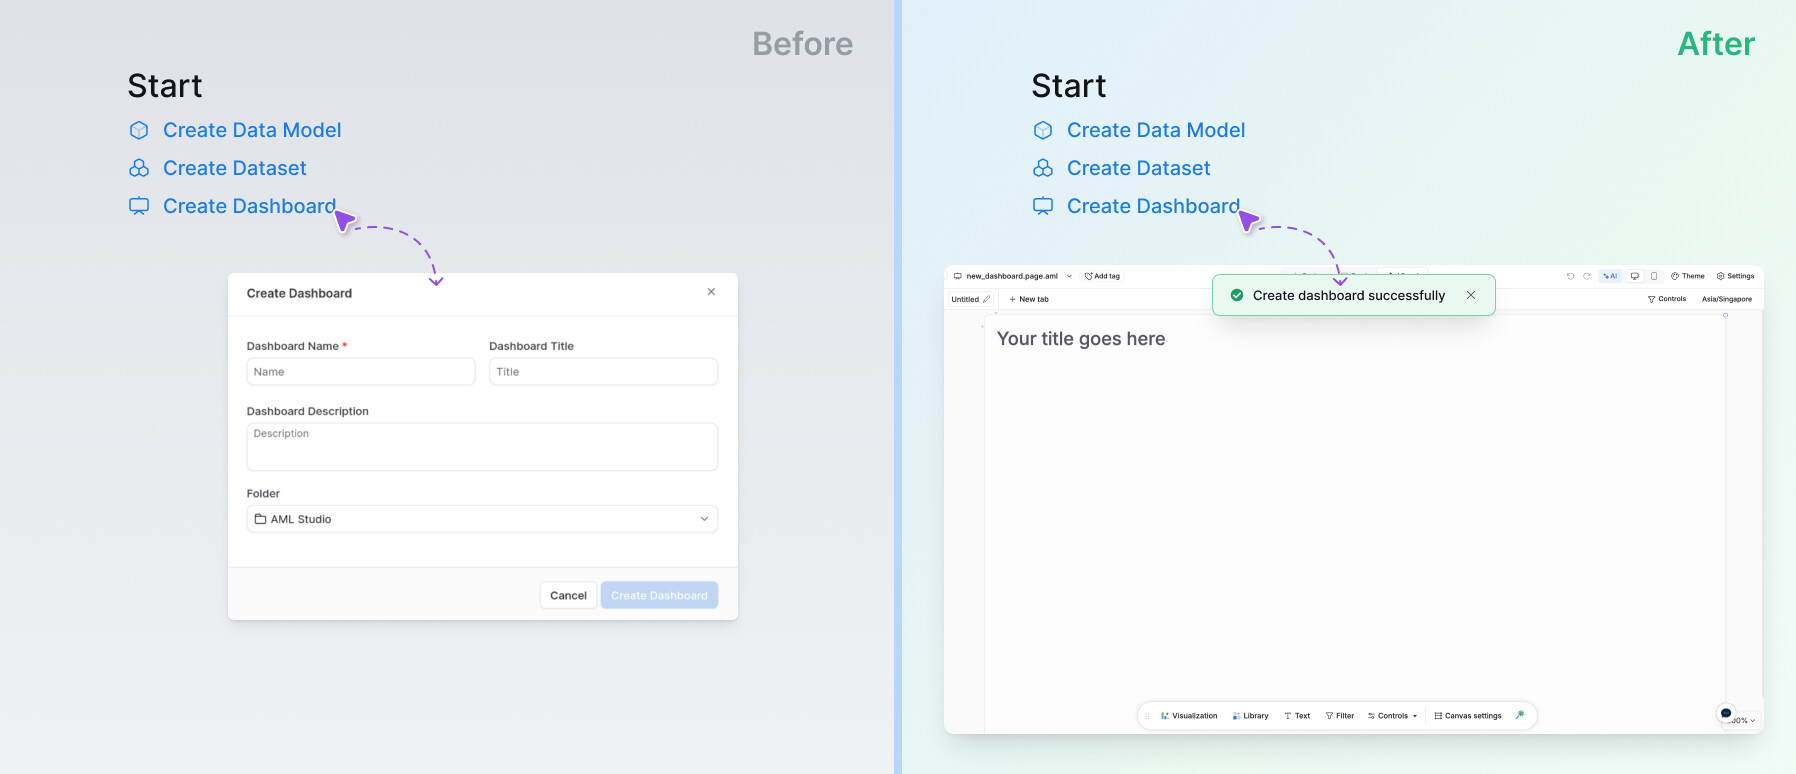
Create dashboards in the Development home
Simplified the “Create Dashboard” flow to align with the Tree experience. You now go directly to the dashboard without pre-filling a modal.