December 17th, 2025
Context is everything.
Take this story, for example: A small, smiling doll appears in a family’s home.
The parents tell the children they are strictly forbidden from touching it, or it will lose its “magic.” Every night, while the family sleeps, the doll moves to a new location in the house, watching them intensely. It is said to report the family’s daily behaviors to a higher power.
It’s “Elf on the Shelf”, retold without festive context.
Or, this one: A creature is born with a glowing, radioactive deformity on its face. Because of this mutation, he is socially ostracized and verbally abused by his peers and elders until a foggy night when the tribe leader realizes the mutant’s deformity can be exploited for labor during hazardous weather conditions.
You can already guess: It’s Rudolph the Red-Nosed Reindeer.
Context is everything. The same is true when you deploy AI assistants to business users. The right contexts enable AI to provide organization-specific answers grounded in your definitions, and to understand that “churn” means customer attrition, not butter production.
This month, we bring you more ways to control and customize context so that AI can speak your language as if it’s already part of the team from day one. Try it out and let me know what you think.
 Just Released
 Context Control
As you get more comfortable working with data, your questions for AI naturally get more ambitious, for example: Do accounts that adopt Feature X within 30 days have higher ACV and lower churn than those that don’t?
That question spans multiple datasets, Product, Sales, and Finance, so to answer that well, AI needs a little hint, and we’ve made it easier to tell AI where exactly it should look.
Just mention the dataset, dashboard, or report you want it to use, and Holistics AI will treat it as the foundation for more accurate answers.
 There are two ways to add context:
- Pinned context: Set it once, and it stays in place for the whole conversation.
- Inline context: Add it to a specific question when you only need it that one time.
With this feature, you can:
- Get more accurate, grounded answers by explicitly specifying which dataset, dashboard, or report AI should reference.
- Control the scope of AI’s responses by defining precisely what AI should (and shouldn’t) analyze.
Embeddable AI (Ask AI in Embed)
You already have a great product, so why not make it even stickier (and unlock a new revenue stream) by delighting your customers with a built-in, personalized AI assistant?
Earlier this year, we launched Embed Portal, which lets our customers add a mini BI experience directly into their products and give their users full drag-and-drop report-building capabilities.
Now we take it a step further: Ask AI is now available in our Embed Portal.
You can give customers a simple, ChatGPT-style interface where they type a question and get going. Our new Ask AI automatically determines the intent and selects the appropriate knowledge source to deliver the right answers.
 Default Dashboard Template on Reporting Dashboards
With Canvas Dashboard, you can easily create bespoke, on-brand dashboards; however, you can’t reuse them.
Every new dashboard means rebuilding those same design choices from scratch - adjusting colors, tweaking fonts, setting spacing standards. It’s repetitive work that breaks consistency across your organization.
Now you can with the Default Dashboard Template: define your brand standards once, and every new dashboard inherits them automatically.
With this feature, you can:
- Define a master template once with your brand standards and best practices
- Auto-apply the template to every new dashboard created
- Ensure brand consistency across your entire organization
- Save time by eliminating manual styling work for every new dashboard
 Search by Item’s Description
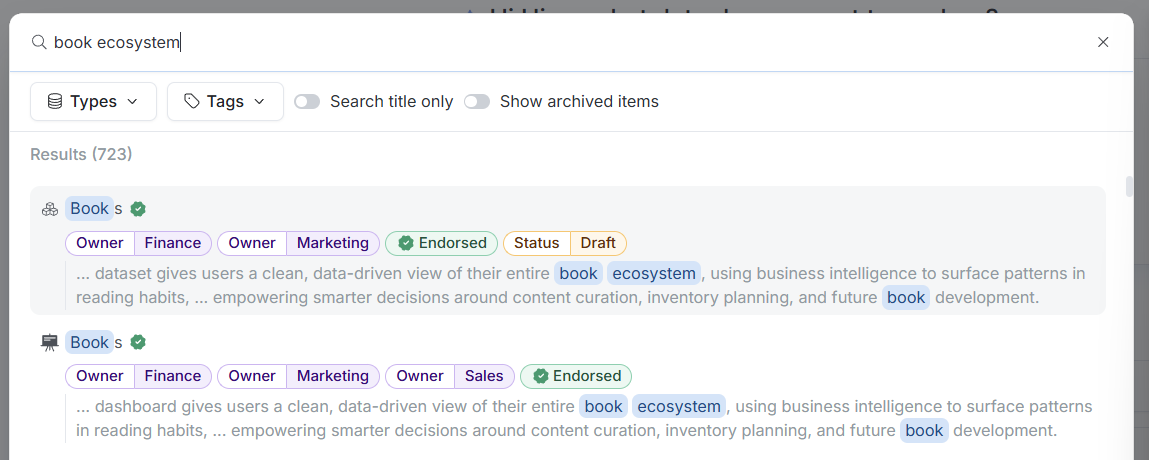
When users type to search, the system will now match keywords against both an item’s Title and its Description, helping you find items even if you only remember what the content does. You can always switch back to Title-only search if needed.
With this feature, you can:
- Find items by what they do, not just what they’re named
- Switch to Title-only search when you need more precise filtering
For more information, check our community post here.
 Canvas Dashboards in Personal Workspace (Beta)
Previously, only Quick Dashboards were supported in Personal workspaces. If you wanted to build a Canvas Dashboard privately, you had to wait for an admin to set up private folders in the Public workspace.
That wait is now gone.
With this feature, you have:
- Create and save private Canvas Dashboards without waiting for administrative setup
- Govern with Git control. Since Canvas Dashboards are “as-code,” any dashboard you create in your Personal workspace will be instantly trackable, versionable, and manageable using Git.
This feature is currently available only in the Reporting environment. Support for personal dashboards in the Development environment is being considered for a future update, and we’ll share updates as plans evolve.
 Calculation Builder
We’ve made a few updates to the Calculation Builder to make metric creation feel more flexible (and a lot more intuitive):
- You can now use the Calculation Builder in the development space, so you get a faster, friendlier GUI for creating and testing metrics before publishing.
- Switching between Calculation Builder and Formula view is now quick and painless; use whichever mode you like.
- Advanced analytics functions are now better supported in the Calculation Builder, for example:
- Period-over-period, percent of total, and moving average are now powered by AQL, so you can extend them and combine them with other metrics.
- Period-over-period calculations automatically match the date granularity in your visualizations, so you don’t have to babysit it anymore.
See full demo here.
 Coming Soon
Cancel Request on Ask AI
You ask AI a question. Five seconds in, you realize it’s the wrong question. Or maybe it’s taking too long and you want to try a different approach. But you’re stuck - the AI keeps processing, and you can’t move forward.
Soon, you’ll be able to stop it. Hit cancel mid-processing and immediately move on to your next query.
 Holistics Referral Program: Share Holistics, Earn $500
Great tools are meant to be shared, and now you’ll get $500 when you do.
We’ve launched our referral program to reward customers who help spread the word about Holistics. If you know any friends who could benefit from a more intuitive analytics platform, send them our way. We’d be grateful for your recommendation. When someone you refer subscribes to Holistics, we’ll send you $500 as a token of our appreciation. ![]()
Learn more about our referral program.

 December UX Updates
Small UI bug
While small UI bugs don’t affect functionality, we understand that they can be frustrating and may give the product a less polished, professional look.
We’ve taken the time this month to address these bugs, with one notable fix being the adjustment of the spacing between the search box and the CTA.

Conditional formatting
Have you ever applied conditional formatting, added the necessary values, and then accidentally clicked outside, losing all the changes you just made?
We’ve heard your frustration. Now, if you accidentally click outside, the popover won’t close anymore. Your changes will only be applied once you click the “Apply” button.

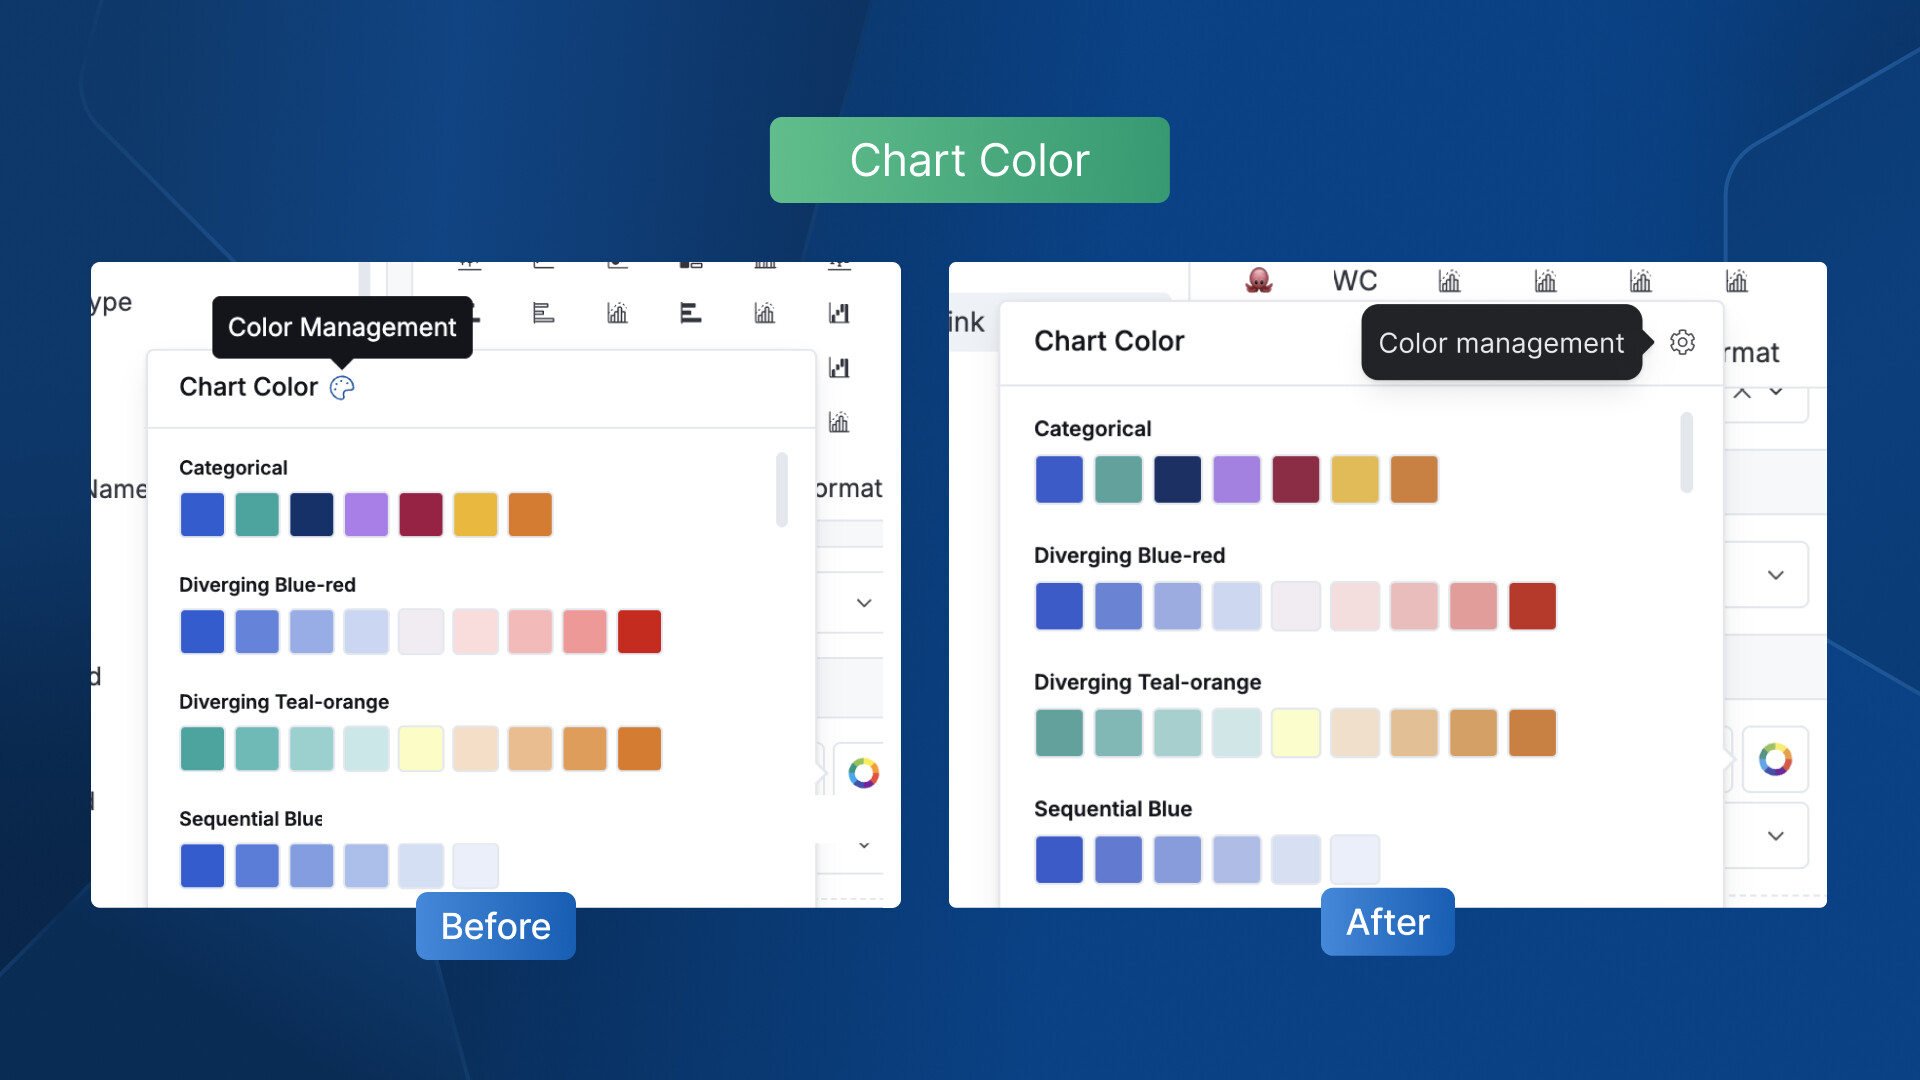
Chart color
We believe that even small changes can enhance your experience. That’s why we’ve replaced the ambiguous color palette icon with a more intuitive settings icon. It’s now easier for you to recognize where you can manage chart colors.
That’s it for this month! A few small changes, we hope, that make a lasting difference for good. Your feedback and suggestions keep us moving forward, so stay tuned as more updates and improvements are on the way!