Monday, April 14, 2025
“You have to kill the loop,” he told me.
If anyone knows what they’re talking about, it’s him. The antithesis of empty rhetoric. An industry veteran. He was using Tableau back when it was just a scrappy 20-person startup across from his office, dreaming of turning dashboards into paintings. He later managed a half-million-dollar-a-year Looker account when it was still a BI darling with a cool semantic layer, long before it became Google’s redheaded stepchild.
He’s also one of Holistics’ most supportive customers.
Fours years ago, he first brought us into a 2,000-person organization, giving feedback so brutally honest that our product manager still wakes up in cold sweats. Now he’s back, using Holistics again at one of Europe’s fastest-growing startups. He’s blunt but fair. Customers like him make us better.
“Kill the loop?” I asked. Loops are usually great. Product teams want feedback loops, and marketers chase after growth loops.
“We’ll still build standardized reporting, that’s our job,” he explained.
“But no one should have to loop back to us just to ask, ‘Hey, I just launched feature X—how many folks are using it? What’s their profile?’ They should be able to do that themselves, without bouncing back and forth between our team and their board meetings or business discussions.”
And that’s exactly the loop we’re hunting down. You’ll see it clearly in this month’s updates: easier exploration for business users (drill downs, view underlying data, tabs) and smoother development workflows for data teams (new CLI, quick search and replace, PR workflows).
By the way, did I mention we love hearing from you? If you’ve got feedback, ideas, or even just want to yell at us, book a review call with our team here.
 Tabs for Canvas Dashboard! (Now In Beta)
Monday morning. Board meeting coming. Your boss needs metrics, and they need it fast. Yet, you find yourself scrolling through cluttered information and interwoven dashboards.
What if you can navigate complex data stories as easily as browsing your favorite website?
This is why we’ve built Tabs for Canvas Dashboards: your data story gets structured and you can break things into neat little sections, like chapters in a book.
Why you’ll love it:
- Jump to the right section with one click.
- Group related charts and metrics together.
- Keep filters synced across tabs for a smooth experience.
Available in Beta now, with full release in May 2025!
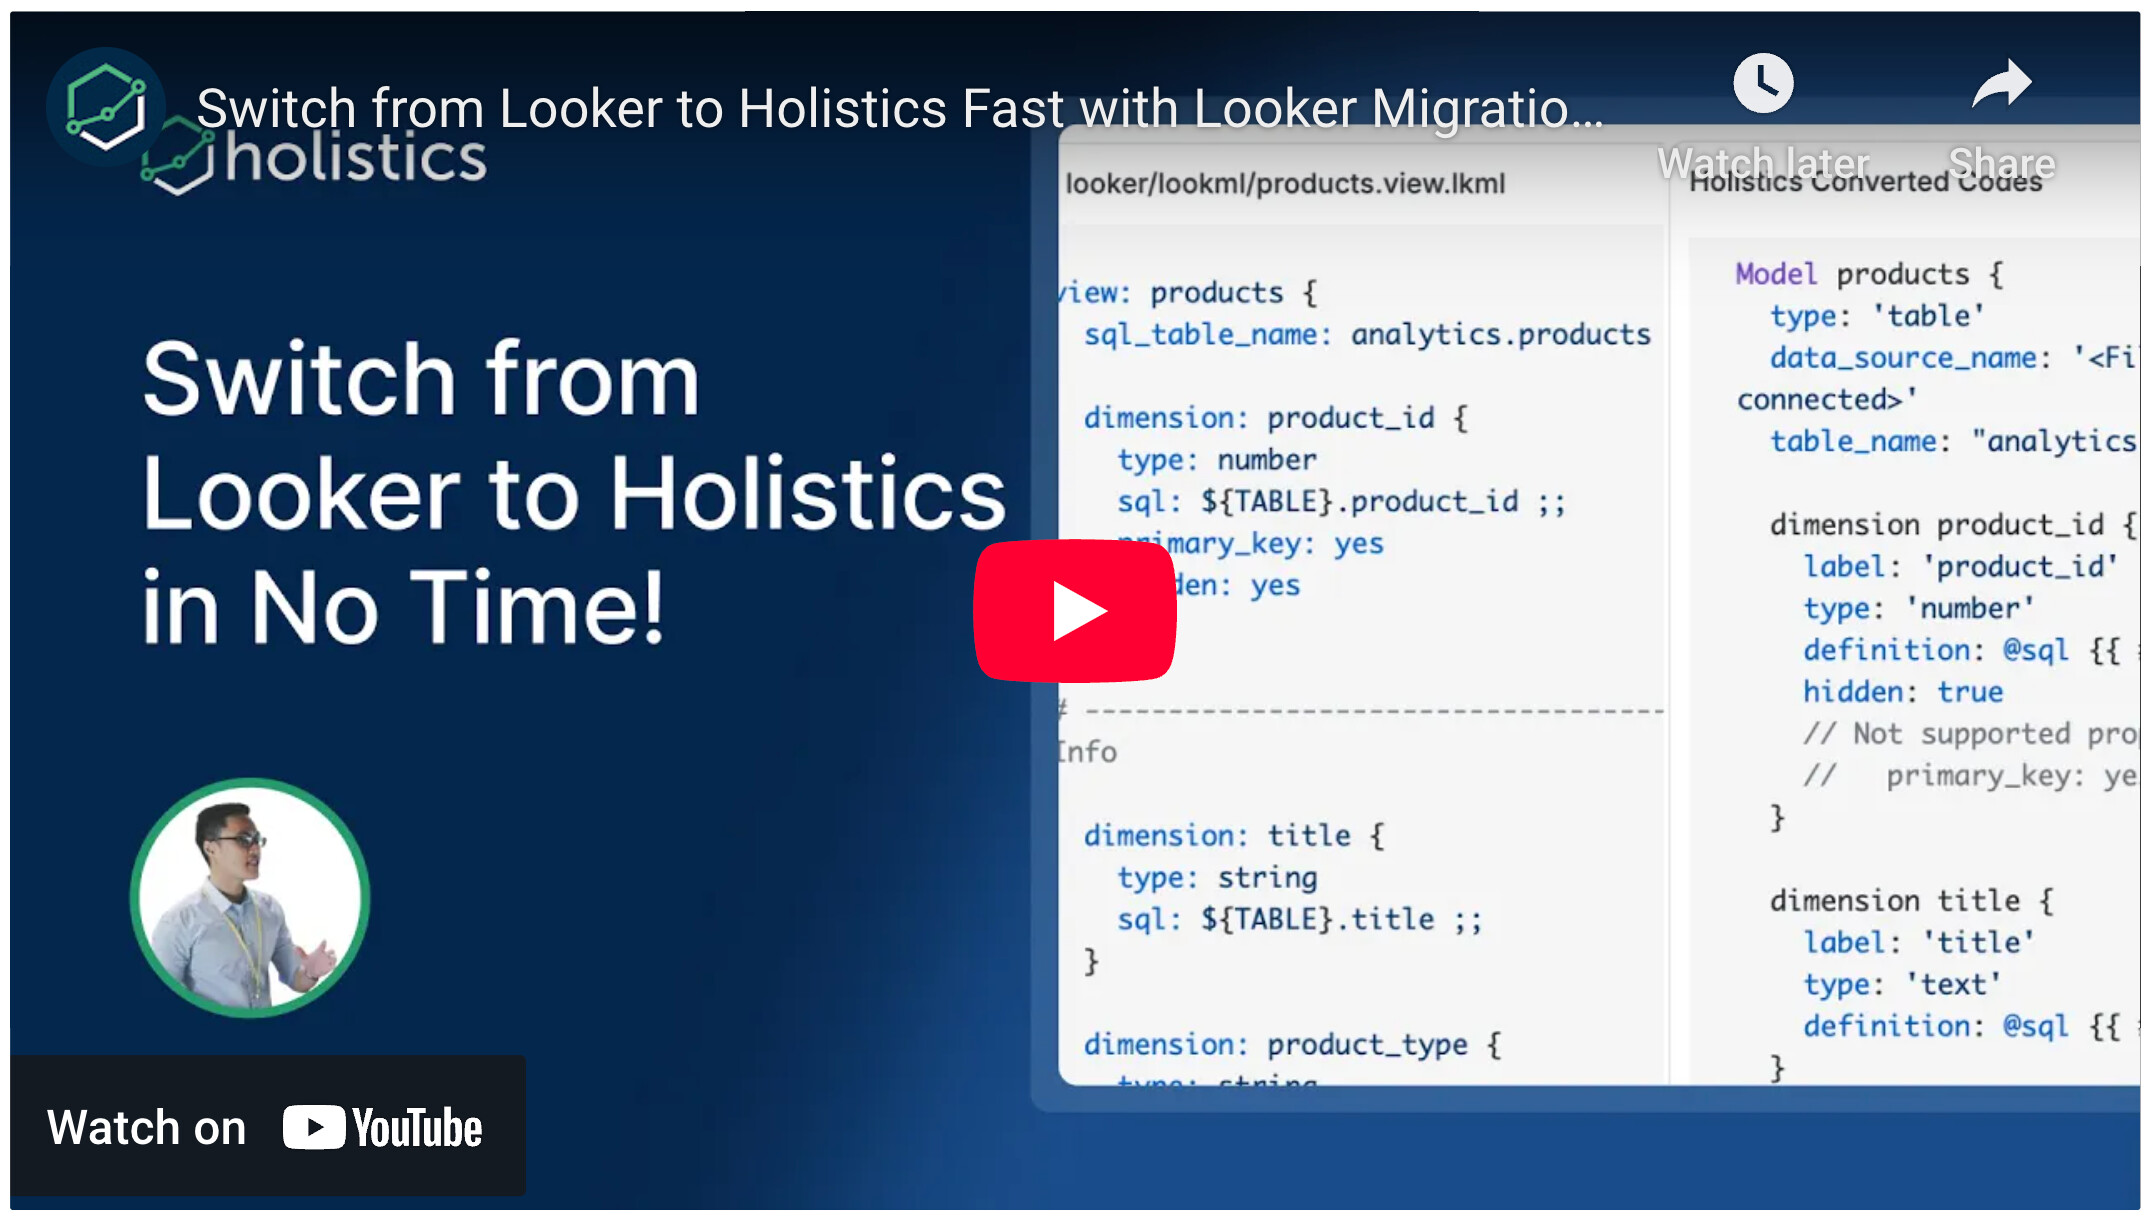
 Switching from Looker to Holistics Got Much Easier! (Coming Soon)
“So Holistics is the cheap Looker knock-off is what you’re telling me here?”
It stung. Someone said this to us during a sales call two years ago. Reality hits you like a train sometimes. You shrug it off. You keep building.
Fast forward to today: “You’re doing the same thing as Looker, and you’re beating all of them on capability,” said another customer who switched platforms.
They might just say that out of politeness, but the market is speaking. We’ve seen teams migrating from Looker to Holistics for better self-service flexibility without sacrificing governance. Just last month, we helped a team transition their entire analytics stack - 50+ dashboards and 140+ models - in only two weeks with five people.
The feedback was stellar, but we kept asking ourselves: how could we make this process even smoother?
This is why we’ve just launched the Looker Migration Tool to help Looker users move their existing setup into Holistics with just a few clicks.
Our migration tool converts your Looker views to Holistics models, including dimensions and measures, so you can hit the ground running with your familiar data structure.
Why you’ll love it:
- Convert LookML to AMQL automatically
- Keep your dimensions, measures, and familiar data structure
- Save hours (or days) of manual work
Coming soon! Already available in our documentation, with the full migration UI launching later this month!
See the full demo here.
 Keep Your Table On-Brand with Table Styling
Another benefit of “defining dashboards as code” is you can create extremely customized themes for your tabular reports.
With our Custom Table Styling, you can style every part of your tables — headers, rows, borders — to match your brand’s look and feel.
Why you’ll love it:
- Align table design with your dashboard themes
- Fine-tune headers, rows, and columns with full control
- Apply global styles or customize specific tables
 Presets for Quick Table Styling
While our Custom Table Styling offers powerful code-level customization for developers, we know not everyone wants to write code to make their tables look great.
That’s why we’re introducing Presets for Quick Table Styling, the fastest way to create professional-looking tables with zero coding required.
Why you’ll love it:
- Pick colors, spacing, and borders in seconds
- Use presets like compact, default, and wide
- Keep your dashboards consistent, no matter your role
 View Underlying Data
Ever seen a spike in your chart and wondered “What’s really going on here?” or "Why does this number look the way it does?"
Our new View Underlying Data feature makes answering these questions easier. With just a click, you can instantly see what makes up any value at its most granular level.
It requires zero setup. You can easily customize your view by adding or removing columns from the underlying table, giving you complete control over your analysis.
 Drill down
Besides View Underlying Data, you now get Drill down to dig deeper to understand what’s driving your numbers.
Drill Down allows users to easily explore a data value across specific dimensions in just a few clicks. It requires zero setups and offers a smart list of suggested dimensions for a smoother analytics experience. Now available to all users.
 Personalize Your Data Alerts with Custom Messages
When your inventory drops below safety levels, would you rather get:
- “Dashboard XYZ updated at 9:00 AM EST”
- or "URGENT: 3 product lines below reorder point. Action needed in next 48 hours to avoid stockout.”
Important business updates shouldn’t hide behind generic alerts. We’ve launched Custom Alert/Schedule to solve this exact problem.
Why you’ll love it:
- Full control over your message for each alert type
- Save time with reusable smart variables ({{metric}}, {{threshold}}, {{trend}})
- Give your team context about what they’re seeing
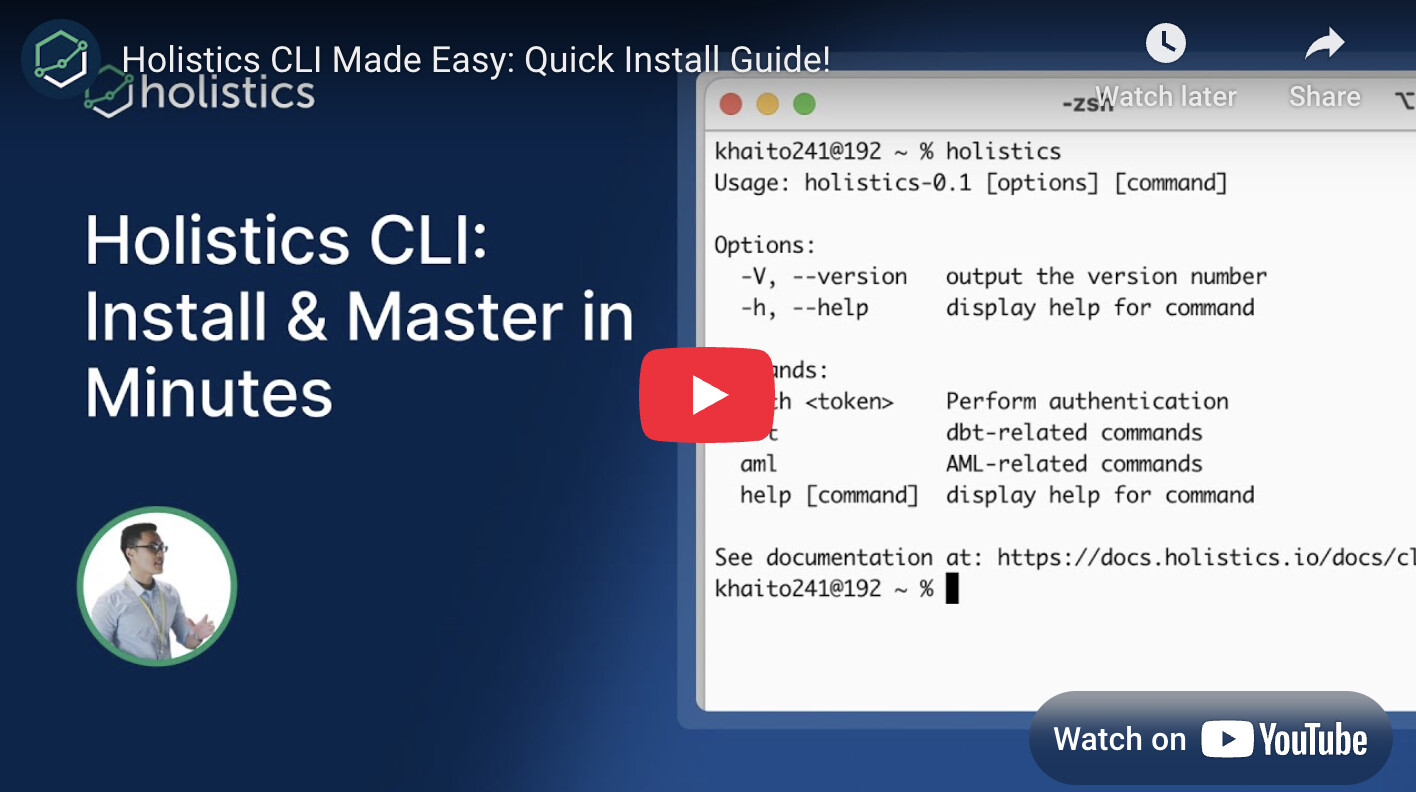
 All-New Holistics CLI: Developer-Friendly & More Powerful!
Jumping between interfaces, waiting for app updates, and manually checking model validity, all just to start your analytics project? I hate it too!
With our new CLI, you can manage your entire Holistics project from your terminal, validate dbt models with confidence, and seamlessly integrate with CI/CD workflows.
Why you’ll love it:
- Validate your dbt models against Holistics objects with confidence
- Analyze dependencies and lineage across your entire project
- Integrate smoothly into your existing CI/CD workflows
For the full demo, check out this video.
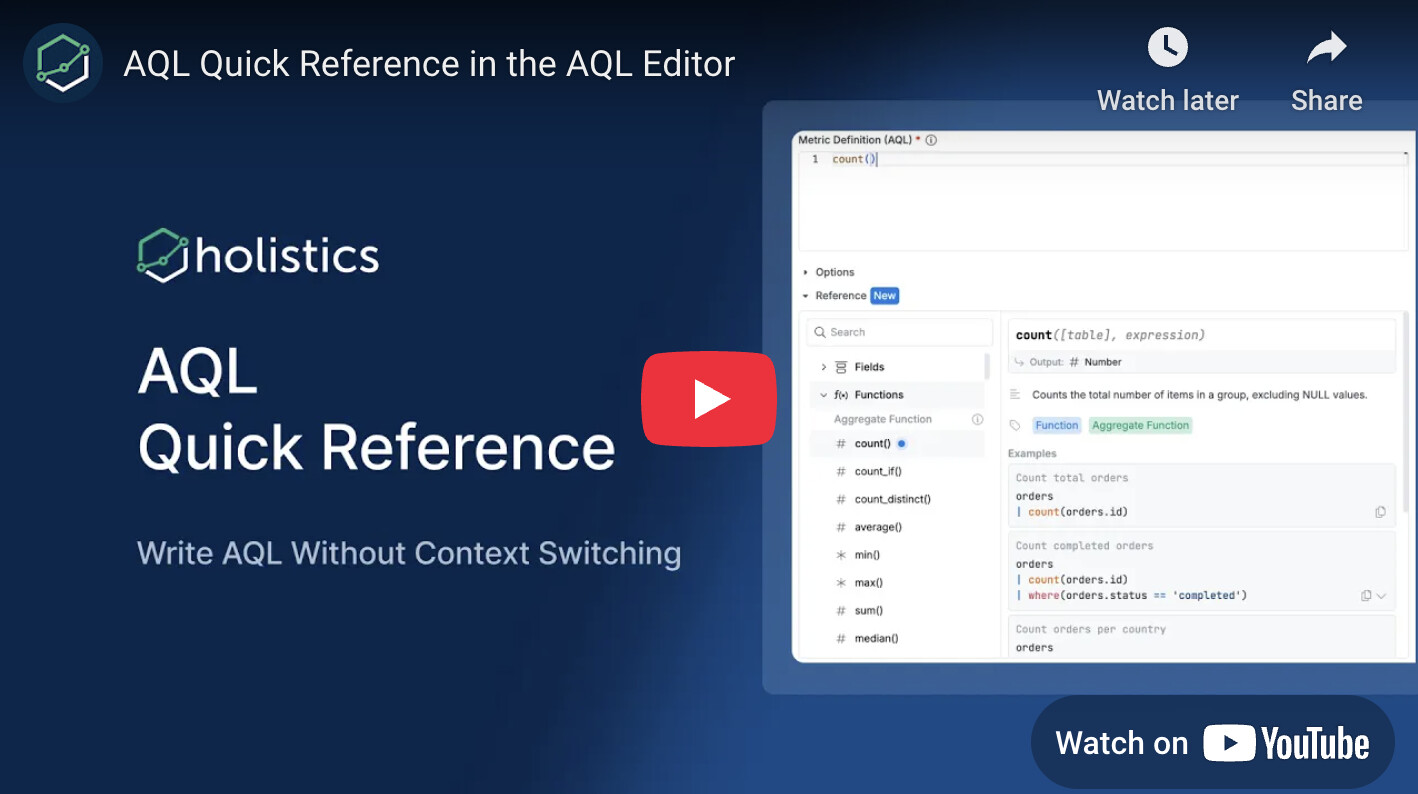
 AQL Quick Reference
You’re writing AQL, mid-flow… and then it happens.“Wait, what was that function again?”
We’ve been there. AQL is powerful, but it comes with a learning curve. So we built AQL Quick Reference: a built-in, searchable guide that lives right inside the AQL Editor.
Instead of jumping between tabs or digging through docs, you can:
- Look up any AQL function, operator, or concept in seconds
- Get the right syntax exactly when you need it
- Stay focused and in the zone, without breaking your rhythm
It’s simple, it’s fast, and it’s already live in your editor.
For the full demo, check out this video.
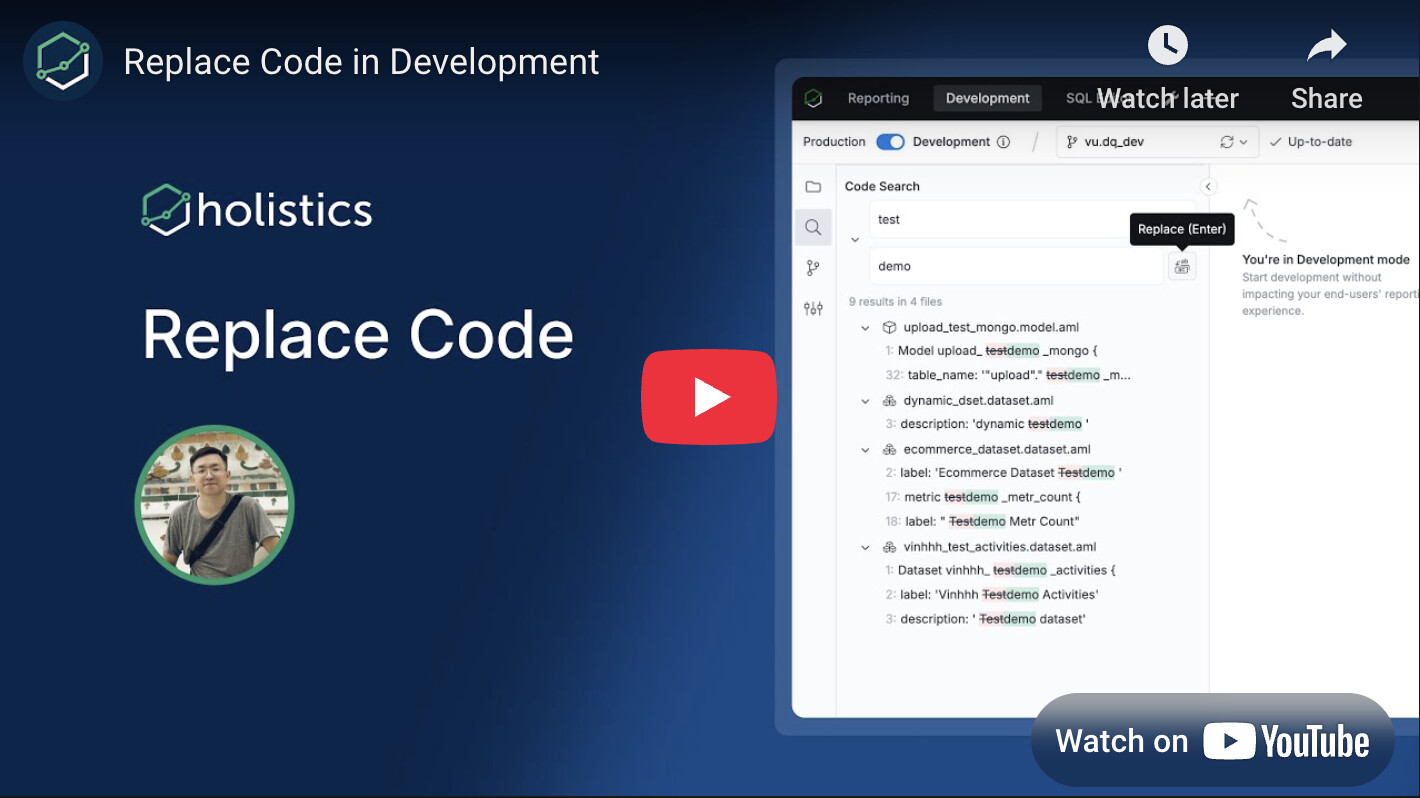
 Search and Replace Across your Codebase! (Coming Soon)
Making changes across your workspace shouldn’t mean tracking down every reference by hand. It’s time-consuming, easy to miss, and just… not fun. So we’re adding a Replace feature, an upgrade to Code Search that helps you make updates faster and with confidence.
You will soon be able to:
- Find and replace references to metrics, models, or data sources in one go
- Skip the manual search. No more digging through files
- Preview your changes before applying them
Coming soon! Our basic Code Search is already available in beta, with replace functionality and enhanced filtering options on the way!
See the full demo here.
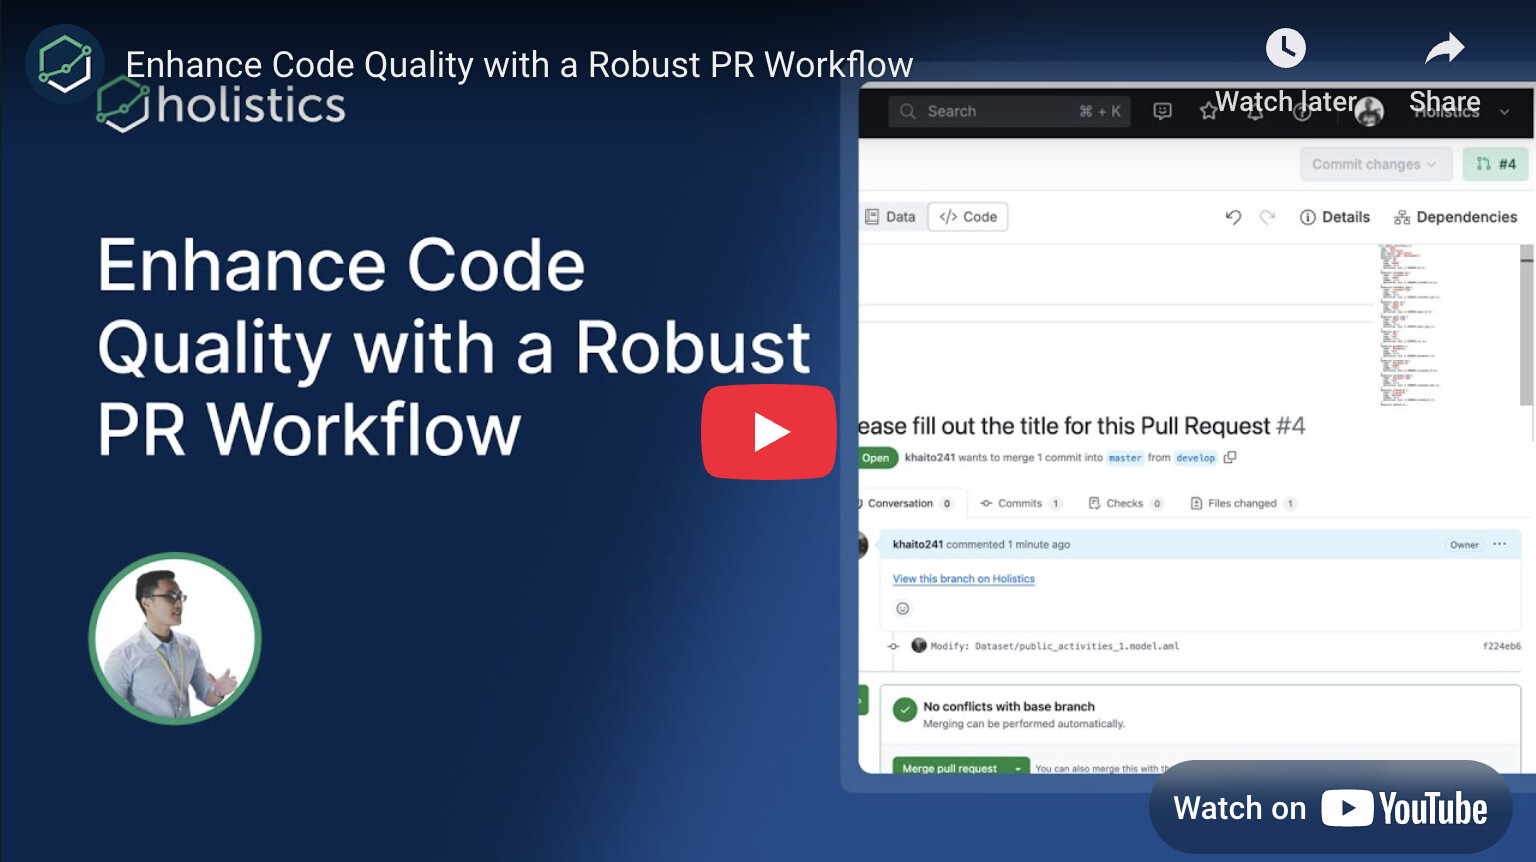
 Improved PR Workflow (Coming Soon)
Here’s a valid crashout: You’ve spent hours building the perfect dashboard, only to have users report strange behaviors hours later. That sinking feeling when you realize someone made unauthorized changes to your production dashboards is enough to make anyone lose it.
To help teams avoid this mess, we’re introducing Pull Request (PR) Workflow, a simple CI/CD system that enables admins and dashboard owners to review changes before they go live, with automatic publishing once approved.
Why you’ll love it:
- Keep your production dashboards protected with mandatory reviews
- Maintain control with admin and dashboard owner approval gates
- Automatically publishes when PRs are merged
See the full demo here.
Coming soon with GitHub integration first, followed by GitLab and BitBucket support!
 Excited about the new features? Join our Free Training
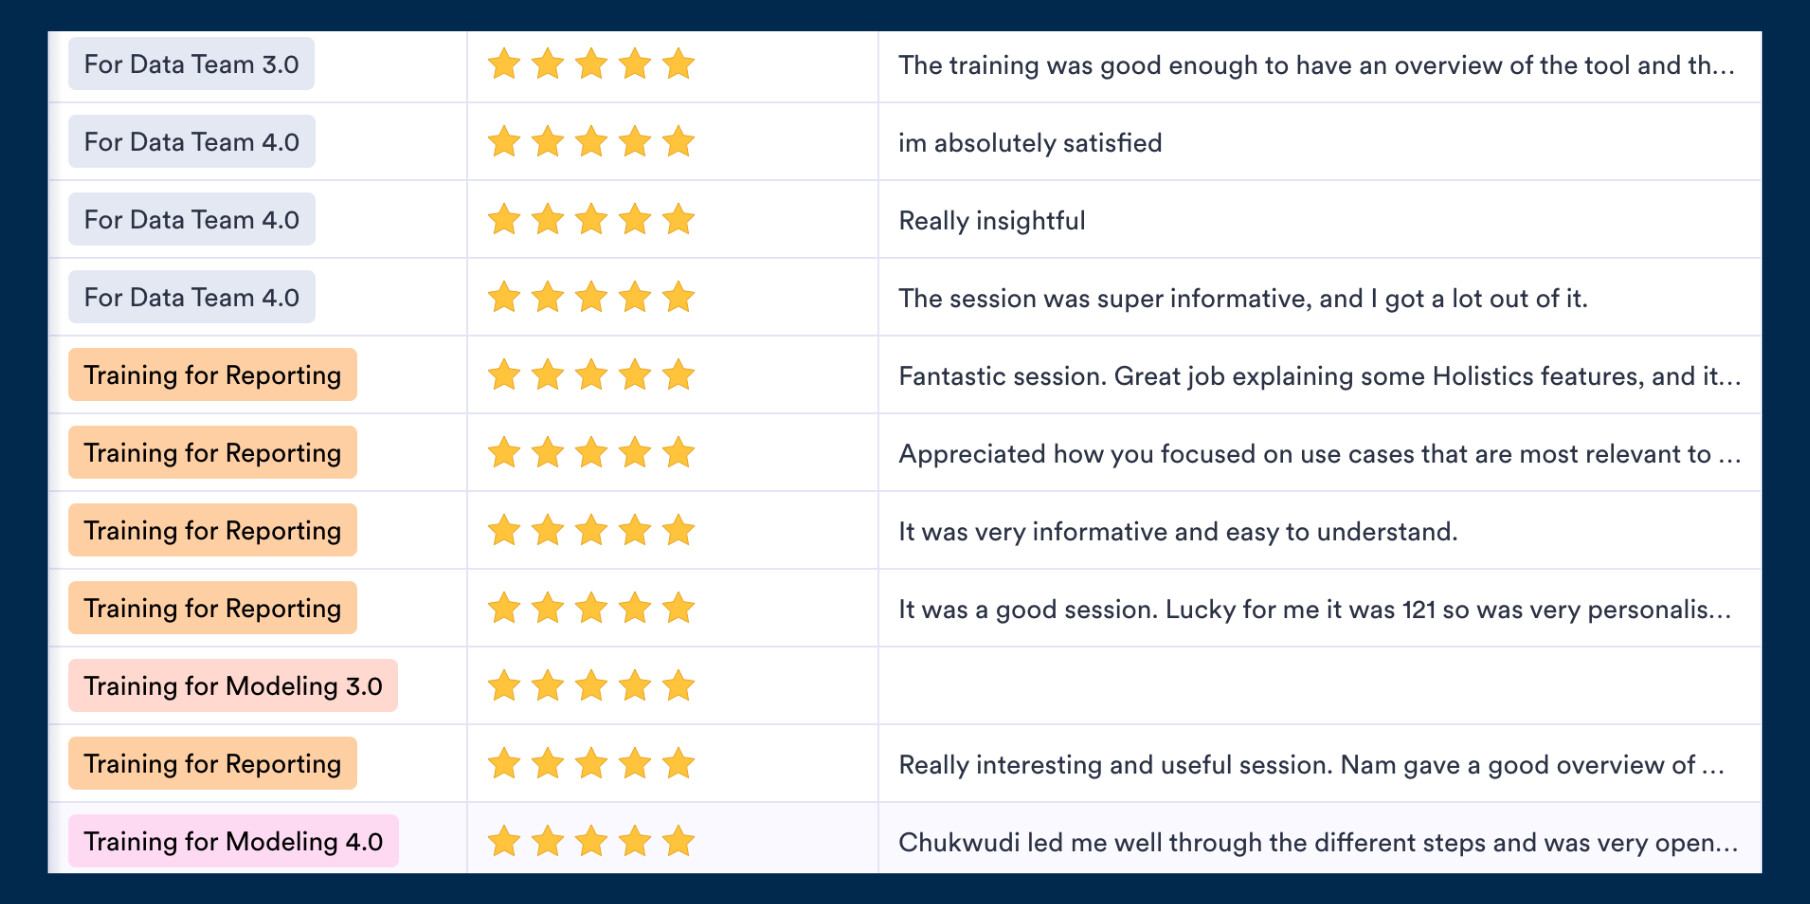
We offer 60-minute live training sessions designed to help you get the best out of Holistics. With multiple time slots available, there’s a session that fits your schedule, no matter your time zone. And it’s completely free of charge.
Interested? Find a slot here.
Not intrigued? Here’s what the audience has been saying! ![]()
April UX Updates
Here’s a quick look at the highlights from our latest UX update. There are A LOT of them, so make sure to check out our Community post here for more details.
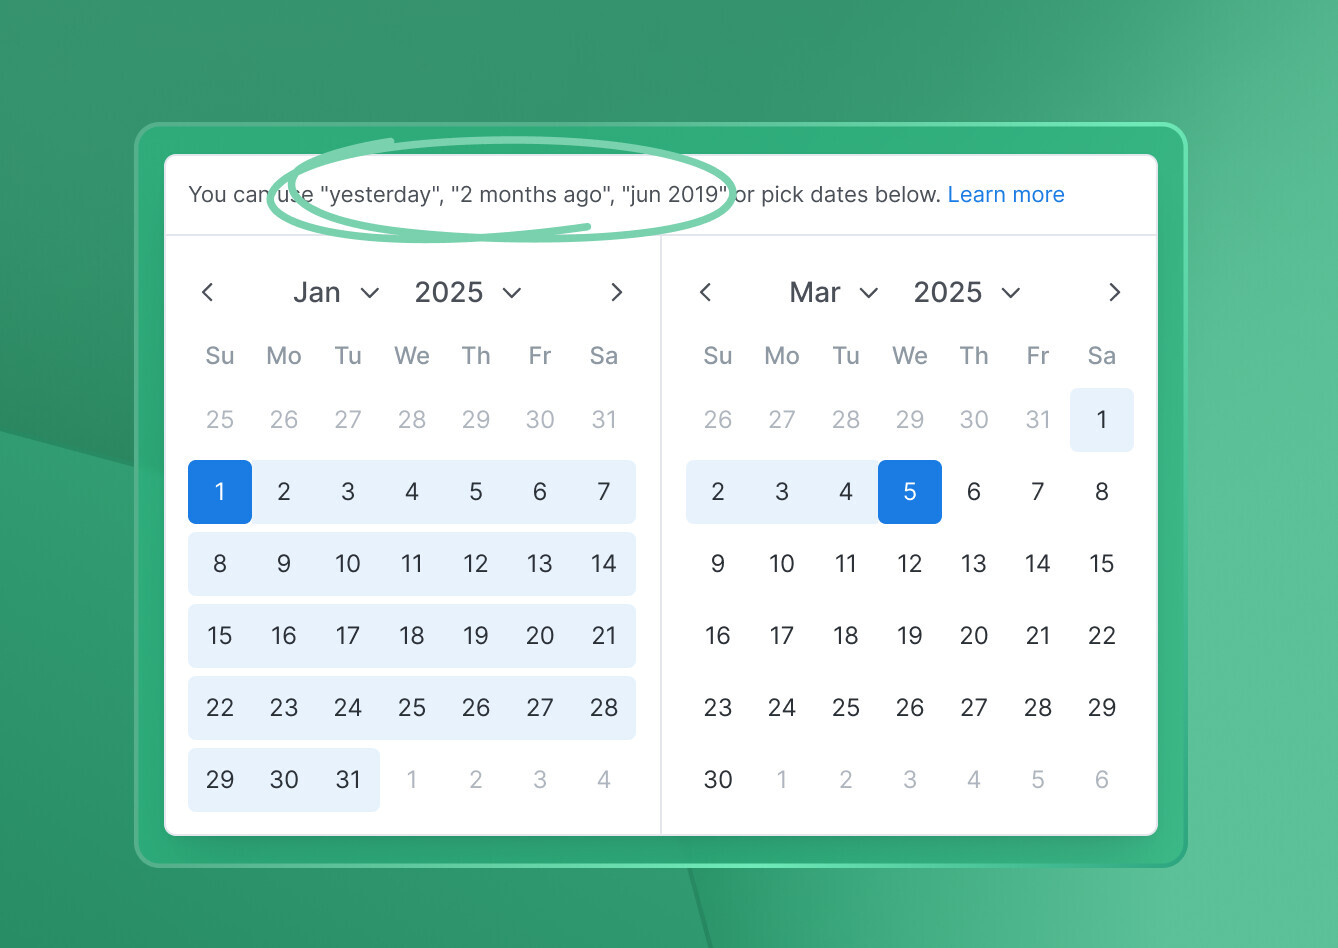
1. Date picker: I added a link to our NLP (Natural Language Processing) syntax docs to help you utilize our matches date filter more easily. You can type “yesterday”, or “2 months” ago in our Date filter with a “matches” operator to quickly select the date.
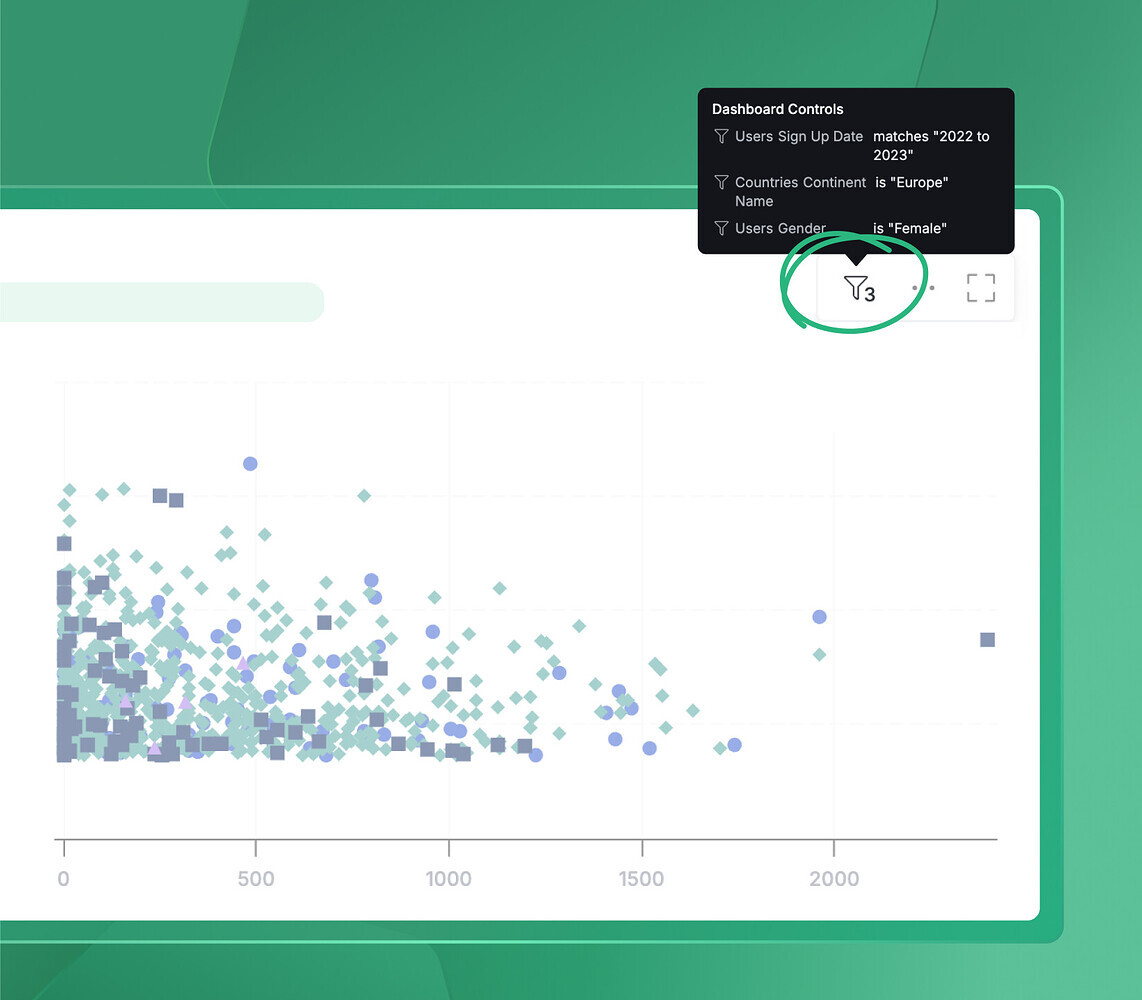
2. Widget’s filter indicator: We added a number indicating applied filters on the filter icon in each widget.
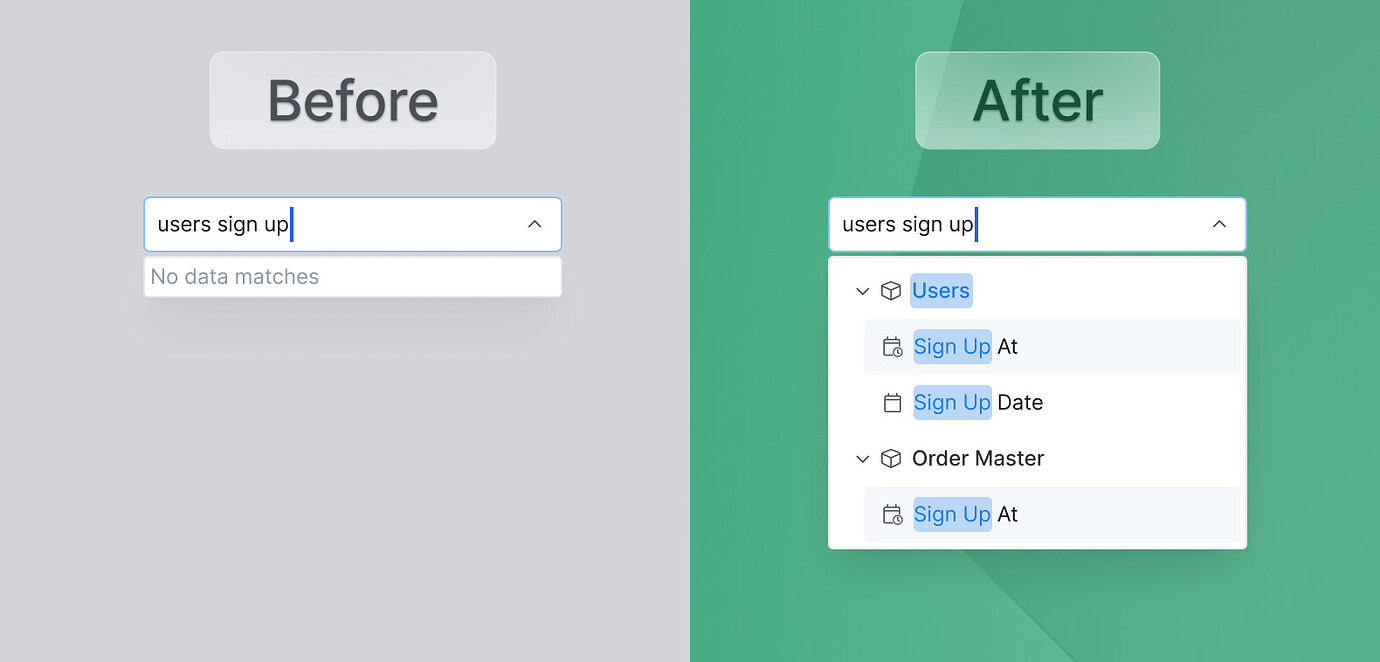
3. Coming soon: Big improvement in our field search: you can now search for both model name & field name easily. Previously, you could only search for one at a time (a hassle - we understand!)
Final words
That’s all for this month. If you’re curious about our upcoming direction, check out our Product Roadmap. If you’re interested in what we just released in the past few months, check out our Release Note.
Do you have any feedback for us? If you do, hit Reply and let me know. Or connect with me on LinkedIn and we can chat.
I’ll see you again real soon!