Hello Everyone ::
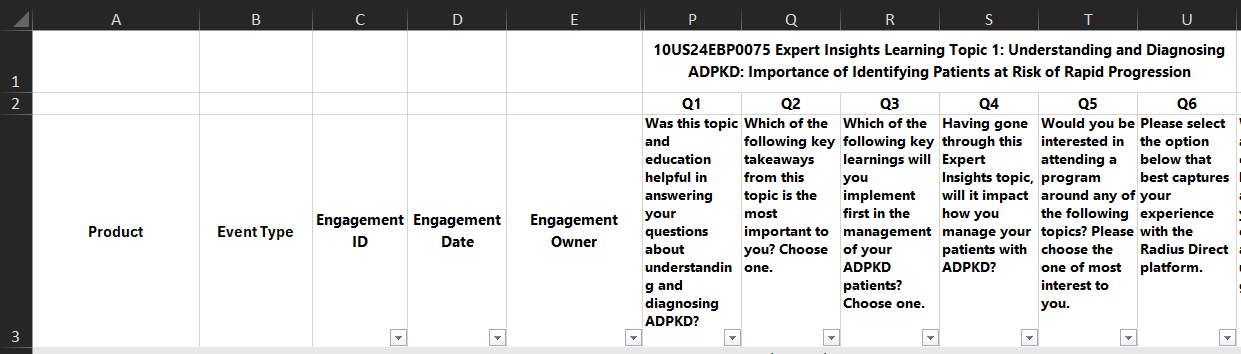
I’m trying to pull the report as a table but in a different structure of the headers like the image below. Is there any way to pull a report using this structure of headers
After these 3 rows of headers we pull the data.
Thanks
Hamza
Hi @Hamza_rashed,
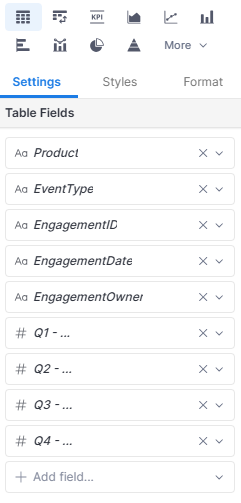
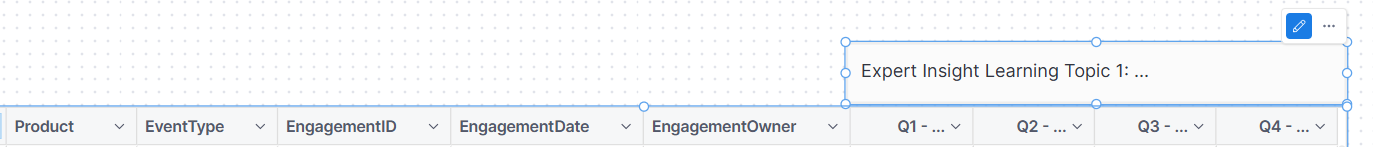
The Data Table in Holistics isn’t fully optimized for this display type. However, you can achieve a similar result by adding a table field for each column and using the Text block in Canvas Dashboard to denote a column group.
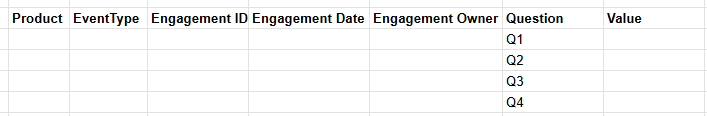
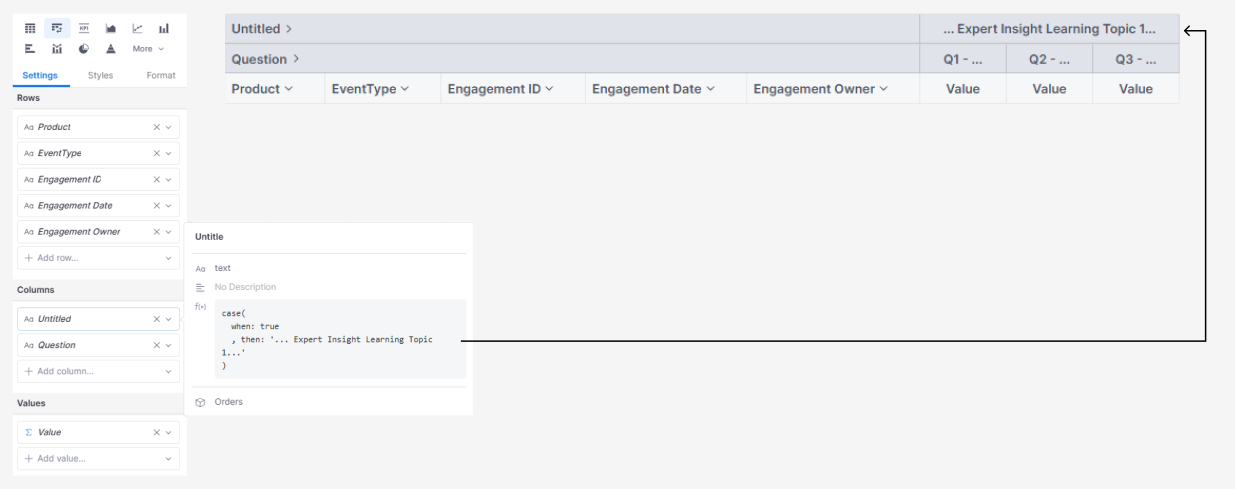
Alternatively, if your data is currently modelled in unpivot form similar to this:
Then you can use Pivot Table to achieve your desired result:
Notice that I added a custom dimension to create a grouped header
Hope this helps!