Hi Hamza Rashed,
Thank you for providing your detailed use case. I completely understand the frustration here.
To confirm our understanding of your workflow:
- The goal: You want an Excel export that includes the native pivot engine so your team can interactively generate multiple views from a single table using native Excel filters and options.
- The current behavior: Holistics exports final aggregated results to guarantee your data stays consistent with your browser reports. Since these are snapshots, you are currently pre-creating 17 separate tables, resulting in a fragmented 17-tab file.
While Holistics doesn’t natively support exporting the pivot engine, we have an approach to help you merge multiple views into a single tab.
Consolidate multi-tab Excel exports using Gmail and Google Apps Script
High-level approach
This guide walks you through creating a simple automation that intercepts your scheduled Holistics Excel files in Gmail and merges their multiple tabs into a single, scannable sheet. The setup involves two main steps:
- Set up Holistics email schedules: Have your multi-tab report delivered to your inbox.
- Automate consolidation with Google Apps Script: Use a script to grab the file, restack the tables, and forward a clean version to your team.
Disclaimer: This guide uses Gmail and Google Apps Script. If you use Outlook, Exchange, or other providers, you can achieve similar results with IMAP scripts or automation tools (e.g., Microsoft Power Automate).
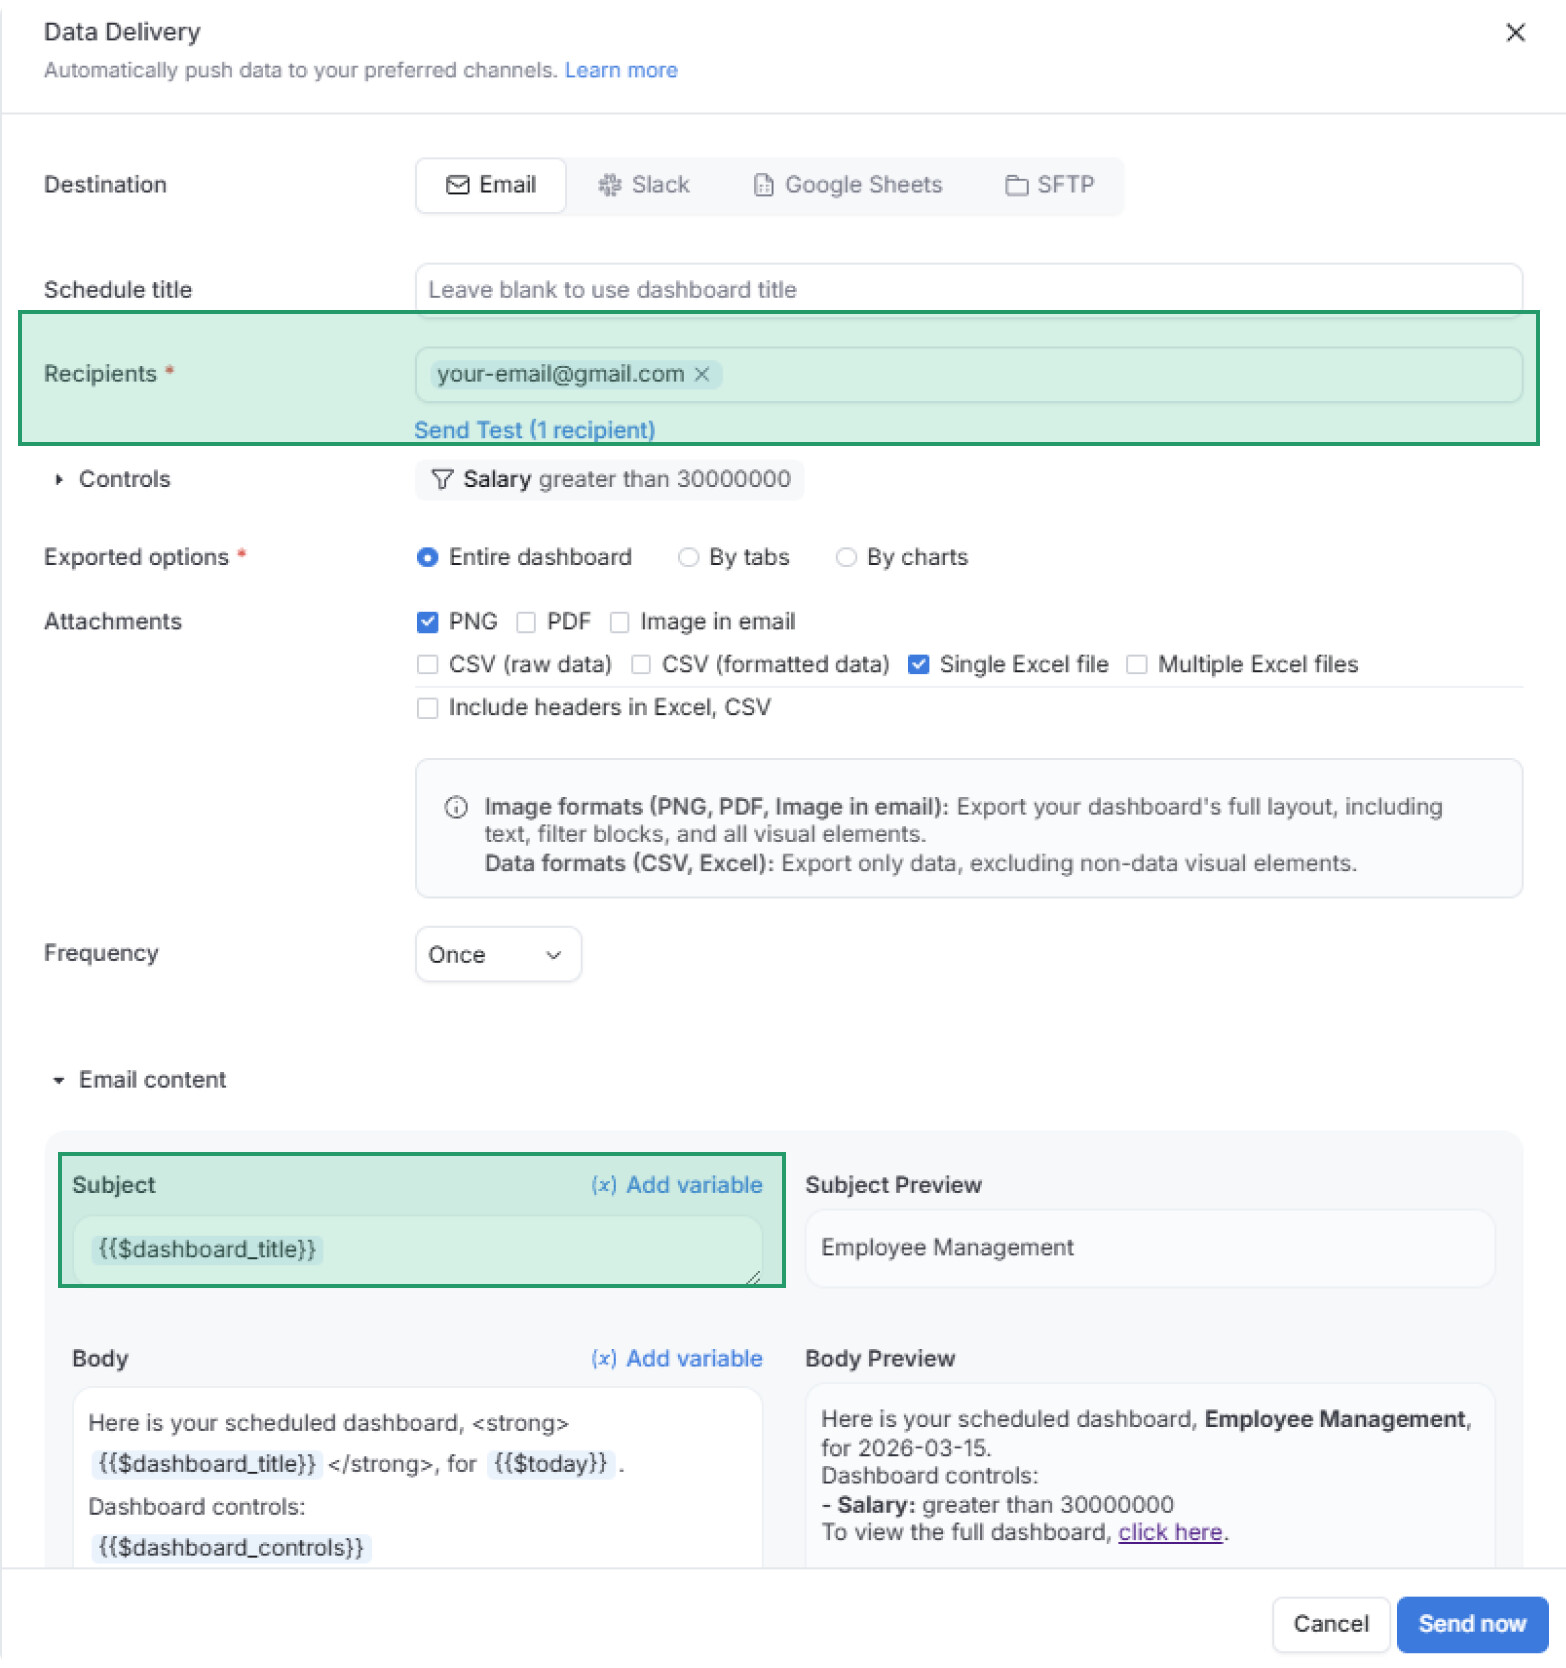
Step 1: Set up Holistics email schedules
Create an email schedule for your Holistics dashboard or report:
- Recipients: Enter the Gmail that you’d use to set up the Google App Script (not your client’s email).
- Subject: You will need this for the script to “find” the right email in your inbox.
Step 2: Automate consolidation with Google Apps Script
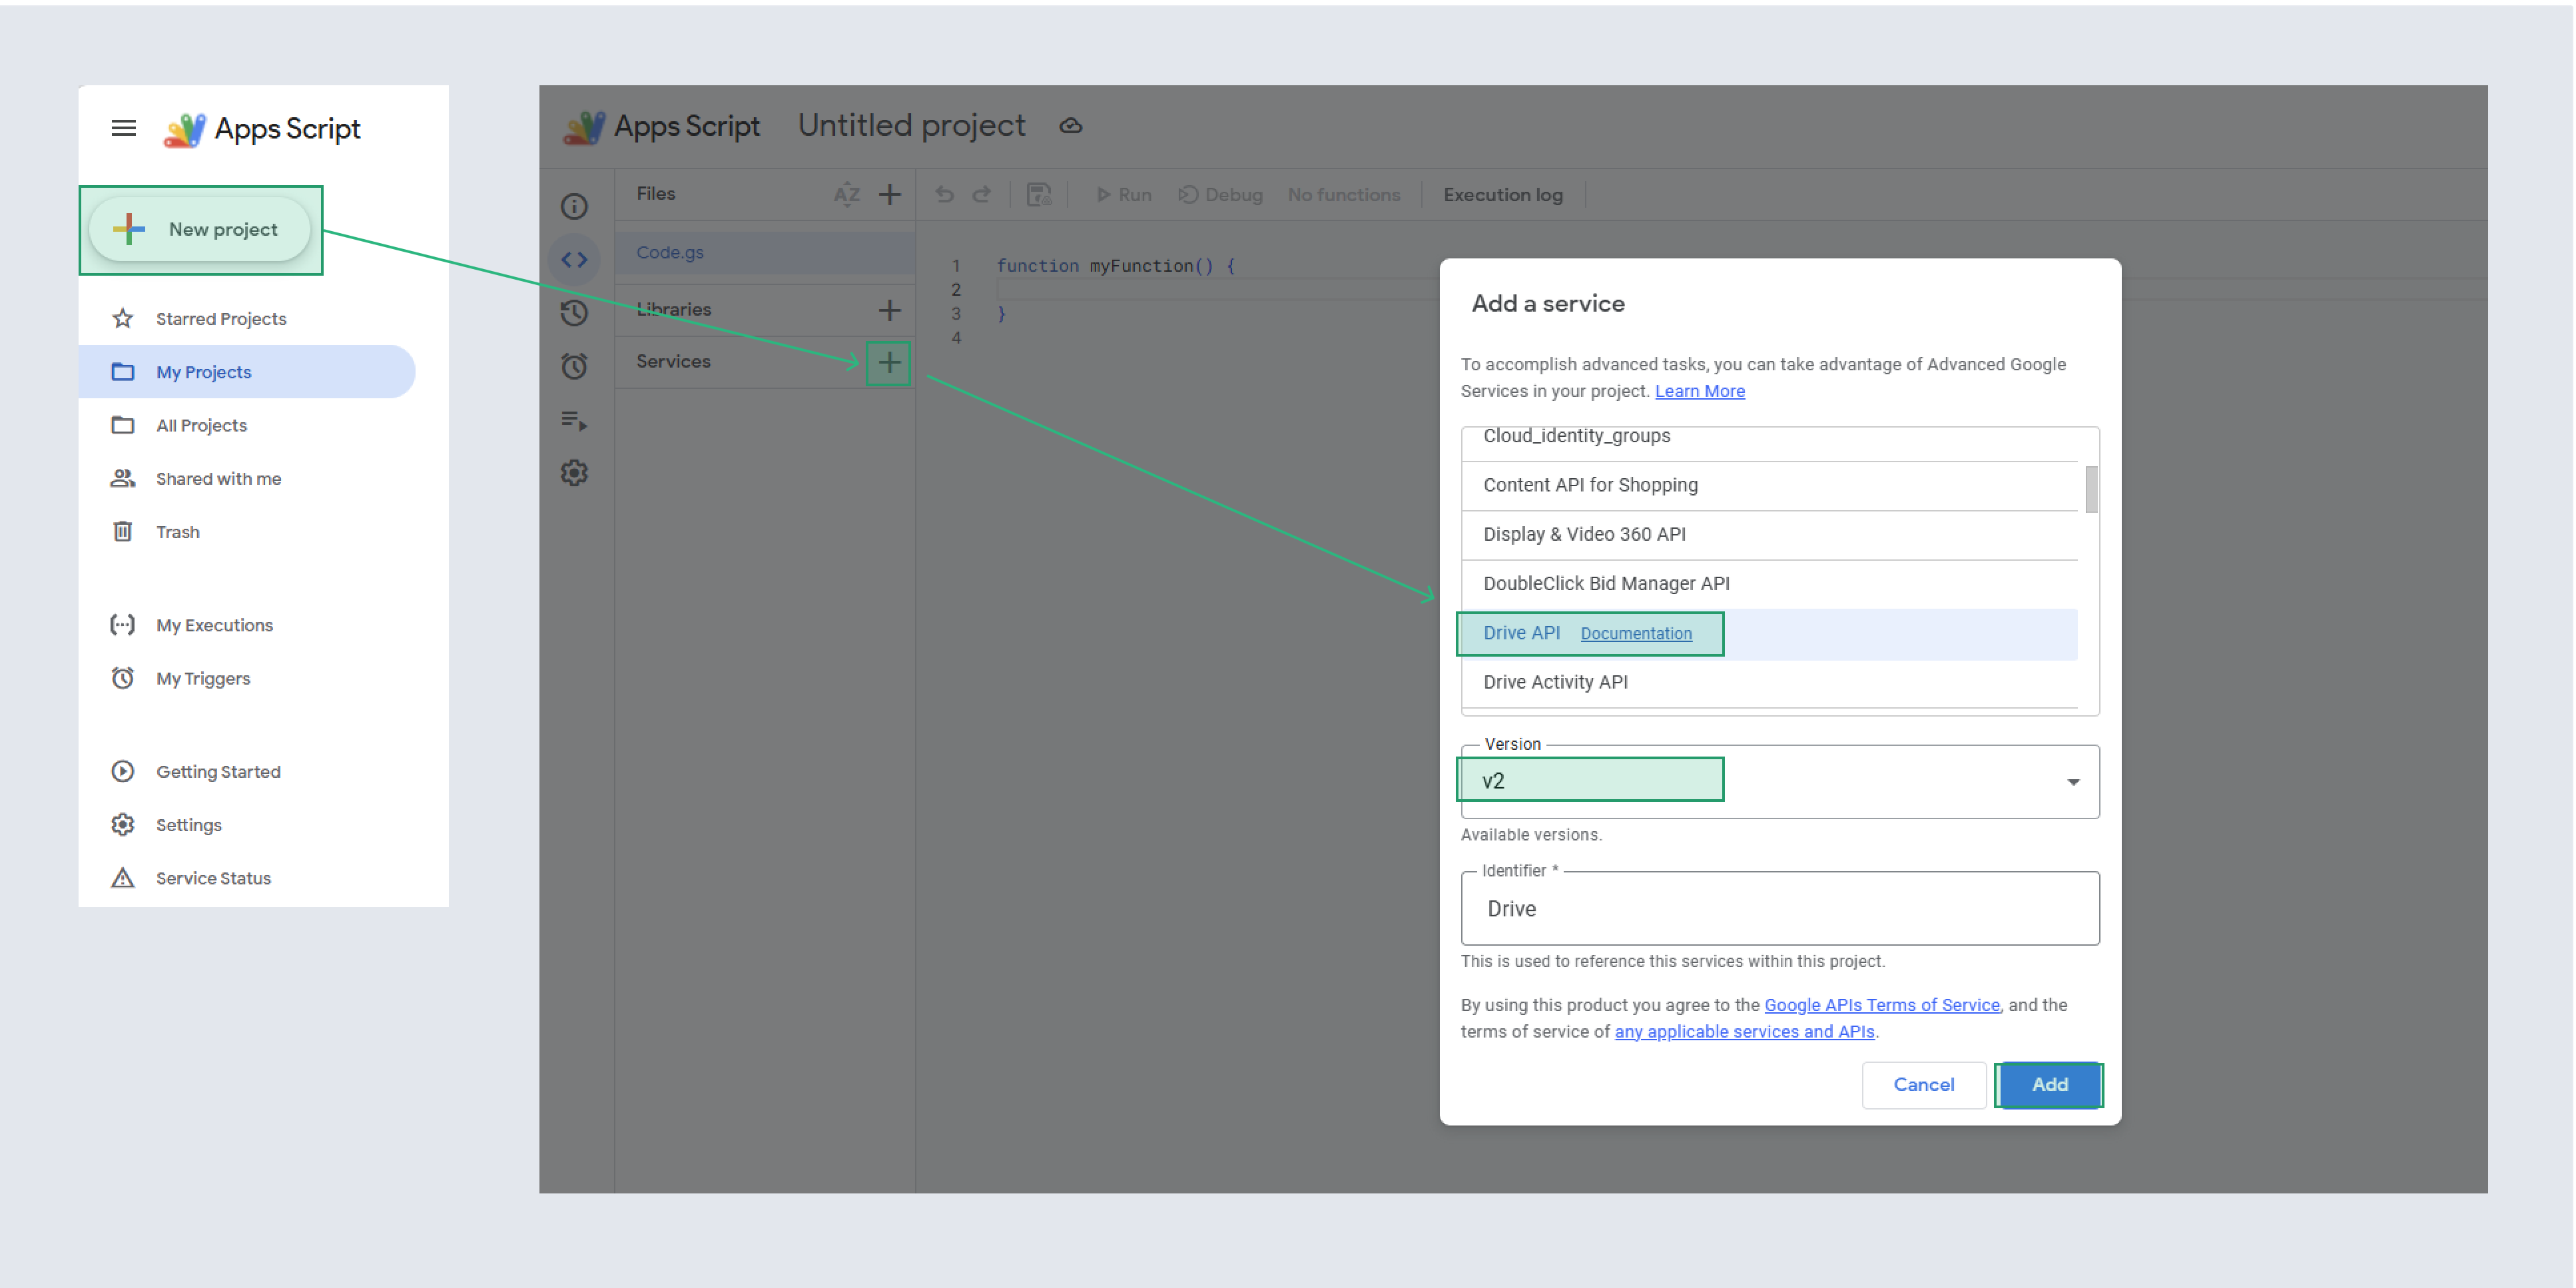
2.1. Create a new project
- Go to Google Apps Script, create a new project.
- Click the [+] next to Services on the left sidebar, find Drive API (v2), and add it.
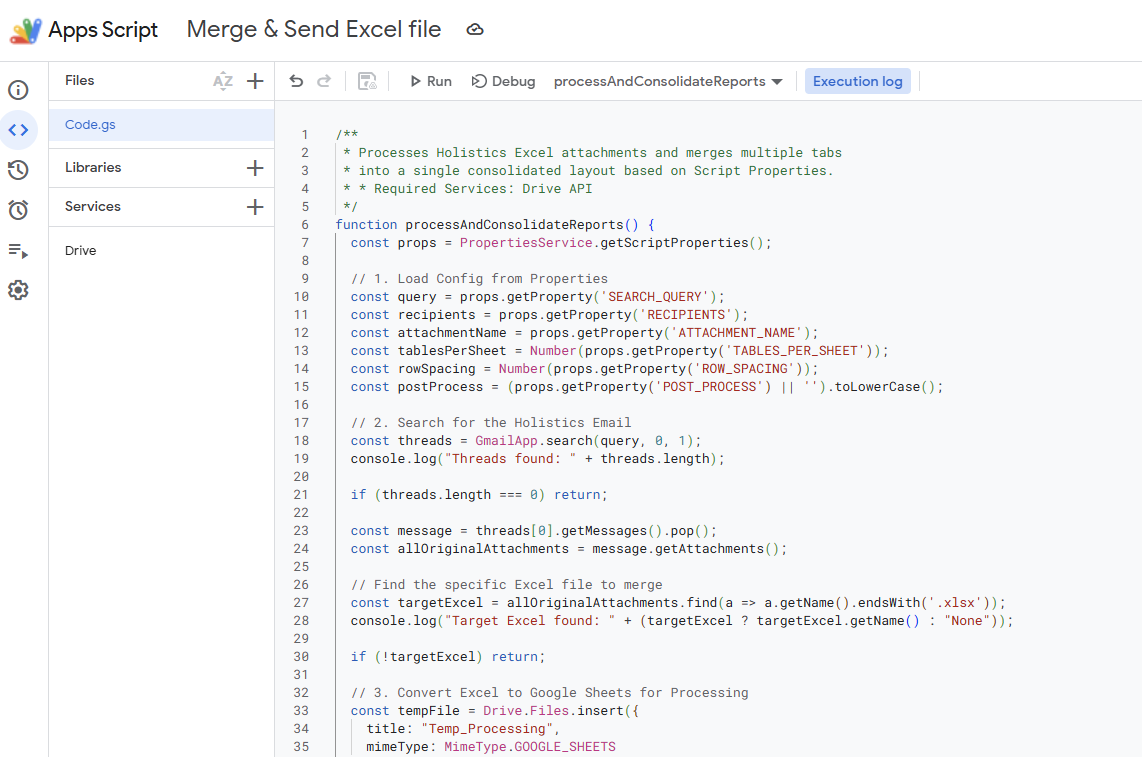
2.2. Set up the script
Paste the script below into the Code editor
/**
 * Processes Holistics Excel attachments and merges multiple tabs
 * into a single consolidated layout based on Script Properties.
 * * Required Services: Drive API
 */
function processAndConsolidateReports() {
  const props = PropertiesService.getScriptProperties();

  // 1. Load Config from Existing Properties
  const query = props.getProperty('SEARCH_QUERY');
  const recipients = props.getProperty('RECIPIENTS');
  const attachmentName = props.getProperty('ATTACHMENT_NAME');
  const tablesPerSheet = Number(props.getProperty('TABLES_PER_SHEET'));
  const rowSpacing = Number(props.getProperty('ROW_SPACING'));
  const postProcess = (props.getProperty('POST_PROCESS') || '').toLowerCase();

  // 2. Search for the Holistics Email
  const threads = GmailApp.search(query, 0, 10);
  console.log("Threads found: " + threads.length);

  if (threads.length === 0) return;

  // Process all threads found by the query
  threads.forEach(thread => {
    const messages = thread.getMessages();
    const message = messages[messages.length - 1]; // Get the most recent message

    const allOriginalAttachments = message.getAttachments();
    const targetExcel = allOriginalAttachments.find(a => a.getName().endsWith('.xlsx'));

    if (!targetExcel) {
      console.log("No Excel found in thread: " + message.getSubject());
      return;
    }

    // 3. Convert Excel to Google Sheets
    const tempFile = Drive.Files.insert({
      title: "Temp_" + message.getId(),
      mimeType: MimeType.GOOGLE_SHEETS
    }, targetExcel);

    const ss = SpreadsheetApp.openById(tempFile.id);
    const sourceSheets = ss.getSheets();
    const finalSs = SpreadsheetApp.create("Merged_" + message.getId());

    // 4. Merge Logic
    for (let i = 0; i < Math.ceil(sourceSheets.length / tablesPerSheet); i++) {
      let masterSheet = finalSs.insertSheet("Report Group " + (i + 1));
      for (let j = 0; j < tablesPerSheet; j++) {
        let sourceIdx = (i * tablesPerSheet) + j;
        if (sourceIdx < sourceSheets.length) {
          let sourceData = sourceSheets[sourceIdx].getDataRange().getValues();
          let destRow = masterSheet.getLastRow() === 0 ? 1 : masterSheet.getLastRow() + rowSpacing;
          masterSheet.getRange(destRow, 1, sourceData.length, sourceData[0].length).setValues(sourceData);
        }
      }
    }

    if (finalSs.getSheetByName("Sheet1")) finalSs.deleteSheet(finalSs.getSheetByName("Sheet1"));

    // 5. Convert & Send
    const url = `https://docs.google.com/spreadsheets/d/${finalSs.getId()}/export?format=xlsx`;
    const token = ScriptApp.getOAuthToken();
    const response = UrlFetchApp.fetch(url, { headers: { Authorization: "Bearer " + token } });
    const mergedBlob = response.getBlob().setName(attachmentName);

    const cleanRecipients = recipients.replace(/[\[\]"]/g, '');
    const otherAttachments = allOriginalAttachments.filter(a => a.getName() !== targetExcel.getName());
    const finalAttachmentList = [mergedBlob, ...otherAttachments];

    GmailApp.sendEmail(cleanRecipients, message.getSubject(), message.getPlainBody(), {
      htmlBody: message.getBody(),
      attachments: finalAttachmentList
    });

    // 6. Post-Process (This is what prevents duplicates)
    if (postProcess === 'mark_read') thread.markRead();
    if (postProcess === 'archive') thread.moveToArchive();

    // 7. Cleanup Drive
    DriveApp.getFileById(tempFile.id).setTrashed(true);
    DriveApp.getFileById(finalSs.getId()).setTrashed(true);

    console.log("Successfully processed: " + message.getSubject());
  });
}
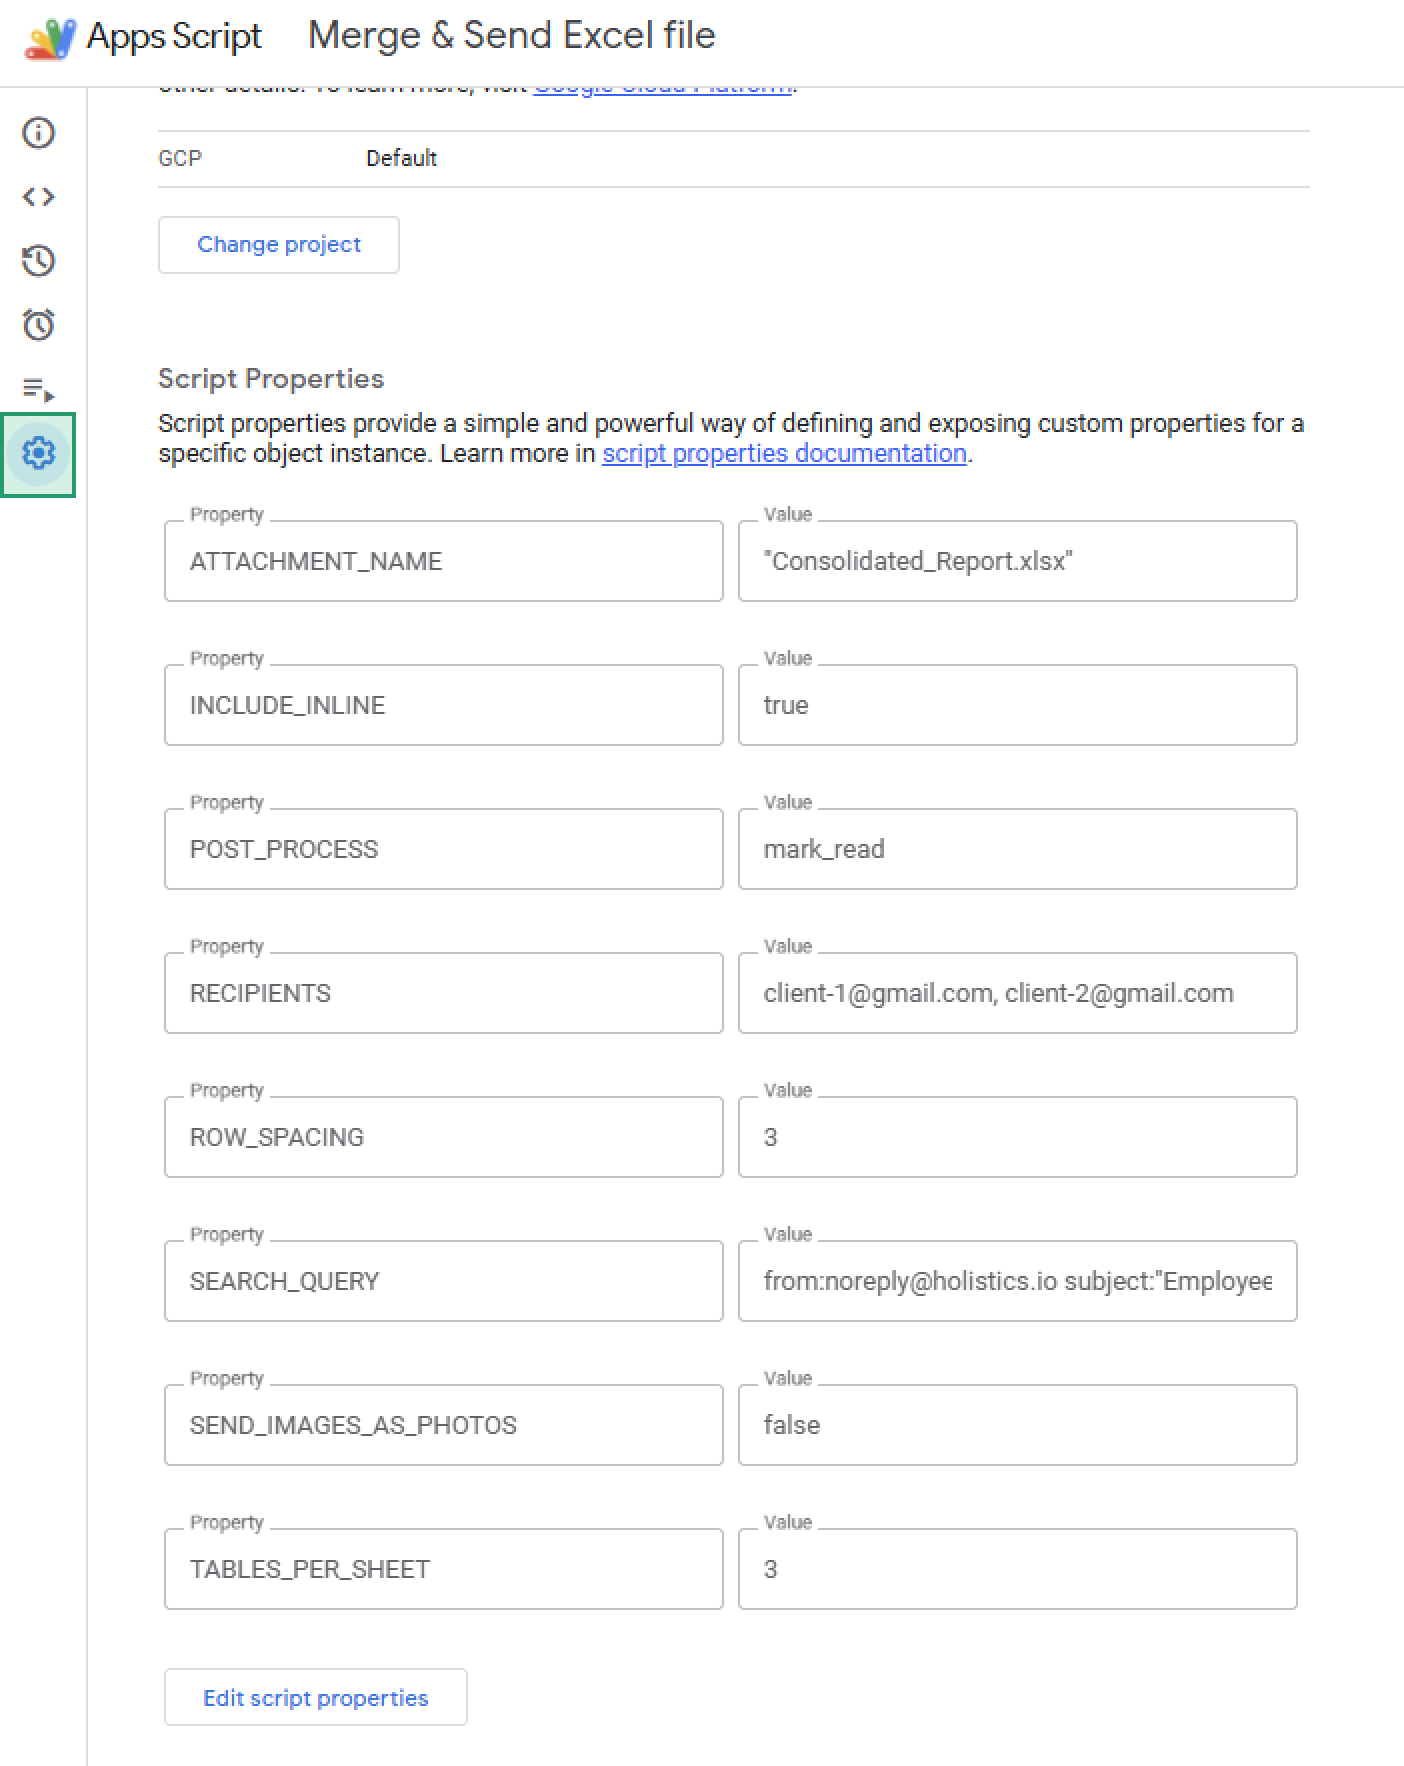
2.3. Configure script properties
Use Script Properties for configuration. In Apps Script → click Project Settings → Script properties → Open editor. Add the following key–value pairs:
| Property Key |
Example Value |
Notes |
SEARCH_QUERY |
is:unread from:[email protected] subject:"Sales Dashboard" |
Target query to find the specific report in your inbox. |
RECIPIENTS |
[email protected], [email protected] |
Comma-separated list of emails to receive the final report. |
SEND_IMAGES_AS_PHOTOS |
true |
Sends images via sendPhoto |
INCLUDE_INLINE |
false |
Whether to forward inline images. |
ATTACHMENT_NAME |
Merged_Sales_Report.xlsx |
The name of the final consolidated Excel file. |
TABLES_PER_SHEET |
3 |
How many original tabs to stack vertically per new worksheet. |
ROW_SPACING |
3 |
The number of empty rows to insert between stacked tables. |
POST_PROCESS |
archive |
Action to take after success: mark_read or archive. |
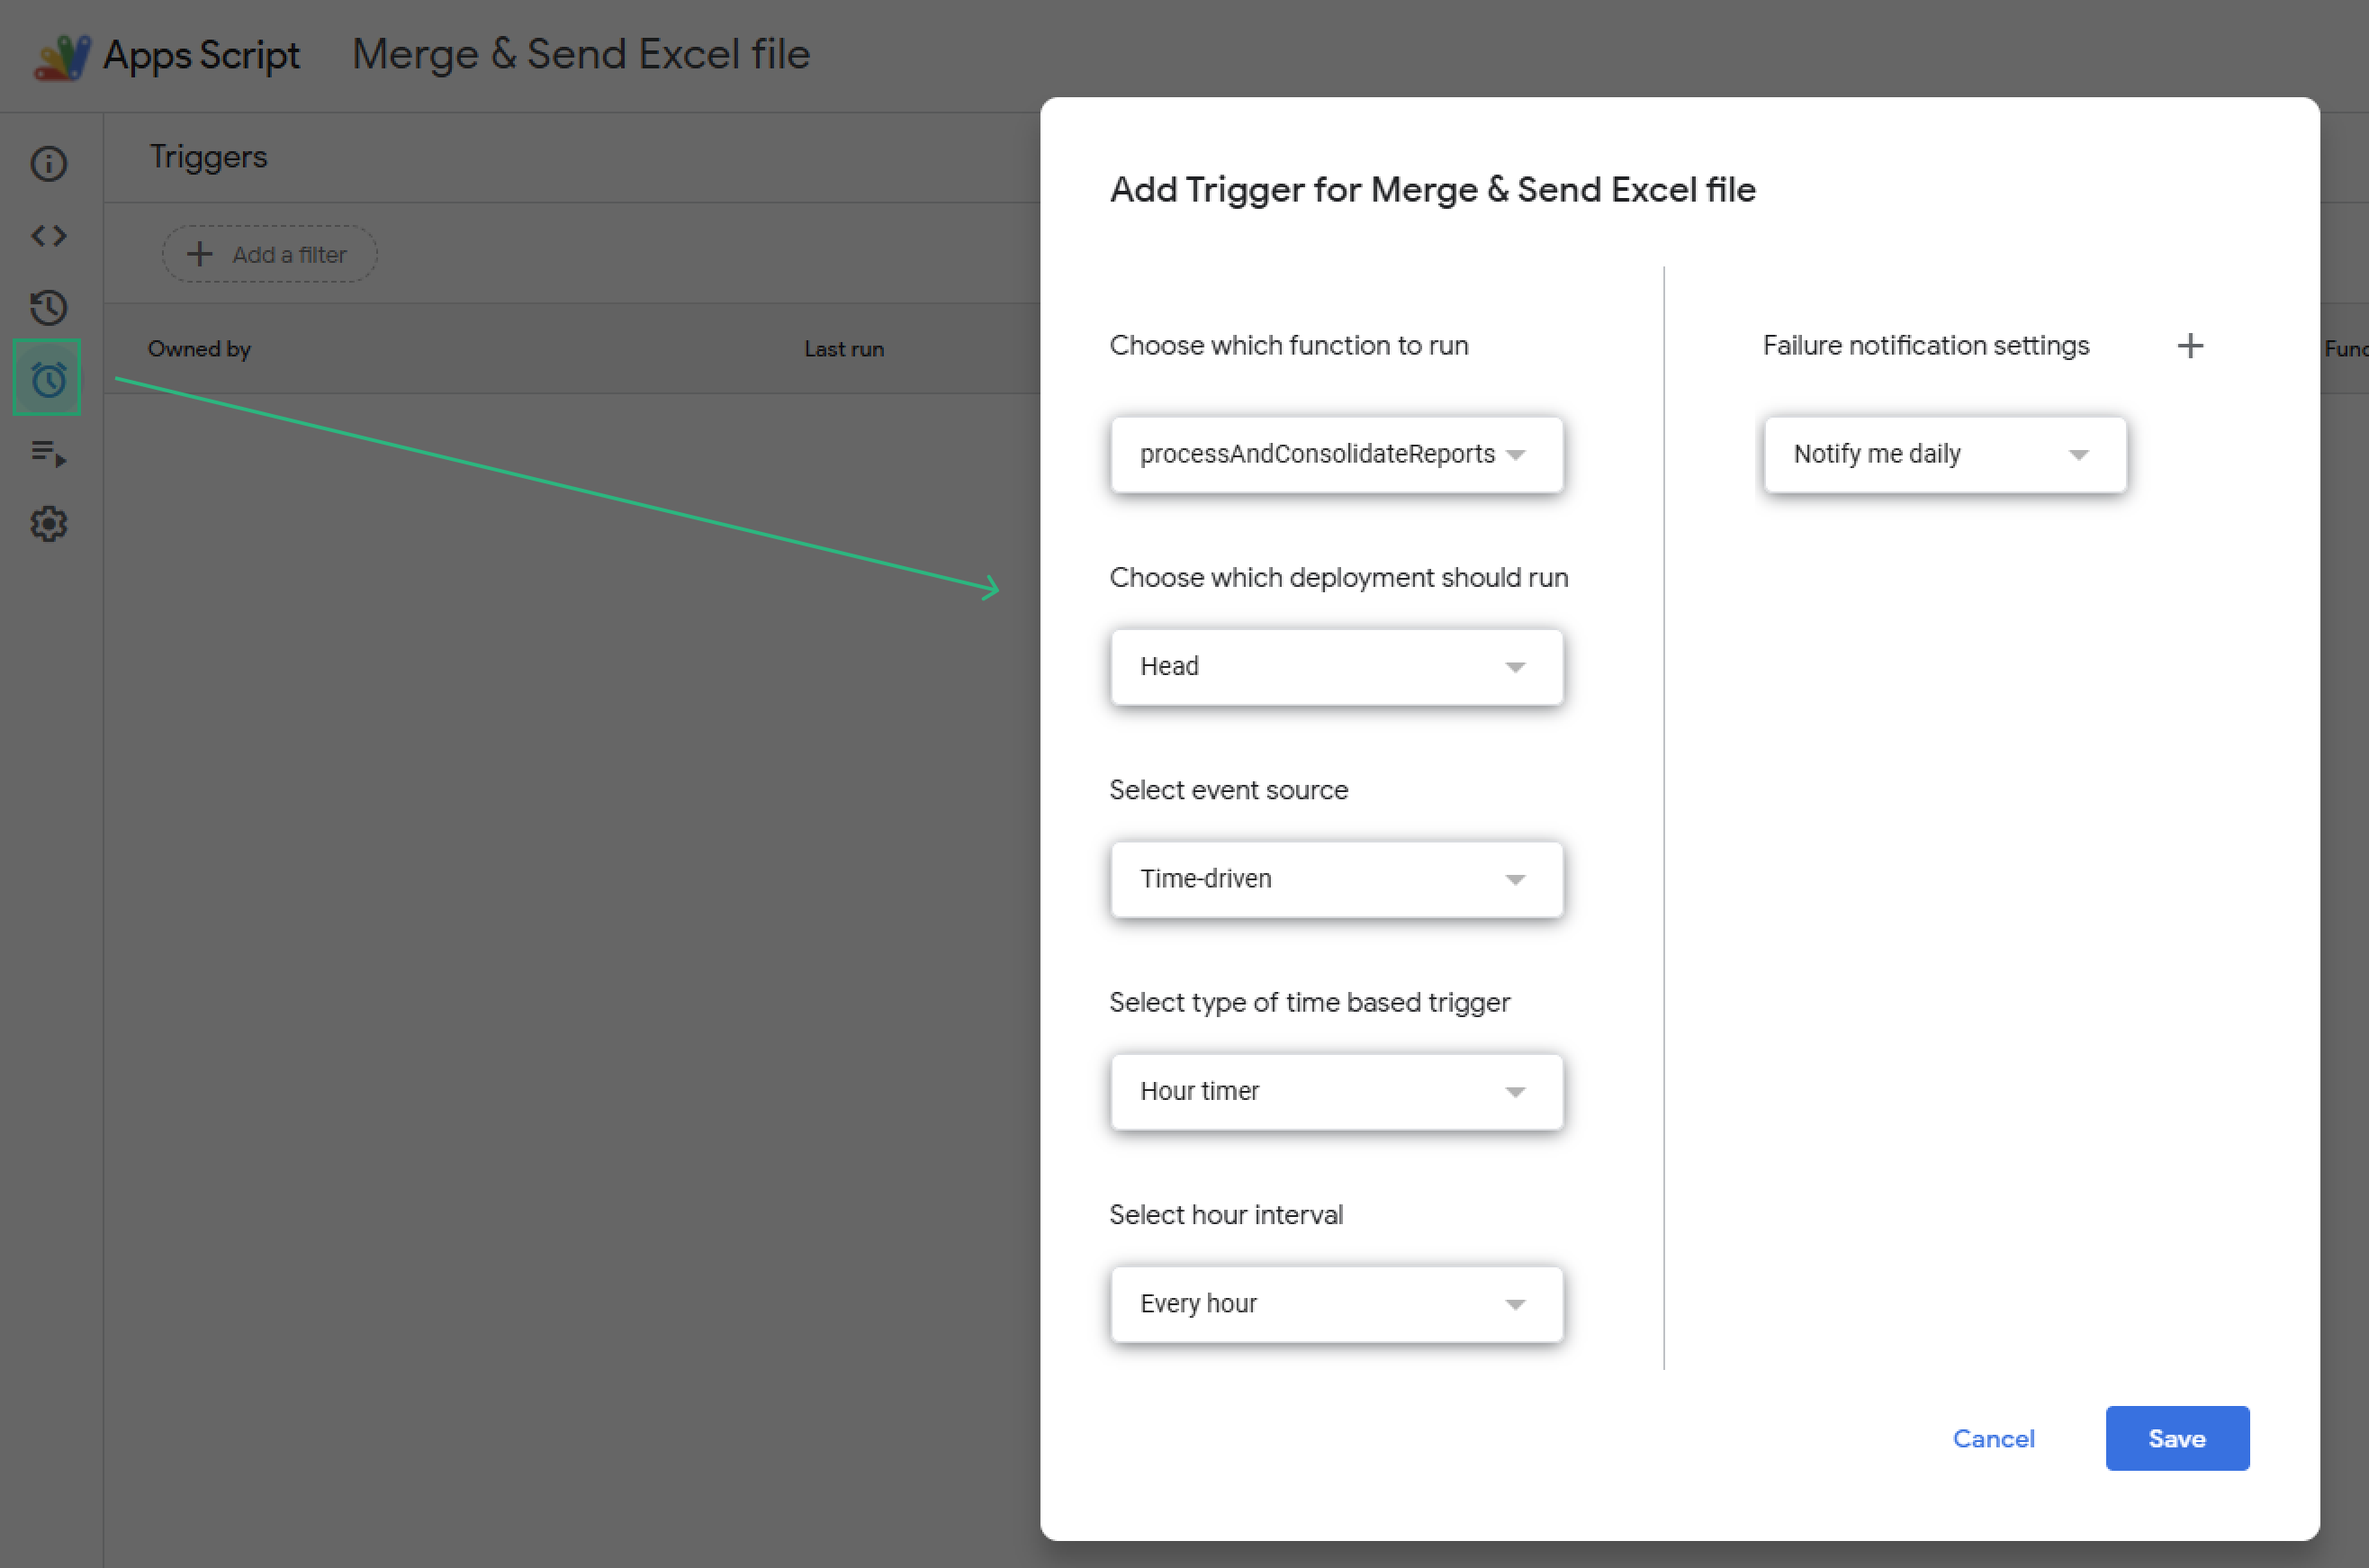
2.4 Add triggers
In Apps Script, go to Triggers (clock icon). Add trigger:
- Function:
processEmails
- Event source: Time-driven
- Select every hour (or desired frequency).
Now, the script will check Gmail periodically and forward any matching emails to your clients.
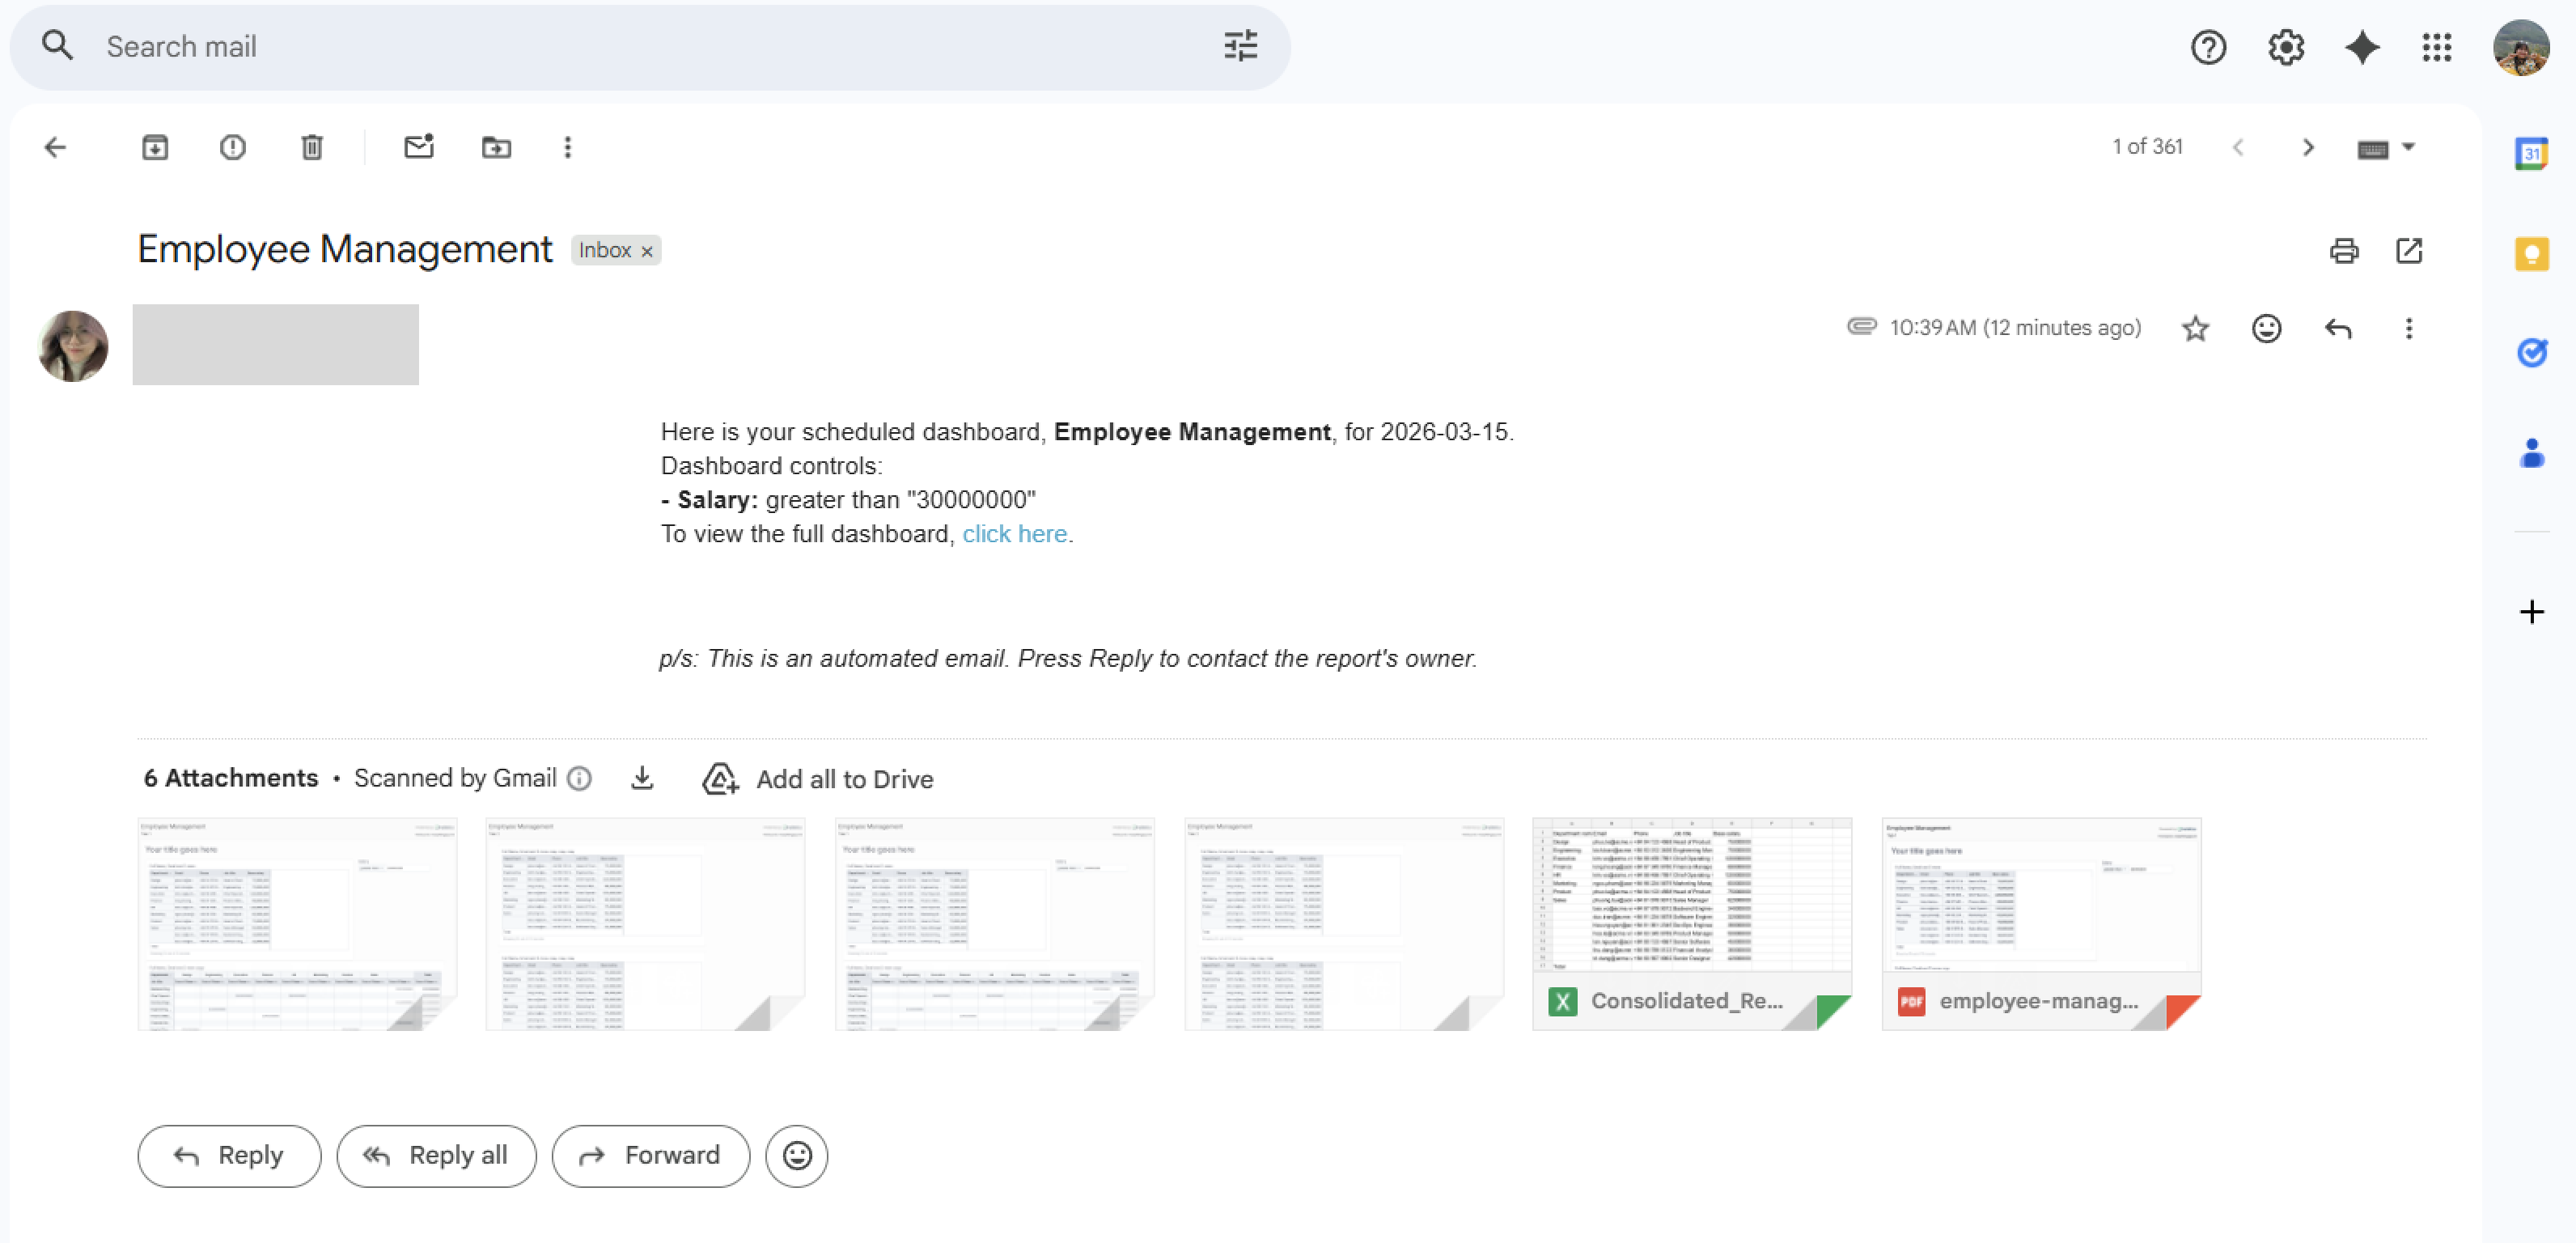
2.5. The results
Whenever Holistics delivers your 17-tab report to Gmail, this script will automatically trigger, merge the tables into a single-sheet (or few-sheet) layout, and email the clean version to your stakeholders. This keeps your data accurate while making it much easier for your team to scan.
We hope that this approach helps your team achieve the perfect balance between data accuracy and professional report layouts. If you need any help or encounter any struggles during the setup, feel free to ask below!
Happy reporting!