Two questions regarding displaying time on Holistics platform.
I have a TIME column in a MySQL DB - The time is when an event started.
I want to show an average of when it started every day for the past X months.
So if half the time it started at 8:00AM and half at 9:AM the Average will show 8:30AM.
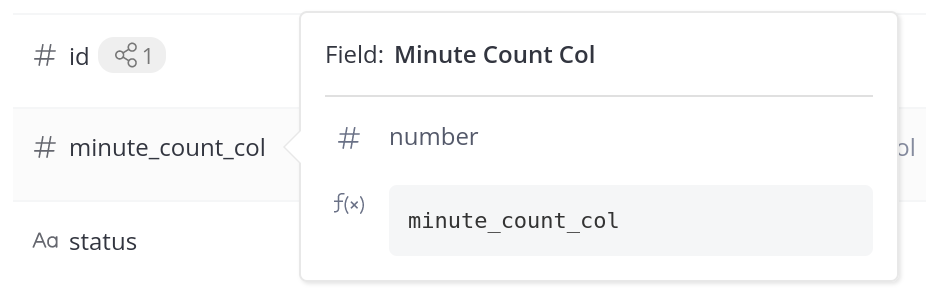
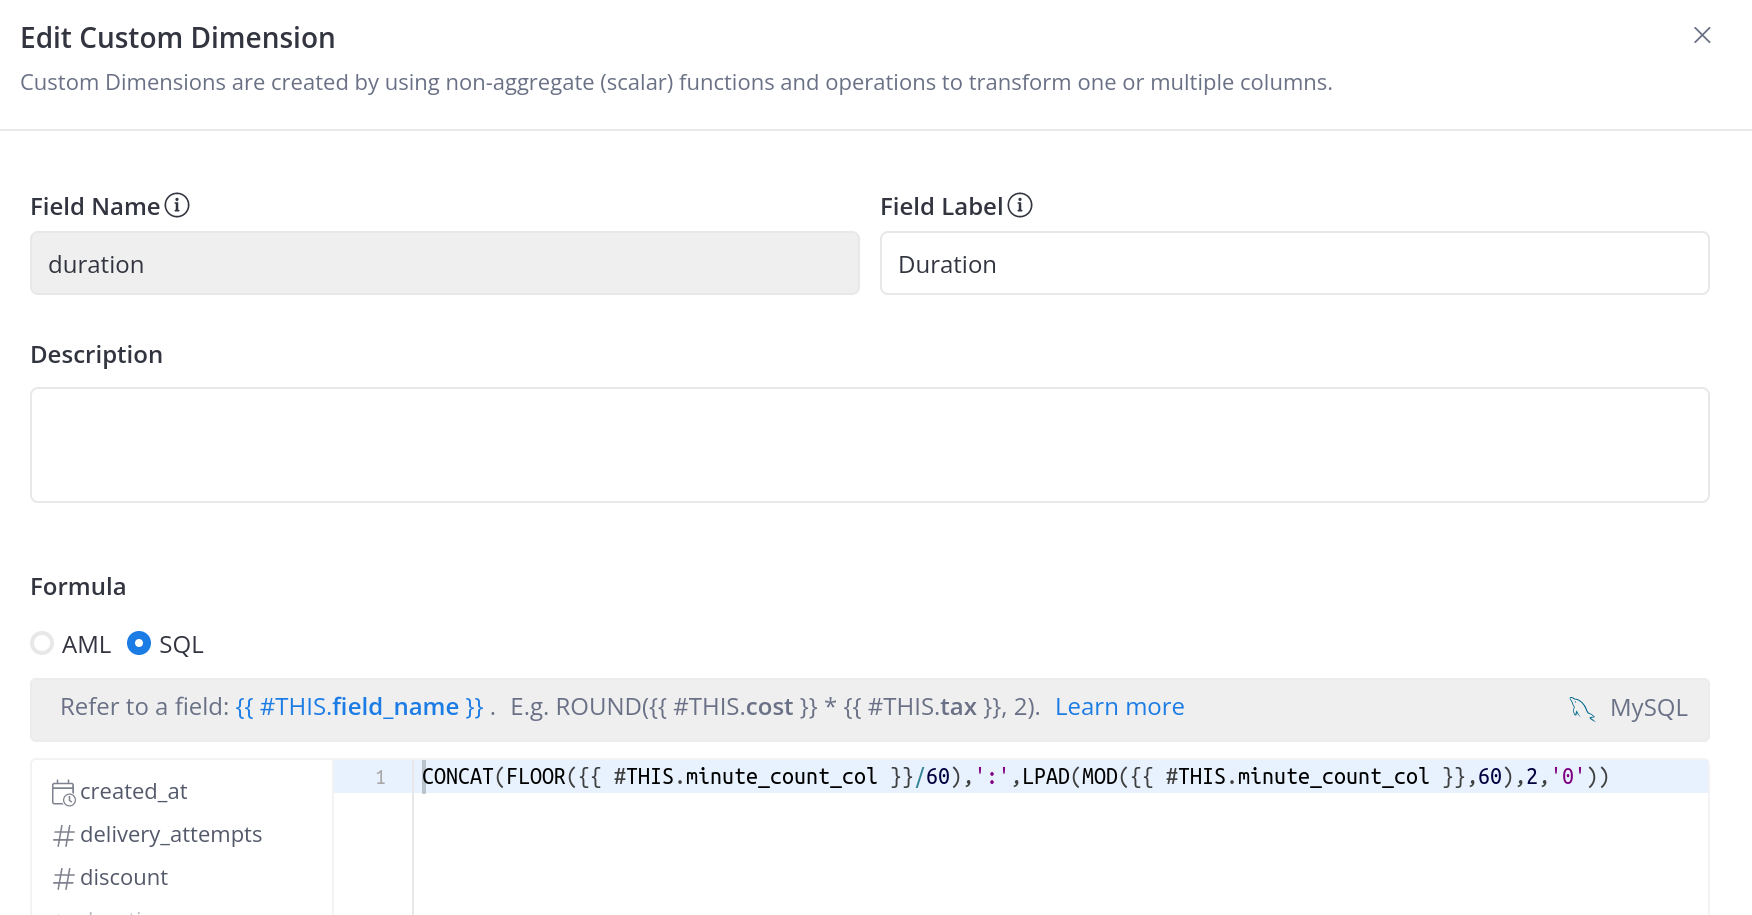
Second question is regarding activity time. I have the total amount of minutes that occurred in a day. But I don’t want to display 489 minutes. And I don’t want to arbitrarily divide that into 60 and show 8.15 hours.
I’d rather show it in a TIME format, in this case it would be 8:09 hours.
I want to show an average of when it started every day for the past X months.
So if half the time it started at 8:00AM and half at 9:AM the Average will show 8:30AM.
I’m not sure how will you want to show this value on your report and Holistics also does not natively support the type TIME column, so the easiest way I think is to convert the TIME column to minutes → Calculate the average minutes → Convert it back to type TIME or format the same as above (question 2nd)
Ref: Mysql Average on time column? - Stack Overflow
For aggregating value, the Custom Measure can help in your case. The query would be like this (I copy from the doc and modify a bit)
SEC_TO_TIME(AVG(
  CASE {{ #THIS.created_at }} BETWEEN NOW() - INTERVAL 30 DAY AND NOW()
  WHEN TRUE THEN TIME_TO_SEC({{ #THIS.time_col }})
  ELSE NULL
 END
))
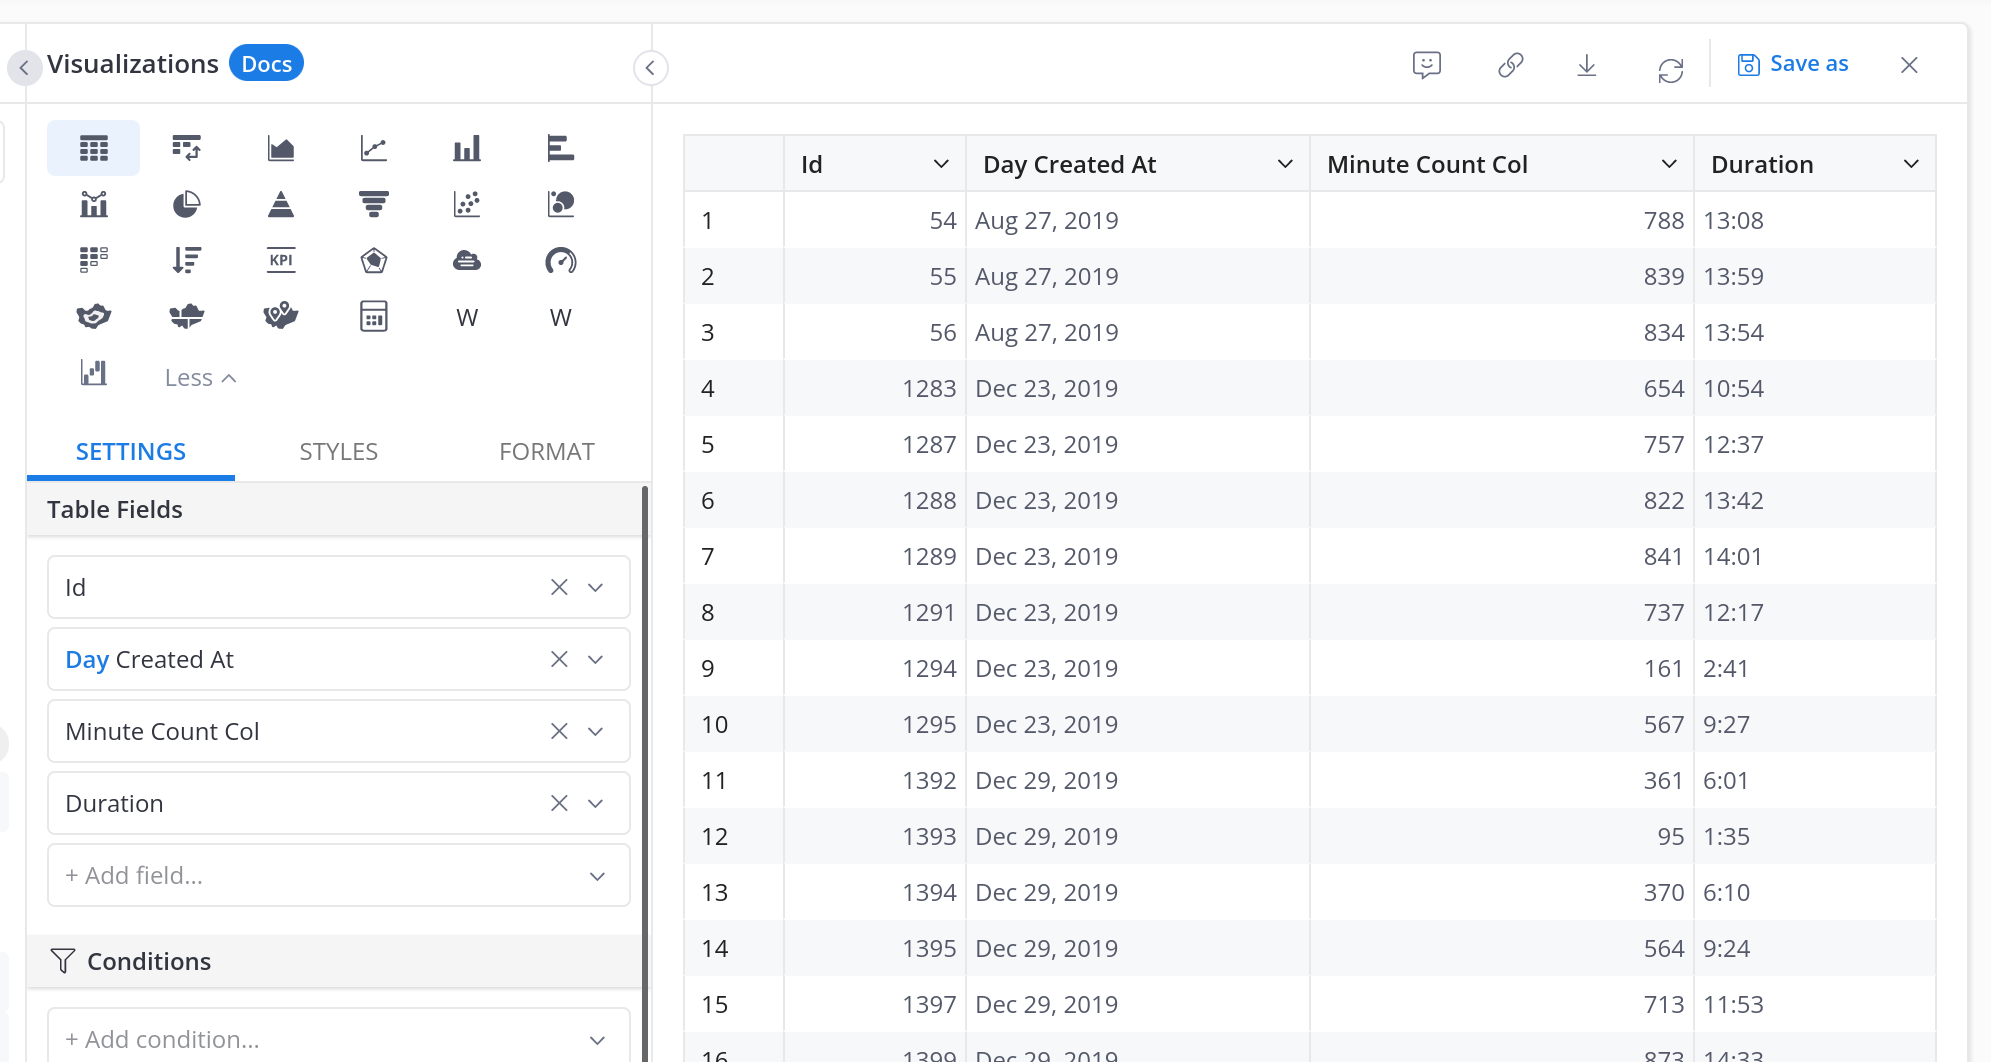
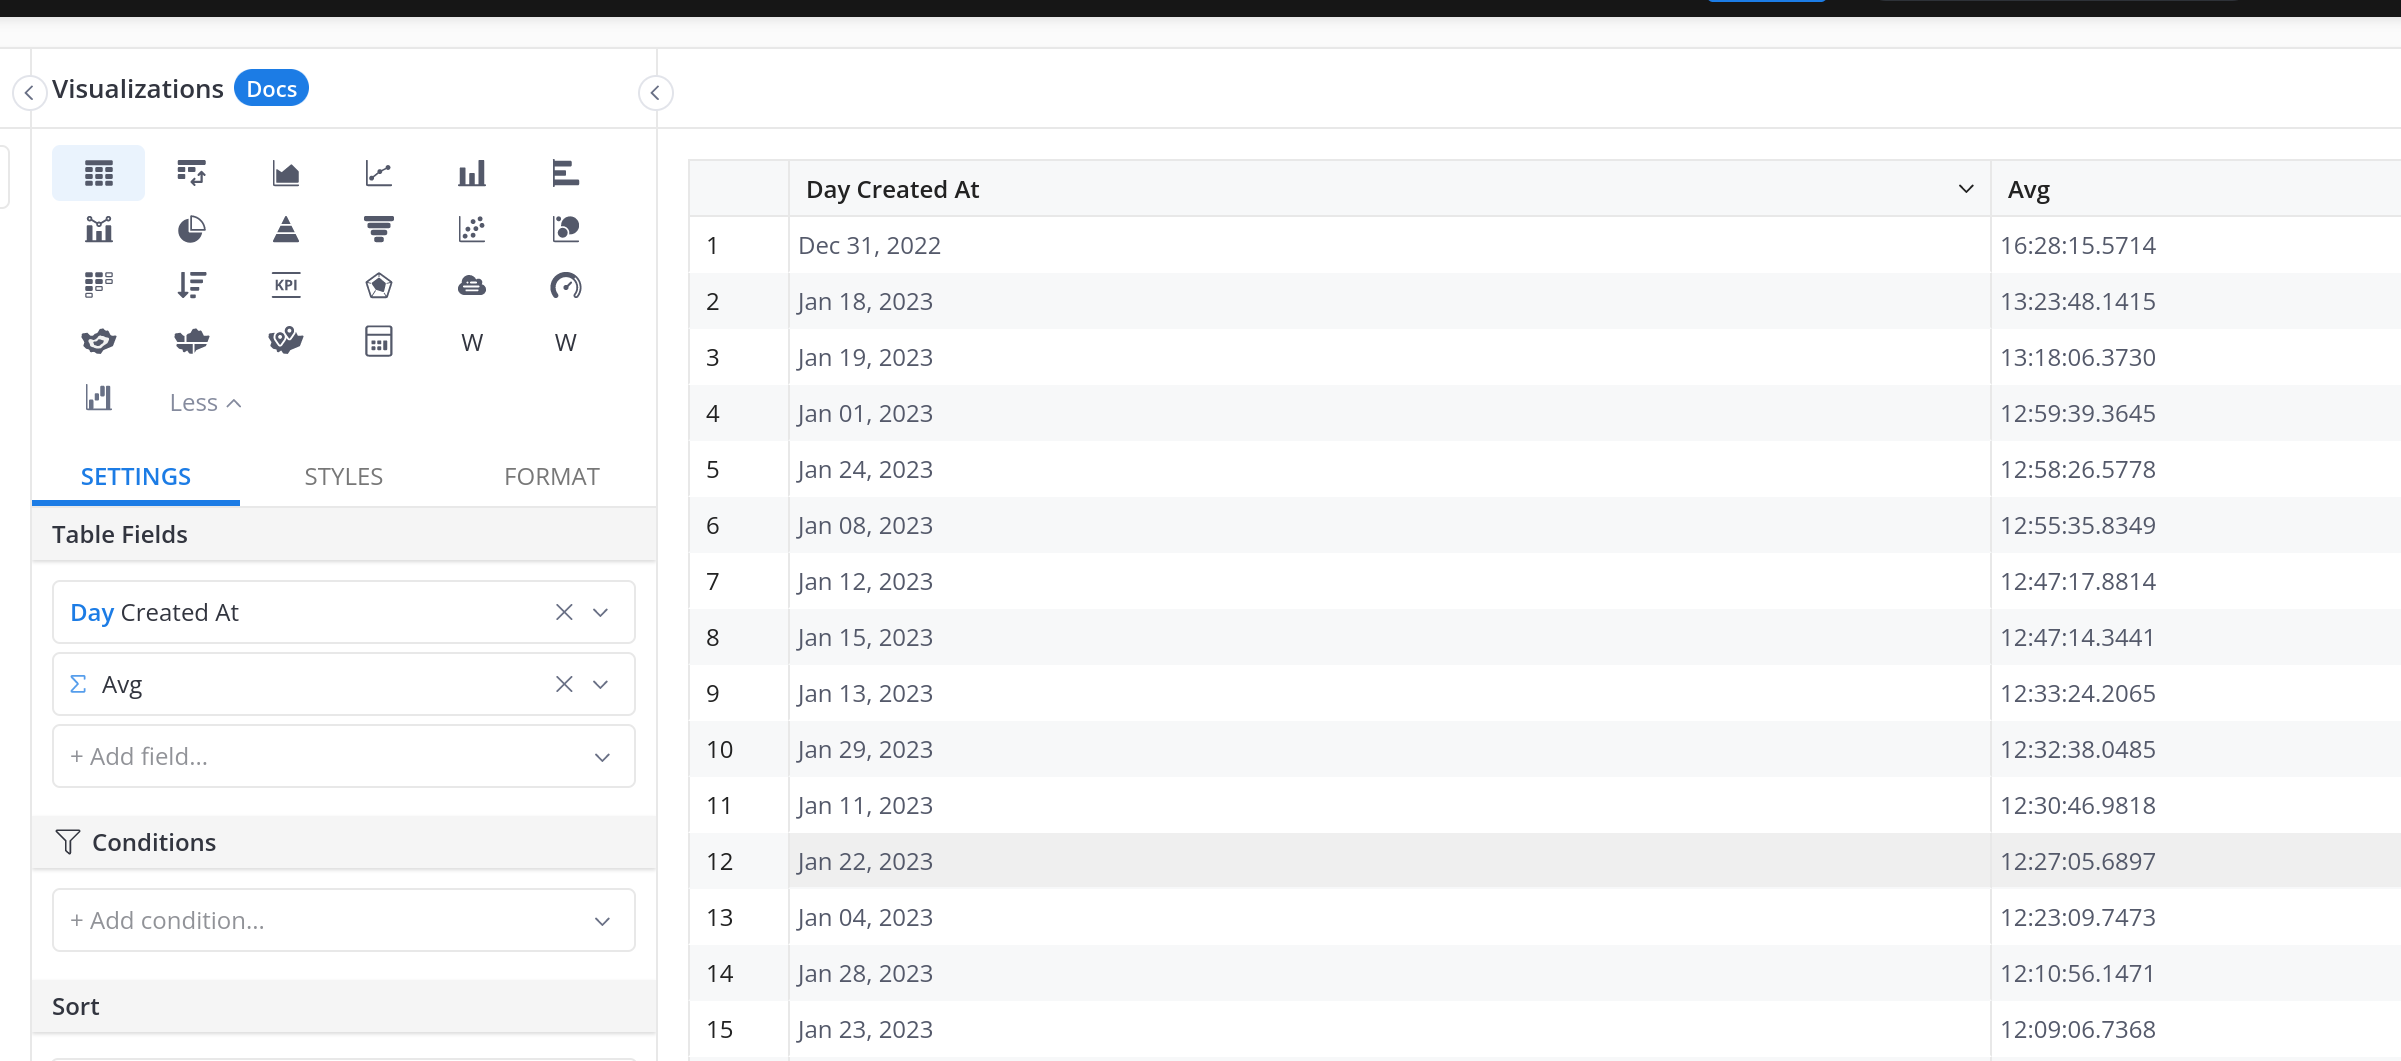
Here is what it looks like (Disclaimer: I haven’t checked whether it’s showing correctly or not as I’m playing around with randomized data, but it looks right, haha)
Btw, if it’s not what are you looking for, maybe you can check Transform Models as it allows you to create a data model from a SQL query which you can manipulate the however you want.