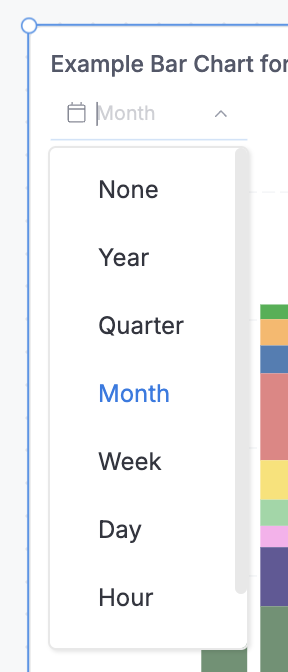
I’m working on Canvas Dashboards with combinations of column chart and data table widgets. In the column charts, I love that the user can specify different date granularities (day, month, year) in the top left:
It would be very helpful if the same date granularities were available to the report viewer in data tables or pivot tables. Maybe pivot tables would be a more natural place to add it if you could add or collapse different layers of date granularities?
I would love to know if anything like this is in your roadmap!
I see! Definitely agreed that being able to quickly switch date granularities in data tables and pivot tables would be very handy.
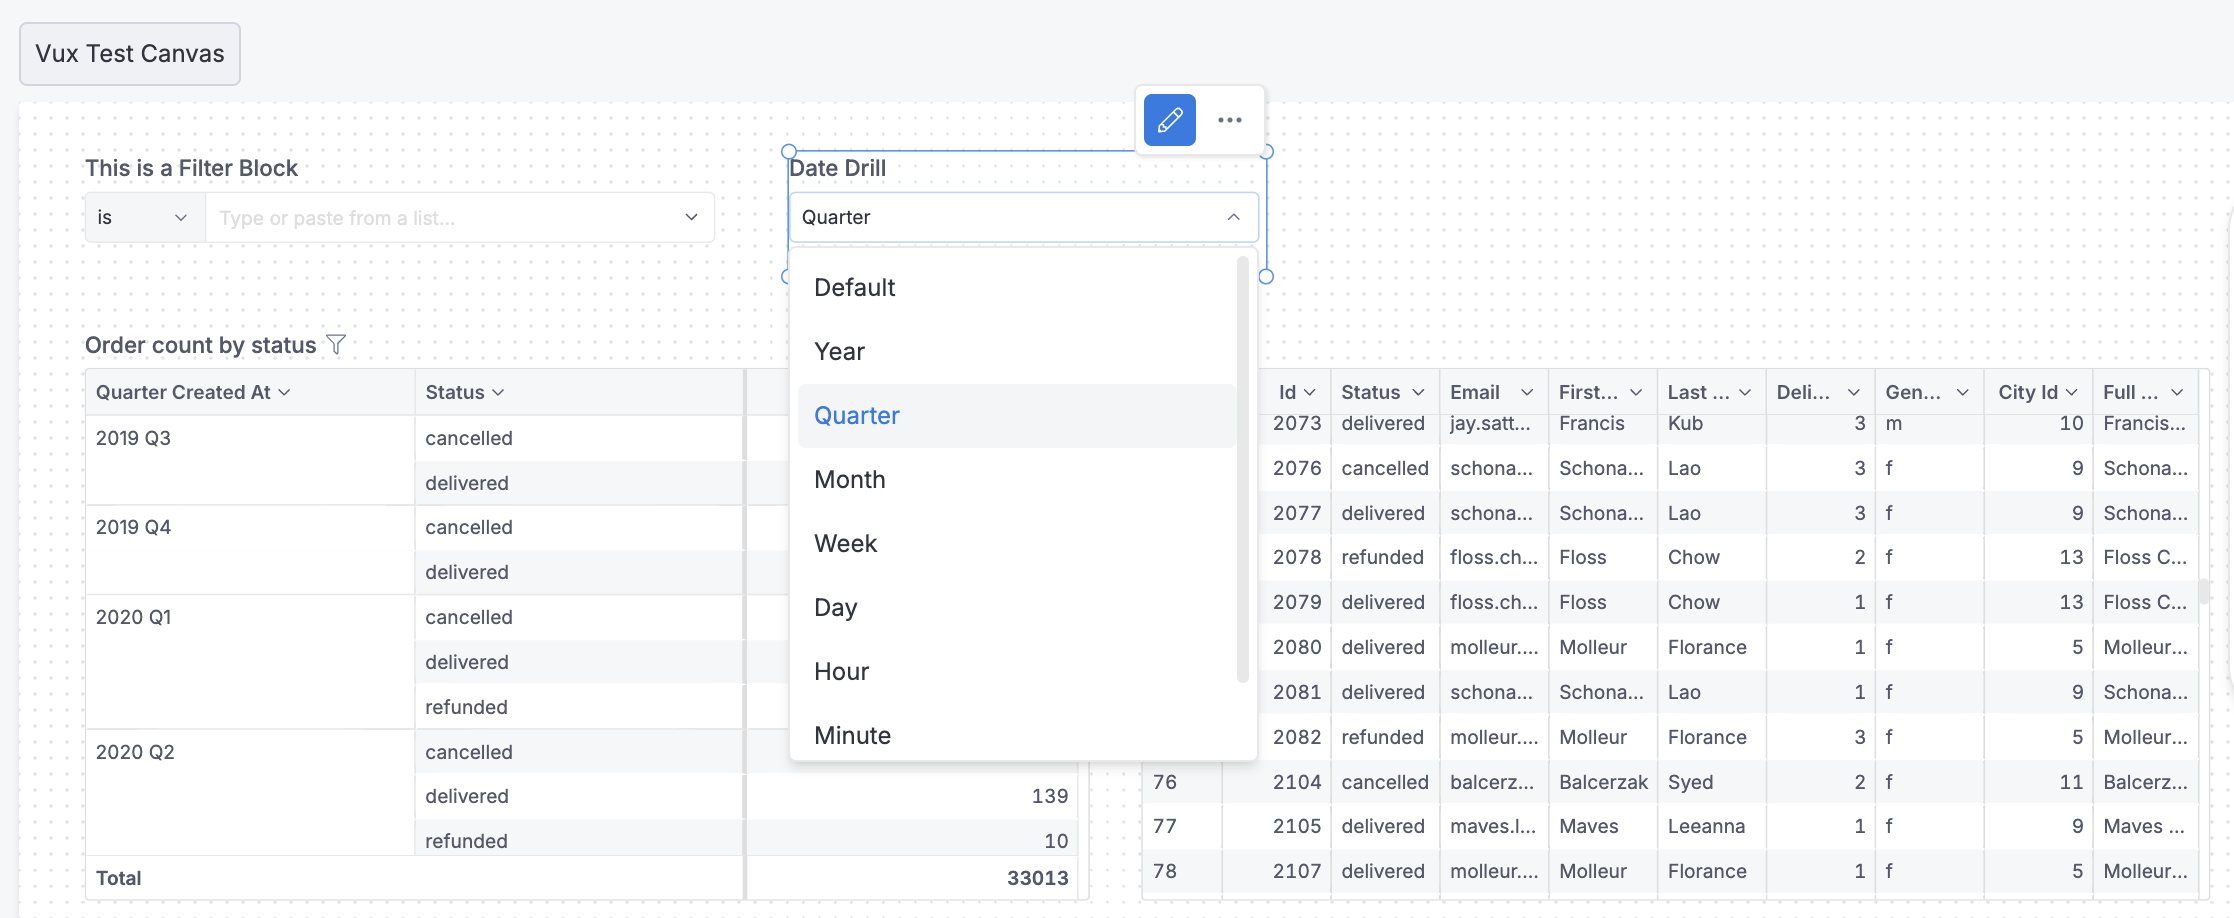
We call this feature Widget Date drill, and true that it’s only available for non-tabular charts at the moment.
I have noted down in our product backlog for later improvements. Will be sure to get back when there’s any update.
As for a workaround: you can set up Dashboard Date drill, and map it to your data tables and pivots.
Thanks for pointing out the Dashboard Date Drill. That does look helpful!
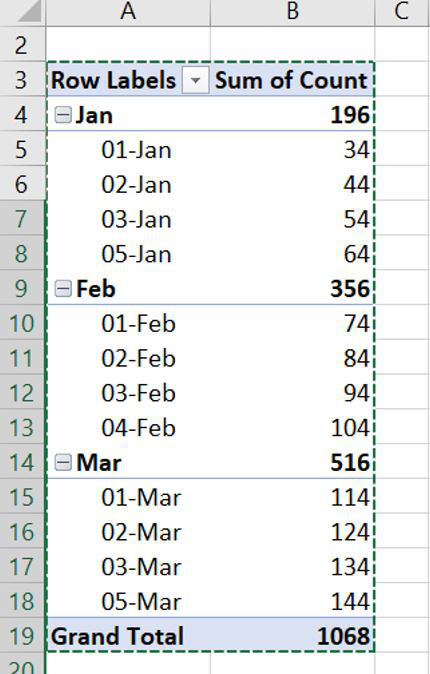
Yes, for pivot tables I was thinking similar to Excel with the boxes that look like this [-] for “opening” and “closing” the different levels of detail. I’m not sure how it works in Excel, but for our use case it would be nice if you didn’t have to click on every single month see the day-level details. It would be great to have one click to expand to the day-level or collapse to the month-level.
Following up to see if there’s been any progress on this? Not just for dates but for other fields as well.
We have multiple fields that have multiple level of details (category, sub-category, etc…) and having to create tables for every single one is bulky, time consuming, and makes all our analytics more complicated than they need to be. If we could just expand & collapse fields that would be very helpful.
What you shared definitely makes sense. When I forwarded Becca’s suggestion to my team, we were also aware that Pivot Table should cater for collapsing all types of groups and sub-groups. Very much aligned with you on this.
Unfortunately though, we haven’t been able to get to this implementation in the last months. It’s since we were focusing on Canvas Dashboard and the overall as-code experience at the time.
That said, I just checked with the responsible team and we do plan to get back to this in the near future. We’ll keep you posted when there’s a more concrete plan. Cheers!