So I’m looking to visualize the checkout flow in our ecomm app as a funnel in Holistics. We use Rudderstack to capture various events like user visiting a product page, expanding the details, adding to cart, checking out, providing payment details, successfully completing the order. My event data is available in Snowflake which is connected to my Holistics account.
I would like to create a funnel report to measure conversion rate and then also calculate it at different time periods. As in, how did the funnel look like last month vs current month. I would also like to breakdown or atleast filter funnel by a few dimensions (eg. merchant, product price range, country, etc.)
Could anyone give me a starting point on how to pre-aggregate the data to enable me to do this inside Holistics 3.0?
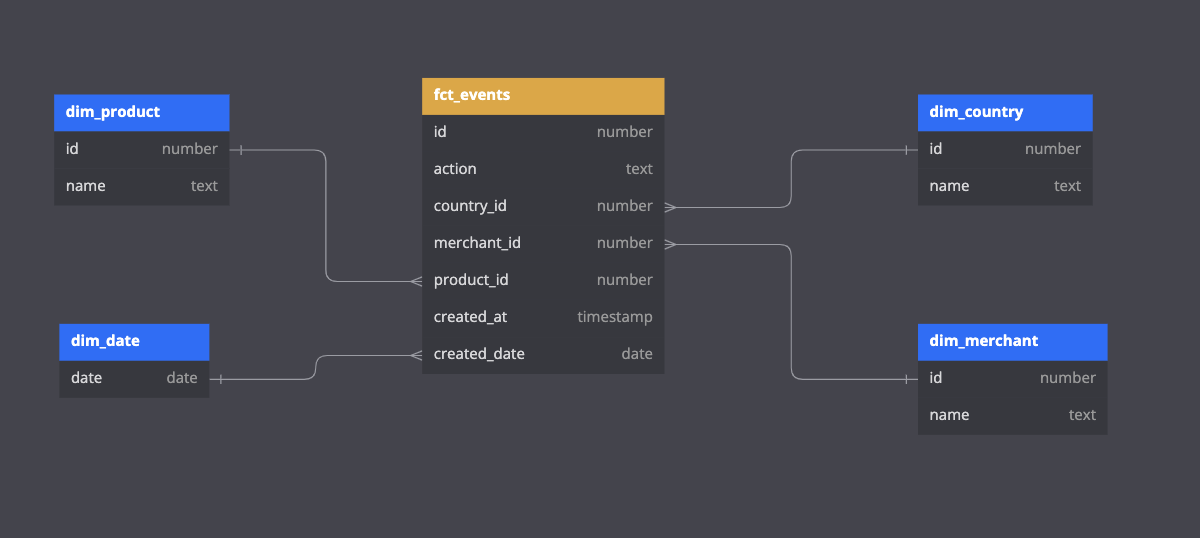
I assume you currently have raw Rudderstack event data stored in Snowflake. In Holistics, your modeling could look something like this: the fct_events model should include all the foreign keys connecting to the relevant dimensions, enabling filtering and drill-down on your dimensions.
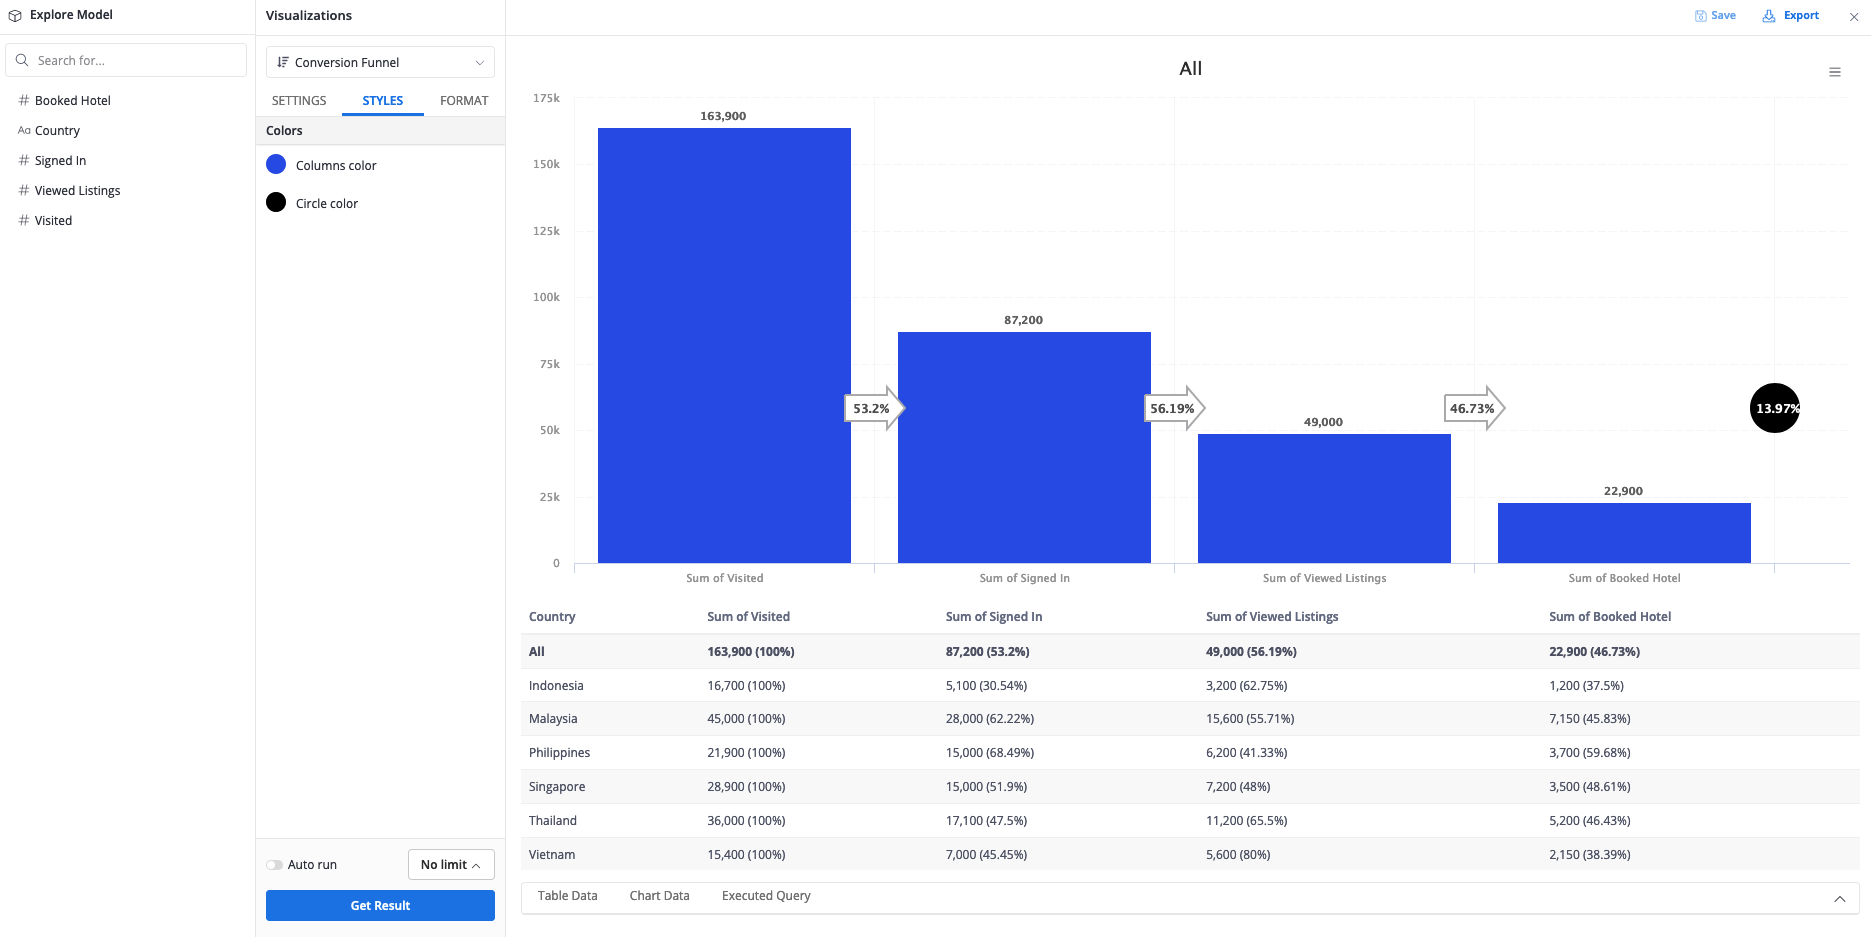
From the above modeling, once you create the required measures, you are now good to go and place those measures within our built-in funnel visualizations such as conversion funnel or pyramid funnel
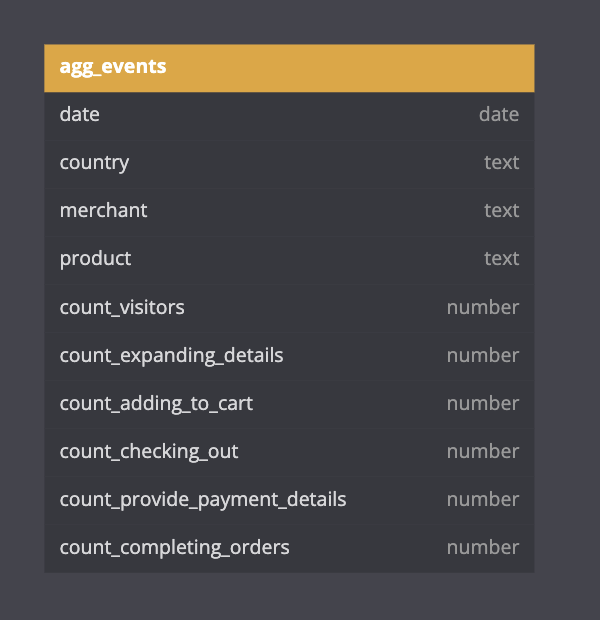
You can also create a query model that pre-aggregates the data, which might be more intuitive for you. Here’s an example of what a pre-aggregated model could look like
Thanks for your reply. The query model approach makes a lot of sense to me. I could just add the dimensions as columns and then store the counts of each funnel step I guess. Would Holistics automatically show overall conversion % and drop off % at each step?