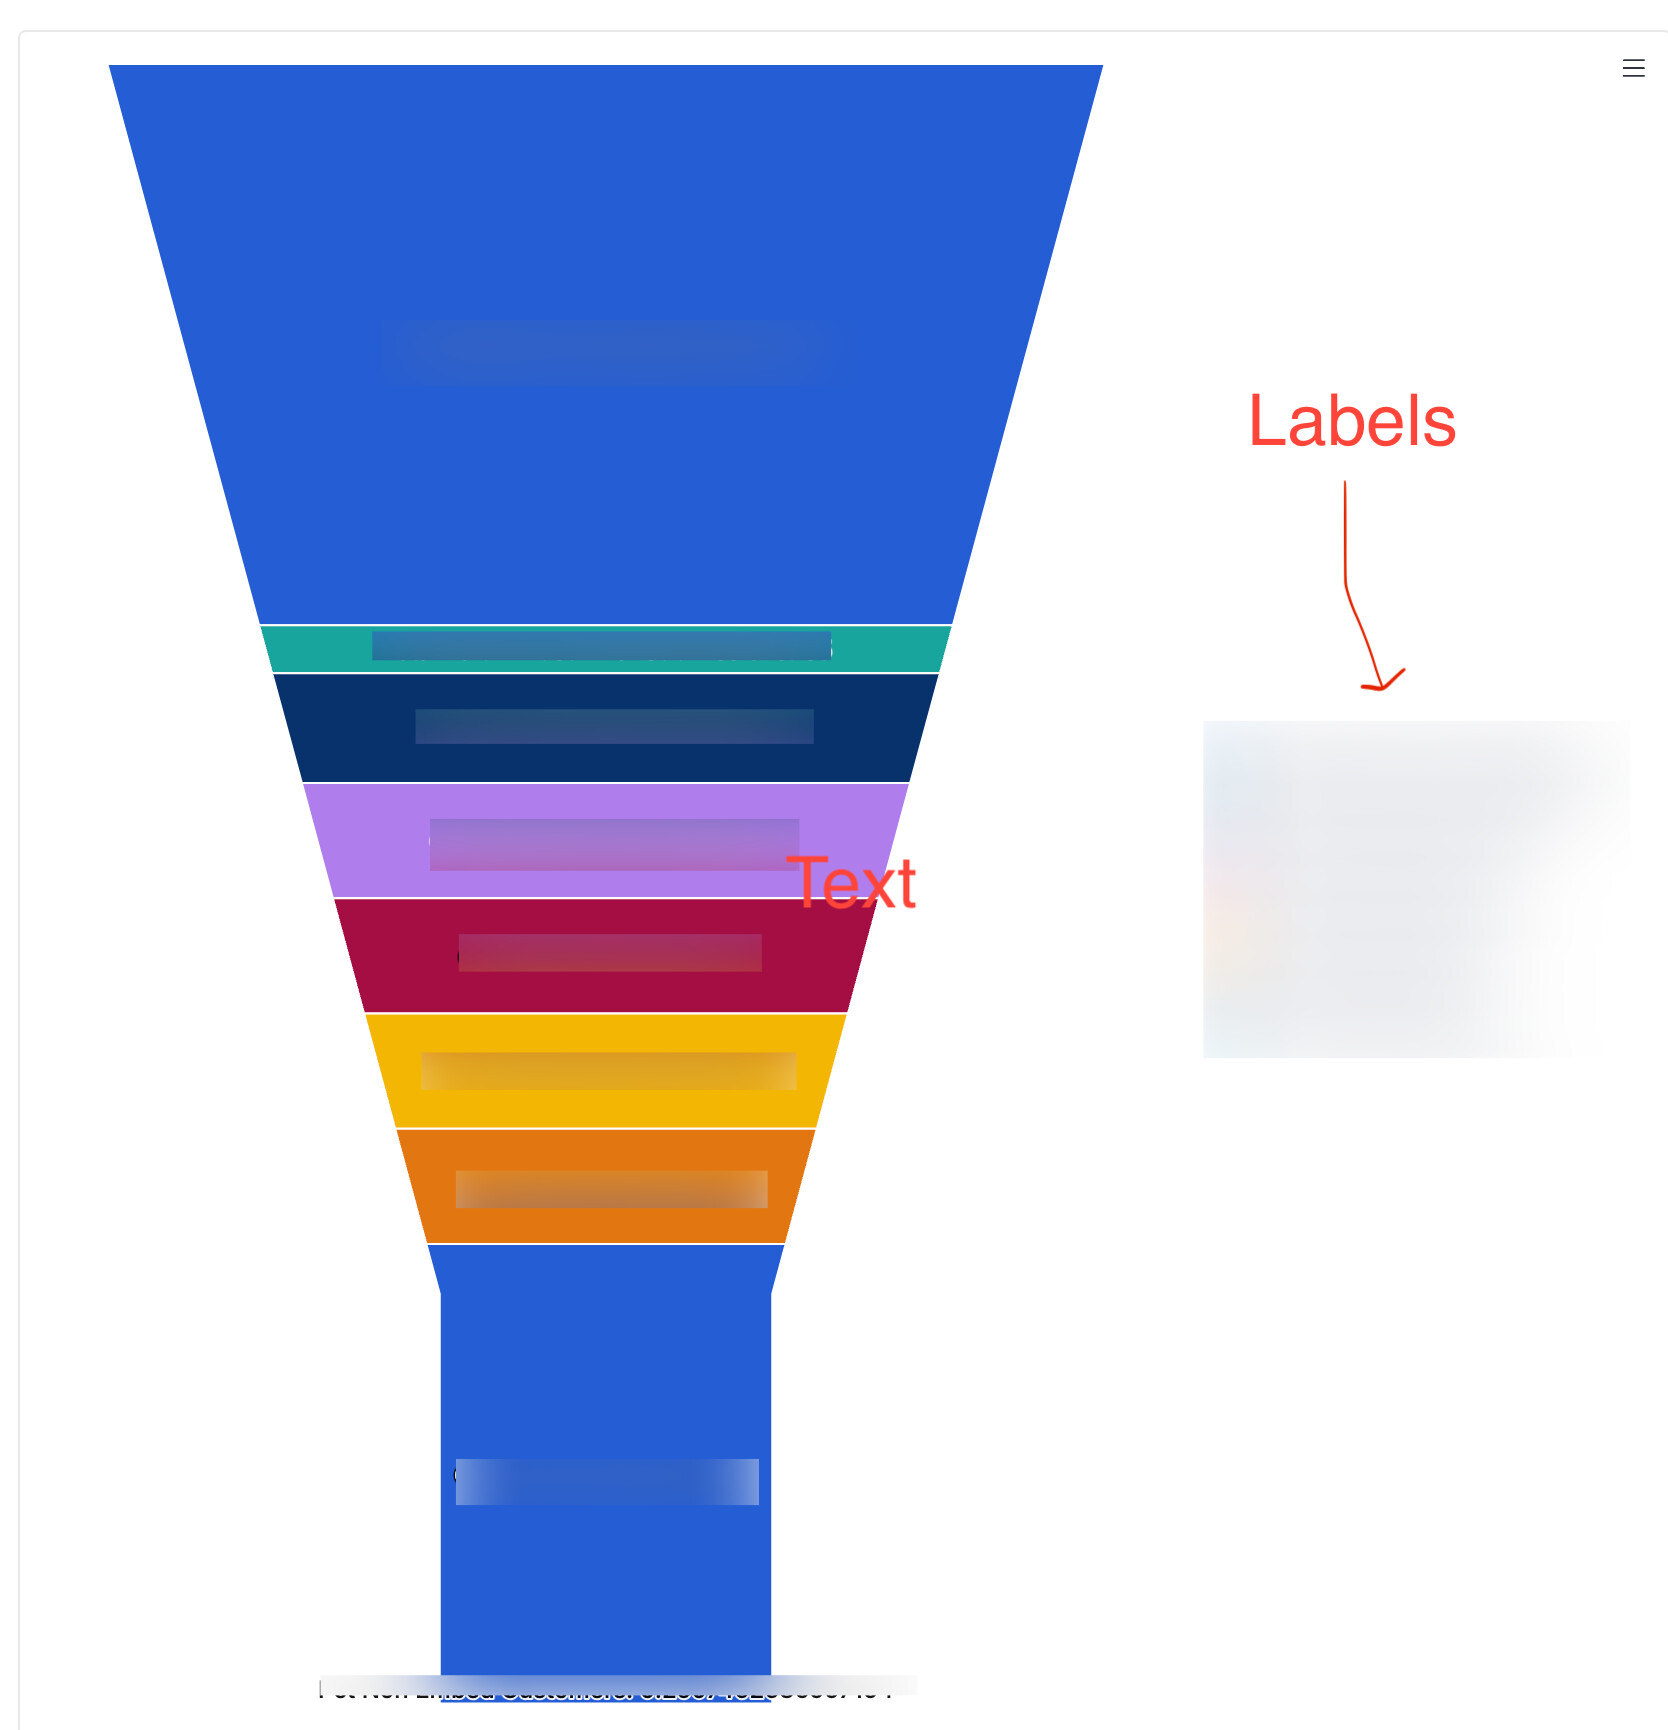
Hello! I’m working on a Funnel Visualization where I’d like Data labels visible for each slice of the funnel. While you’re able to turn Data tables on, they run off the right side of the visualization box quickly and you can’t see the majority of the label. Would there be any way to:
-Wrap these labels so all information is visible
-Move the positioning of these labels (e.g., Inline to the center of the funnel slice)
Thanks in advance!
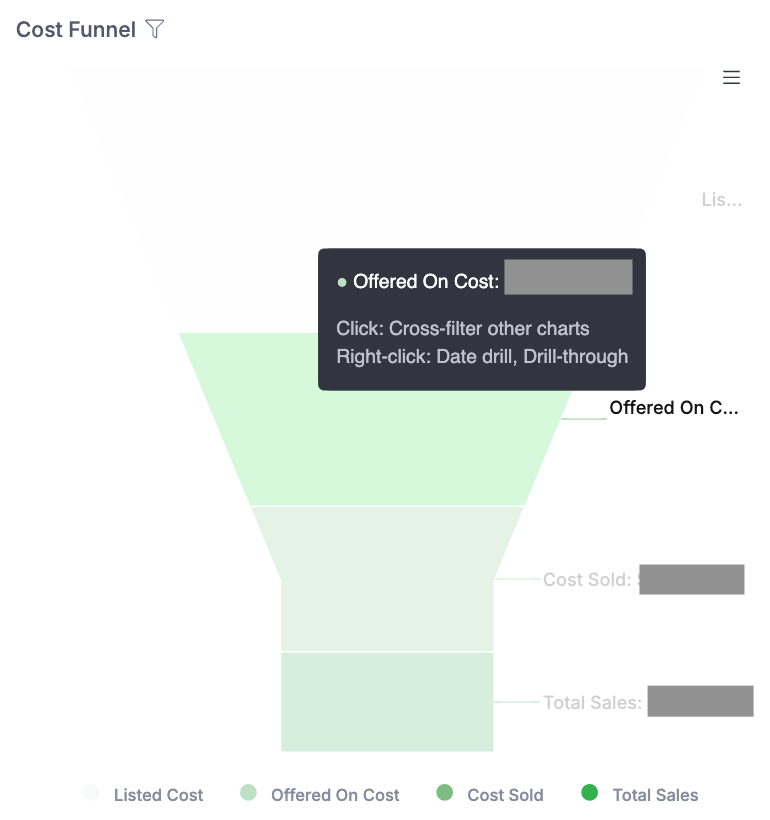
Hi Hannah, thanks for the inquiry! Can you elaborate a bit more on this. I tried out the Funnel Chart and Viz and still can see the labels.
Would you mind sharing:
- How many labels are you working with.
- A screenshot of the issue that you’re facing.
These would greatly help us understand the issues better!
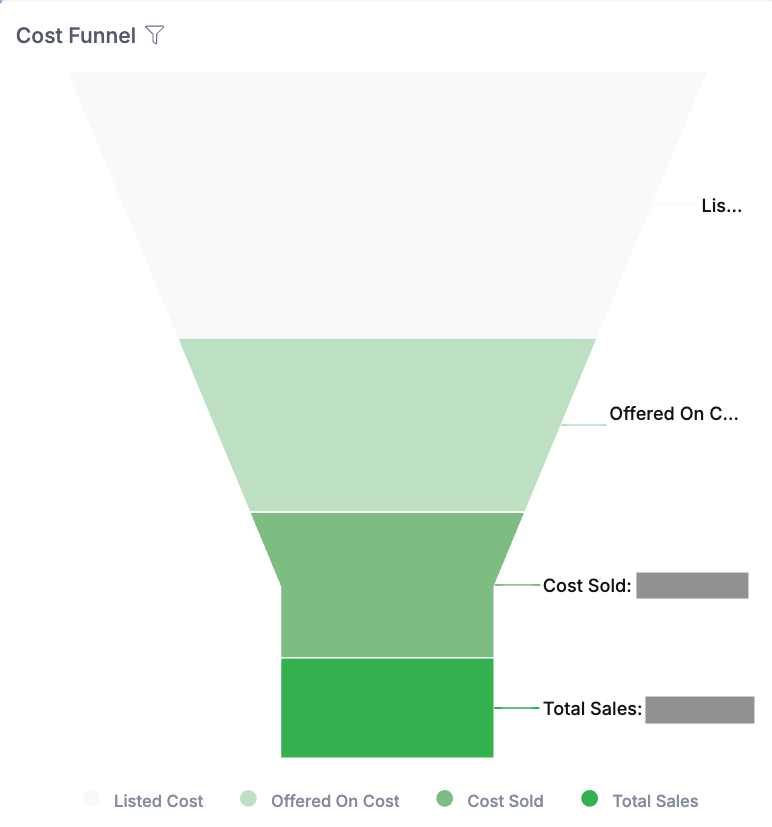
Sure! I’m working on a Funnel Visualization in a canvas dashboard with 4 labels. No matter how I resize, I’m only getting the start of the label for the top two layers of the funnel. I would love to achieve the inline text labeling it looks like you’re showing on your screenshot. The name of the field (which is already displayed in the legend) is much less important than the actual value, which I only seem to be able to read in full by hovering over the slices of the funnel in the tooltip.
1 Like
Hi @hannah.paxton, thanks for the detailed explanation!
We have a particular config that we just enabled for your organization that’d help you have a new look-and-feel for Funnel Charts. Now when you create a Funnel Chart, you should get a result similar to the image in my previous reply. Can you help to run the Funnel Chart again to see if the result looks correct? Many thanks.
1 Like
This is exactly what I was looking for - thanks so much!
1 Like