jediger
September 25, 2024, 5:37pm
1
I created a visualization that contains a constant value on the y axis. When I try to test an alert for this report, I get this error message:
Business calculation not found: !y_axis[0].series[2]_h_ref_const
Also, the png images generated by data alerts are cropped to 600px wide, cutting off a large chunk of the data.
Hi @jediger
Thank you for your feedback. It’d be great if you can share with us the following, so we can assist your better:
A screenshot of your report. We’d like to know which fields there are in the report.
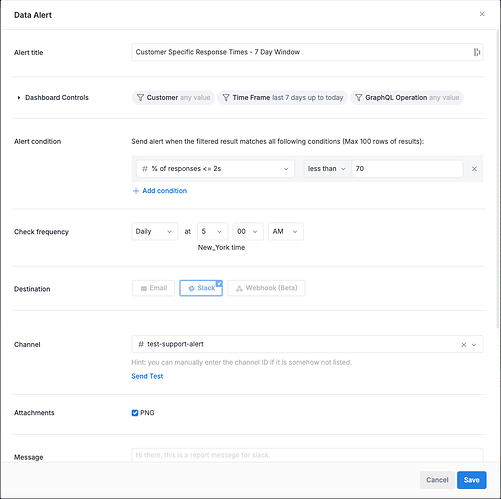
A screenshot of how you’re setting up the data alert.
A screenshot of the generated images.
Thanks so much,
jediger
September 26, 2024, 6:51pm
3
Bug 1 of 2: This data alert errors out when I try to send a test, with the error message:
This is the vizblock:
block v1: VizBlock {
    label: 'Responses under 2 seconds by Site Name'
    viz: BarChart {
      dataset: graphql_logs
      calculation metric_312c5a6 {
        label: '% of responses <= 2s'
        formula: @aql graphql_prod_logs.responses_under_2s / graphql_prod_logs.number_of_instances * 100;;
        calc_type: 'measure'
        data_type: 'number'
      }
      calculation of_responses_5_s {
        label: '% of responses <= 5s'
        formula: @aql graphql_prod_logs.responses_under_5s / graphql_prod_logs.number_of_instances * 100;;
        calc_type: 'measure'
        data_type: 'number'
      }
      filter {
        field: ref('graphql_prod_logs', 'user_id')
        operator: 'not_null'
        value: []
      }
      filter {
        field: ref('site_users', 'site_name')
        operator: 'not_null'
        value: []
      }
      filter {
        field: ref('graphql_prod_logs', 'original_url')
        operator: 'is'
        value: '/graphql'
      }
      filter {
        field: ref('sites', 'buyer_or_seller')
        operator: 'is'
        value: 'SELLER'
      }
      filter {
        field: ref('graphql_prod_logs', 'responses_under_2s')
        operator: 'greater_than'
        value: '0'
      }
      x_axis: VizFieldFull {
        ref: ref('site_users', 'site_name')
        format {
          type: 'text'
        }
      }
      y_axis {
        series {
          field: VizFieldFull {
            ref: 'metric_312c5a6'
            format {
              type: 'number'
              pattern: '#,###0.00'
            }
          }
          settings {
            color: '#2AB24A'
          }
        }
        series {
          field: VizFieldFull {
            ref: 'of_responses_5_s'
            format {
              type: 'number'
              pattern: 'inherited'
            }
          }
          settings {
            color: '#7FDABD'
          }
        }
        series {
          field: ConstantVizField {
            label: '<= 2s SLA'
            value: 60
          }
          settings {
            color: '#2AB24A'
          }
        }
        series {
          field: ConstantVizField {
            label: '<= 5s SLA'
            value: 90
          }
          settings {
            color: '#7FDABD'
          }
        }
      }
      settings {
        row_limit: 40
        sort {
          field_index: 0
          direction: 'asc'
          type: 'series'
        }
      }
    }
  }
jediger
September 26, 2024, 6:56pm
4
Bug 2/2:
Phien_Pham
September 27, 2024, 8:53am
5
Hi Johanna,
Thanks a lot for your report!
We’re fixing your reported bugs and will let you know when the patch is released.
Best regards,
1 Like

