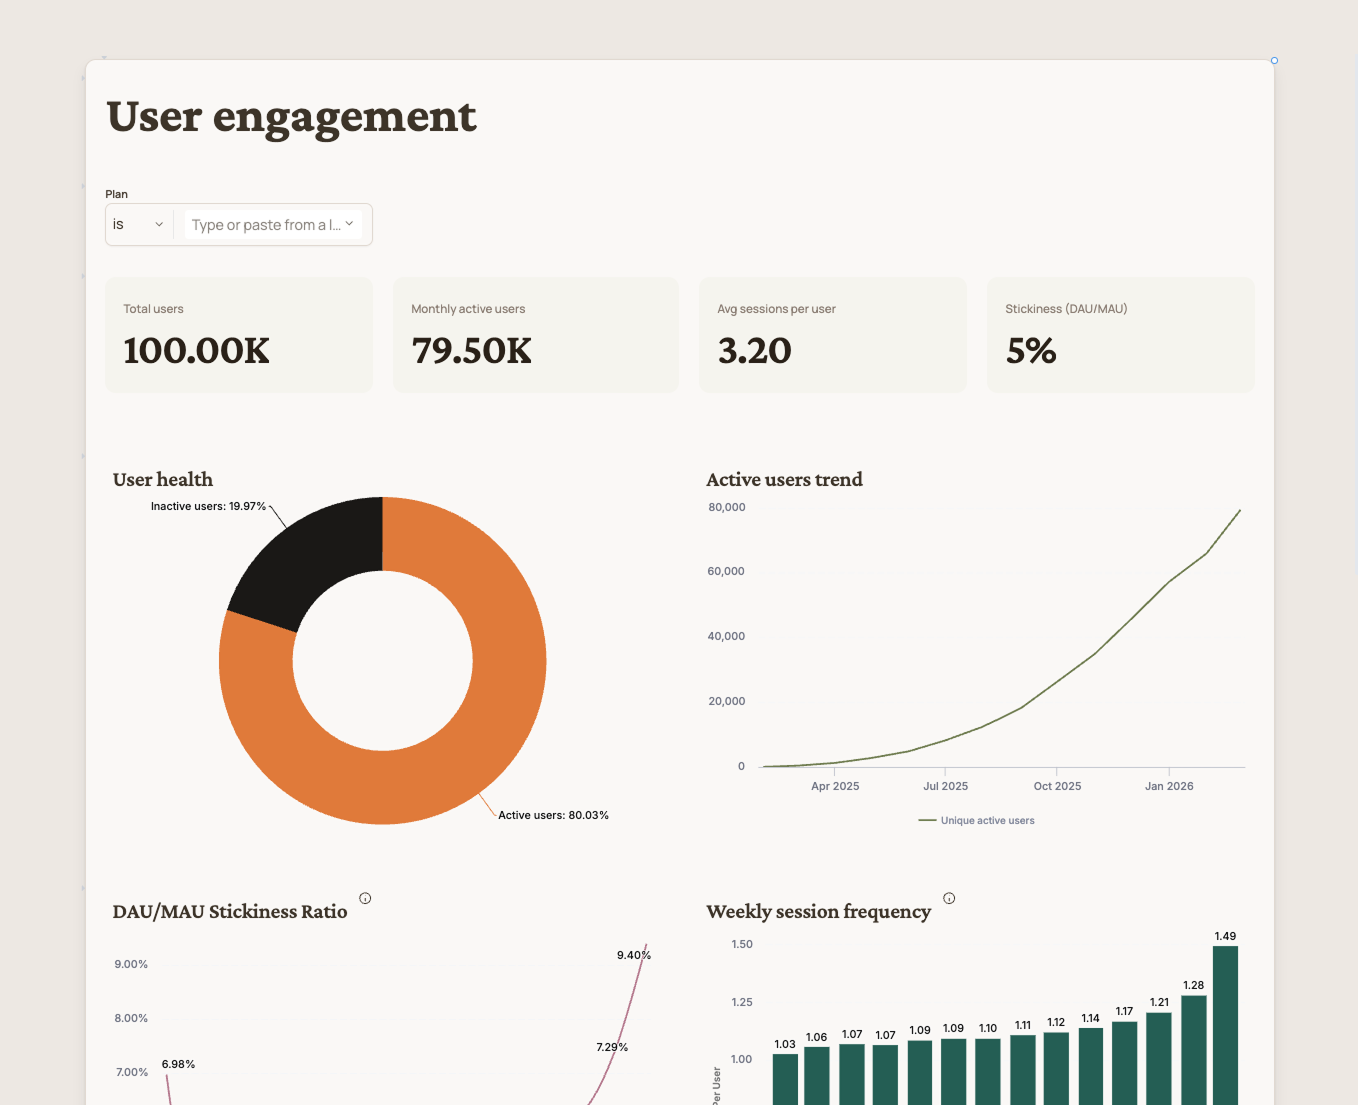
User engagement & feature adoption dashboard
What it is
A product analytics dashboard that tracks user engagement, feature adoption, and content creation for a B2B SaaS tool — built with uploaded CSV data and a custom Claude-inspired theme.
Description
This dashboard is for product managers, growth leads, and anyone who needs to understand how users are engaging with the product without writing ad-hoc queries. Instead of switching between analytics tools, you get user activity trends, feature adoption rates, and a full monthly metrics overview all in one place — filterable by plan tier.
Key features
- Plan filter so you can zoom into Free, Plus, Business, or Enterprise users in one click
- KPI row with Total Users, MAU, Avg Sessions/User, and DAU/MAU Stickiness at a glance
- User health donut showing active vs inactive split, paired with an active users trend line
- Stickiness ratio chart tracking how consistently daily users return relative to monthly, with a smooth trend line
- Weekly session frequency bars showing whether users are opening the app more often over time
- Monthly metrics overview — a MetricSheet with sparklines across 4 sections (User engagement, Content creation, Feature adoption, Device mix) so you can spot trends in one table
- Feature adoption tab with adoption by plan, usage intensity scatter, AI feature spotlight, and category breakdown
- Custom theme — Crimson Pro + Manrope fonts, warm earth-tone palette inspired by Claude’s design language