
What it is
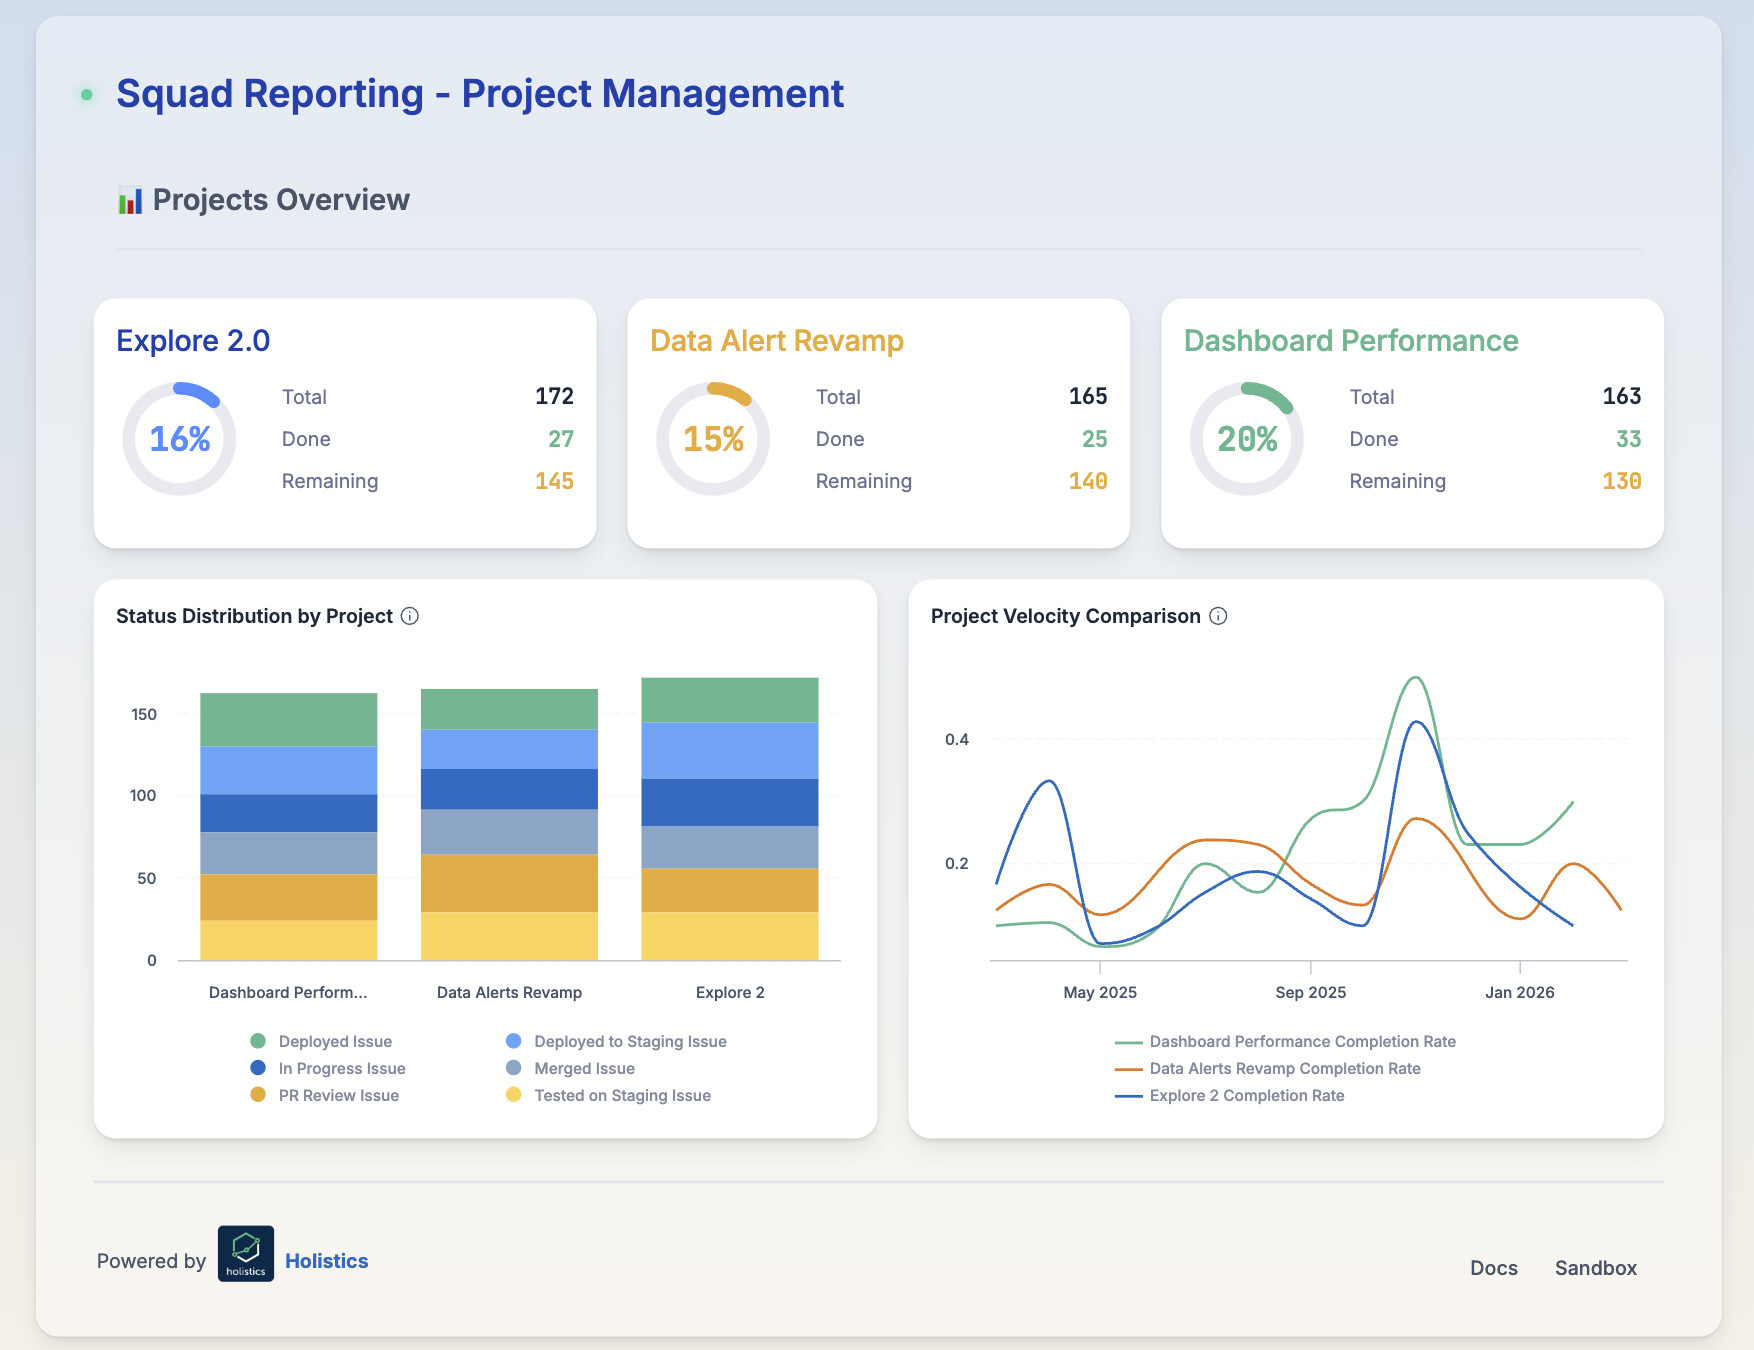
A comprehensive engineering squad dashboard that tracks project health, delivery velocity, and bottlenecks across multiple concurrent initiatives — all from a single command center.
Description
This dashboard is for engineering managers, product leads, and squad teams who need real-time visibility into project progress without jumping between Linear, Jira, or endless status update meetings. Instead of chasing metrics across tools, you get project completion rates, cycle time trends, quality signals, and bottleneck detection all in one place — filterable by project and time period.
Key features
- Projects Overview — Instantly see which projects are on track and which are falling behind. The three project cards show completion rates and velocity trends so you can catch problems early and reallocate resources before deadlines slip.
- Metric Overview — Get the pulse of your team’s delivery health. Track shipped issues, cycle times, and WIP to make smarter sprint planning decisions. The burnup chart tells you if you’re drowning in backlog or actually making progress.
- Time-to-Market Analysis — Figure out where your process is actually slow. Is it PR review? Staging? Deployment? Use the breakdown charts to find your bottlenecks and fix the stages that matter most.
- Quality & Bottlenecks — Catch quality issues before they explode and unblock stuck work fast. Track bug ratios week by week, spot misprioritized work (why is that low-priority ticket taking so long?), and surface stale issues that have been sitting too long — all automatically sorted so you know exactly what needs attention.
Happy exploring! 