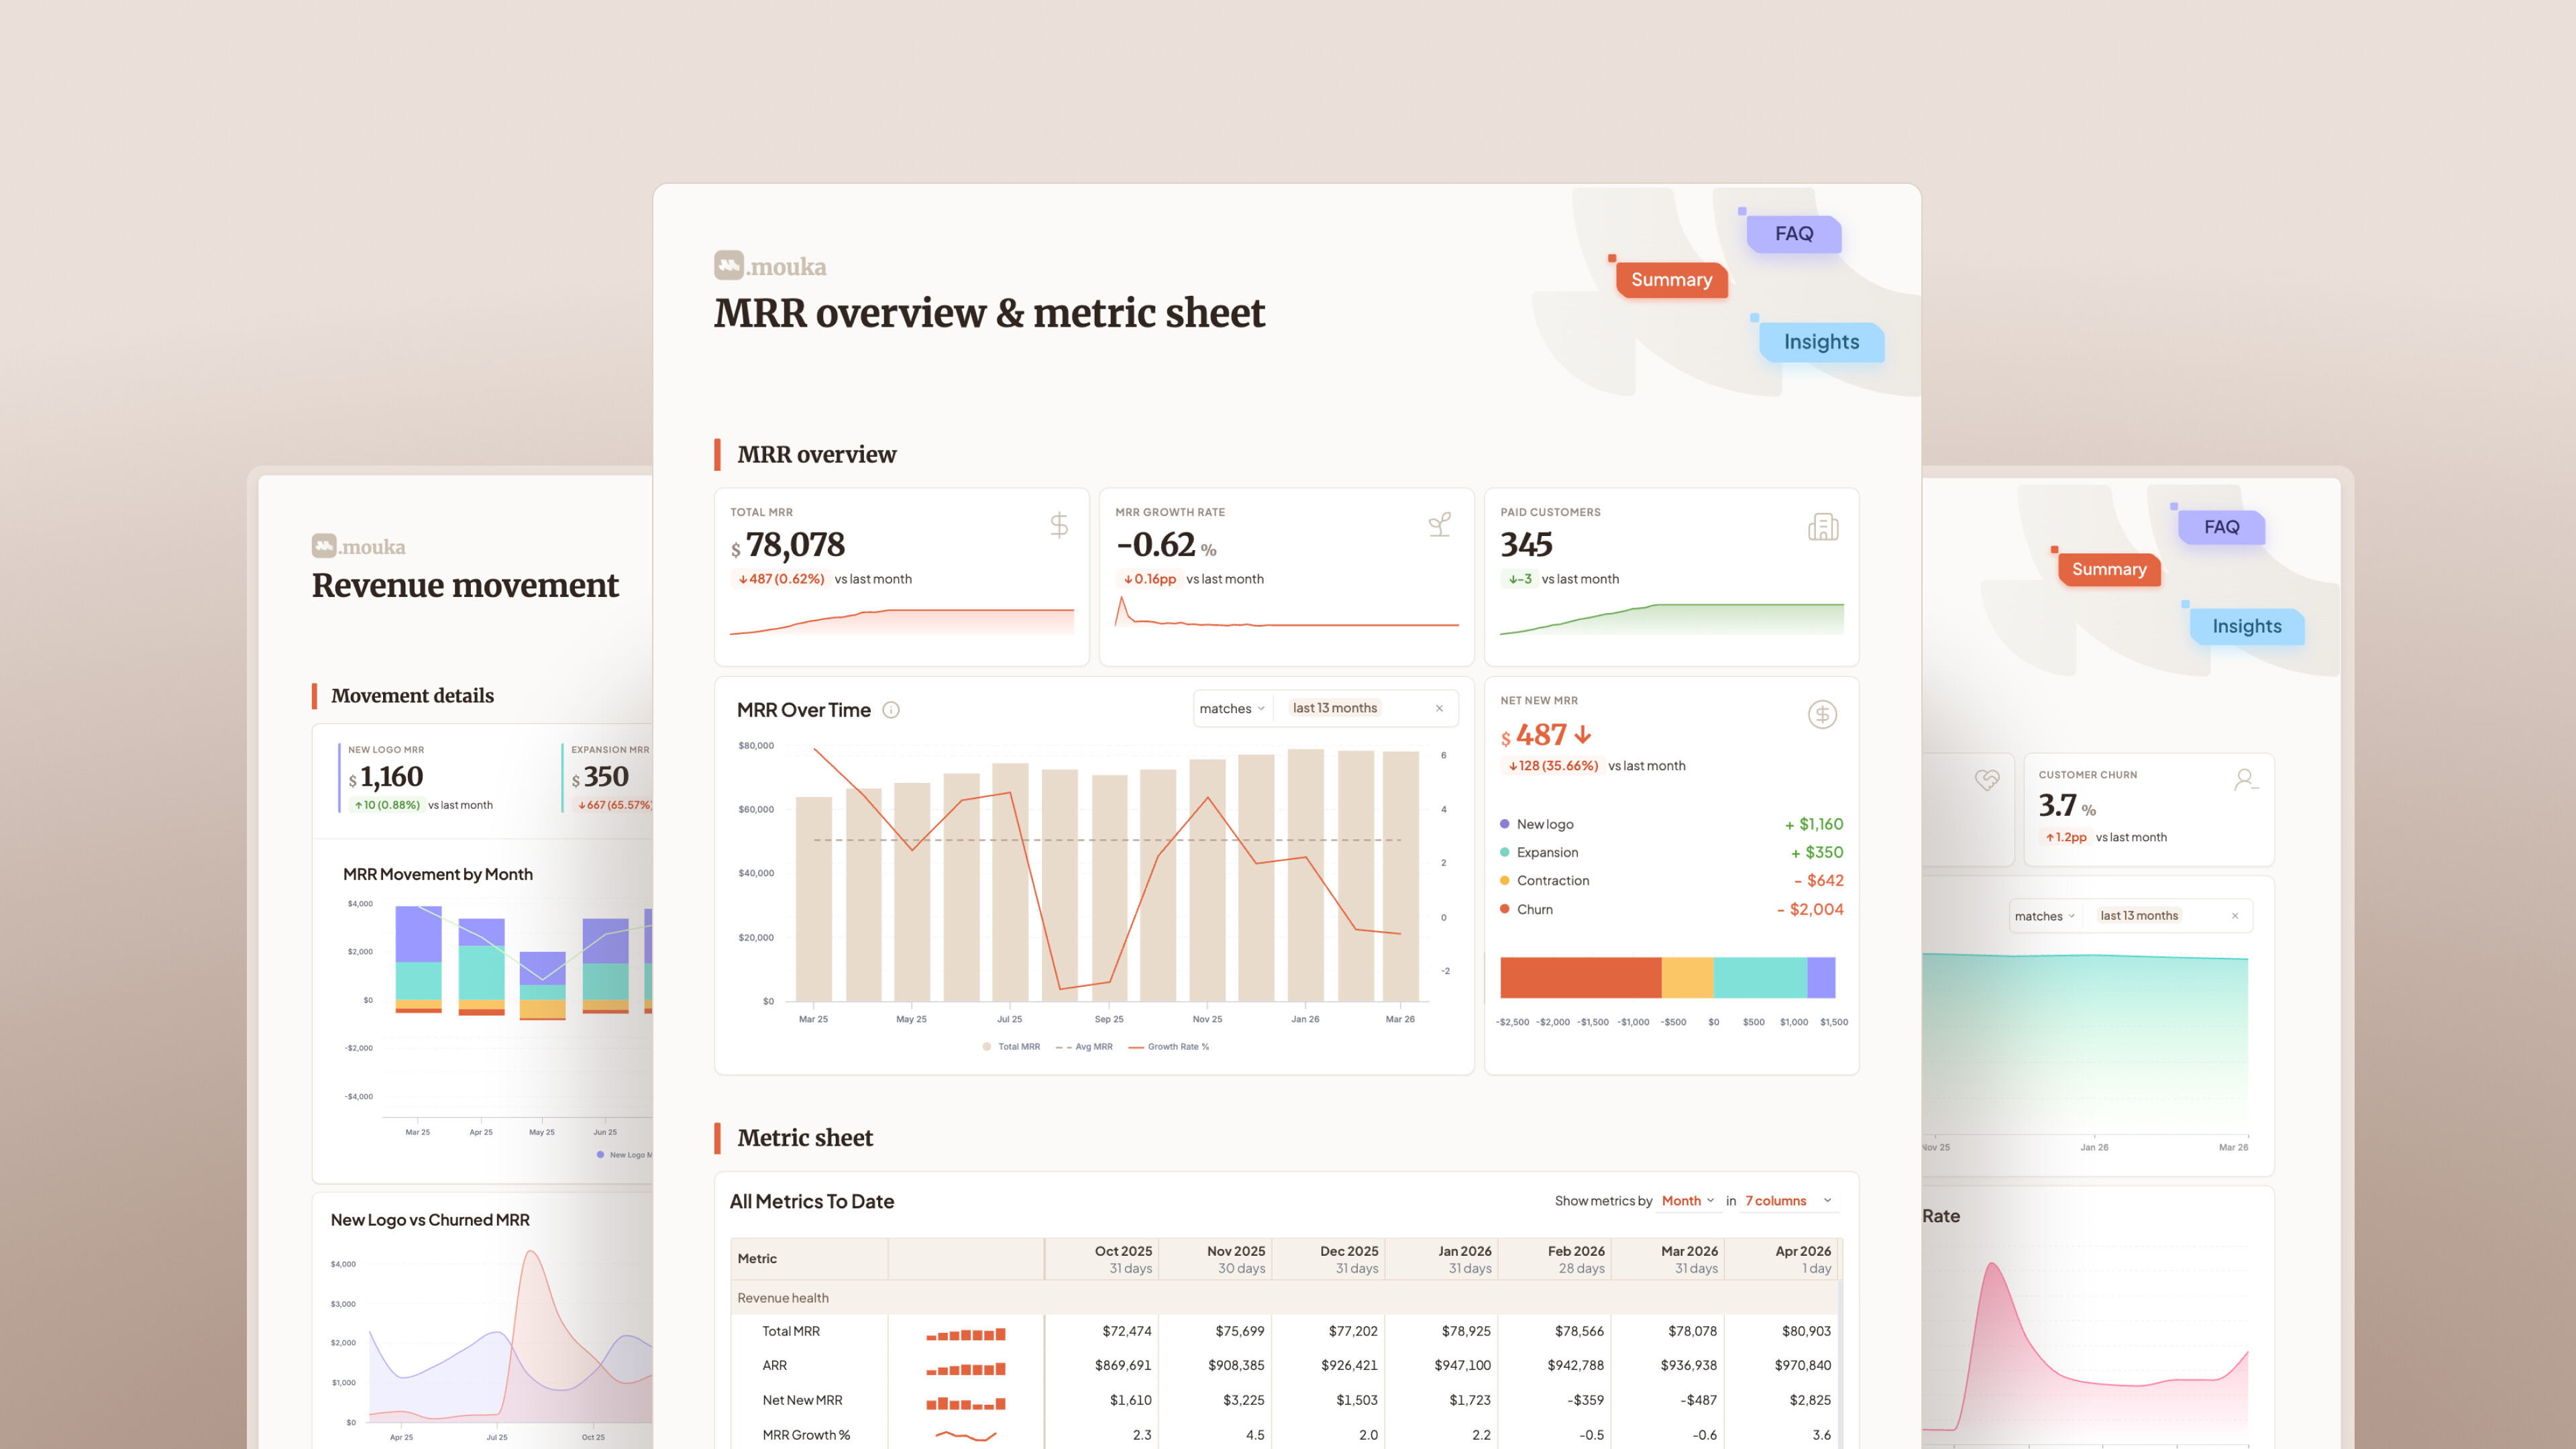
A single-page MRR command center built entirely in Holistics AML, designed for SaaS CEOs and revenue teams.
Dashboard Link + Password

 What it tracks
- 26 metrics across 4 tabs: Overview, Revenue Movements, Churn & Retention, Customers & Segments
- MRR health, net new MRR breakdown, churn risk, and customer concentration
- 5 MRR movement types: New Logo, Expansion, Reactivation, Contraction, Churn
 Built with Holistics
- Canvas Dashboard — pixel-level layout with layered blocks, free positioning, and tab navigation for multi-page storytelling following the 3-30-300 rule
- AML (Analytics Modeling Language) — entire dashboard defined as code: version-controlled, reviewable, and reproducible across environments
- Library Blocks — reusable block templates (info popovers, KPI cards) that snap into any dashboard, keeping design consistent at scale
- TextBlock with embedded HTML/CSS — custom CSS-only hover popovers on every chart explaining definition, formula, and how to read it — no click, no external tools
- DashboardTheme — centralized theme layer controlling fonts, colors, shadows, and spacing across all blocks in one place
- Full viz coverage — bar, line, stacked area, waterfall, donut, cohort retention heatmap, dual-axis trend lines, and KPI cards with sparklines, all configured in AML
- Direct SQL + modeling layer — metrics defined once in the model, reused across every chart, ensuring a single source of truth
 6 stories the data tells
- Revenue grows while customer count declines — quality over quantity
- Churn is the primary risk, with visible August spike
- Annual vs monthly subscriptions show distinct churn profiles
- Revenue is geographically diversified (NA 35%, EU 33%, Asia 19%)
- No single customer exceeds 3% of MRR
- Expansion roughly offsets churn; new logos are the true growth engine
 Hope you enjoy exploring the Mouka SaaS MRR Dashboard — and that every metric tells a story worth acting on!